Demand forecasting is an integral business process for manufacturers. Manufacturers require accurate forecasts in order to:
- plan the scaling of manufacturing operations
- ensure sufficient inventory
- guarantee customer fulfillment
Part-level demand forecasting is especially important in discrete manufacturing where manufacturers are at the mercy of their supply chain. In recent years, manufacturers have been investing heavily in quantitative-based forecasting that is driven by historical data and powered using either statistical or machine learning techniques.
Demand forecasting has proven to be very successful in pre-pandemic years. The demand series for products had relatively low volatility and the likelihood of material shortages was relatively small. Therefore, manufacturers simply interpreted the number of shipped products as the “true” demand and used highly sophisticated statistical models to extrapolate into the future. This previously provided:
- Improved sales planning
- Highly optimized safety stock that allowed maximizing turn-rates, provided fairly good service-delivery performance
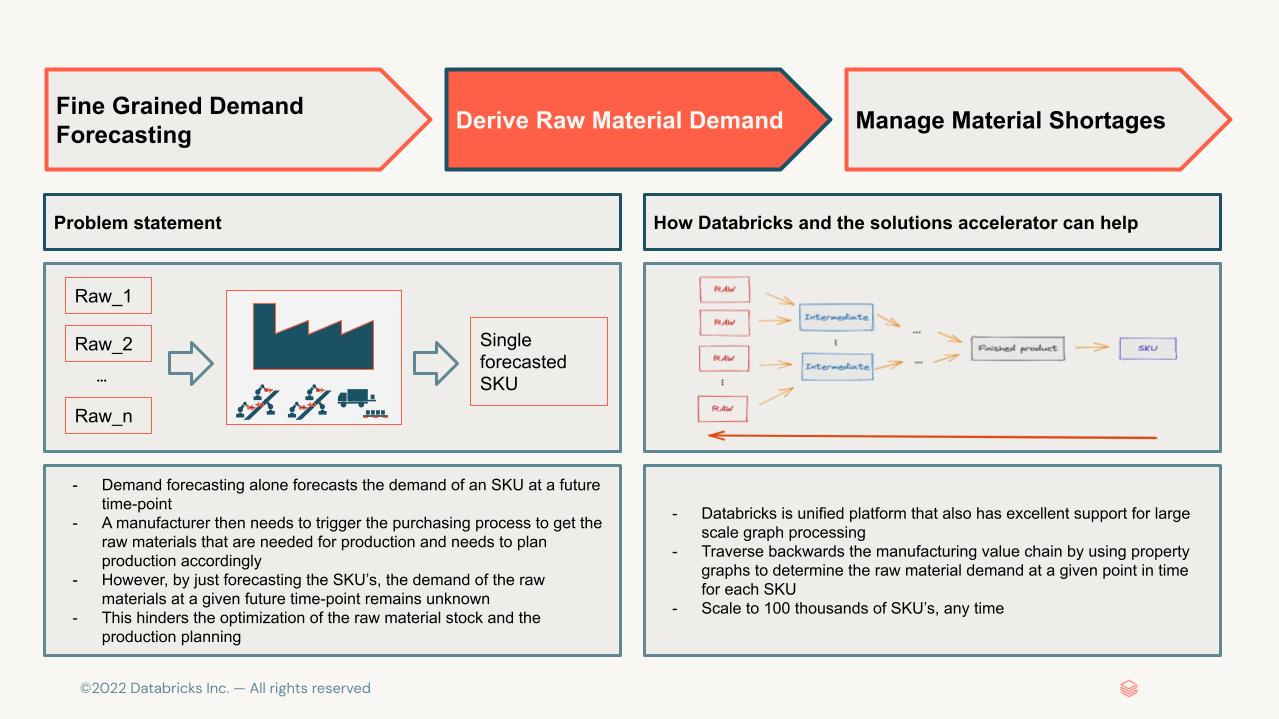
- An optimized production planning by tracing back production outputs to raw material level using the bill of materials (BoM)
However, since the pandemic, demand has seen huge volatility and fluctuations. Demand dropped hugely in the early days, led by a V-shaped recovery that resulted in underplanning. The resulting increase in orders to lower-tier manufacturers in fact evoked the first phase of a supplier crisis. In essence, production output no longer matched actual demand, with any increases in volatility often leading to unjustified recommendations to increase safety stock. Production and sales planning were forced by the availability of raw materials rather than driven by the actual demand. Standard demand planning approaches were approaching major limits.
A perfect example can be found in the chip crisis. After first reducing and then increasing orders, car manufacturers and suppliers have had to compete with the increased demand for semiconductors due to remote work. To make matters worse, several significant events drove volatility even further. The trade war between China and the United States imposed restrictions on China’s largest chip manufacturer. The Texas ice storm of 2021 resulted in a power crisis that forced the closure of several computer-chip facilities; Texas is the center of semiconductor manufacturing in the US. Taiwan experienced a severe drought which further reduced the supply. Two Japanese plants caught fire, one as a result of an earthquake. Reference: Boom & Bust Cycles in Chips (https://www.economist.com/business/2022/01/29/when-will-the-semiconductor-cycle-peak)
Could statistical demand forecasting have predicted the aforementioned ‘force majeure’ events? Certainly not! However, we think that Databricks offers an excellent platform to build large-scale forecasting solutions to help manufacturers maneuver through these challenges.
- Collaborative notebooks (in Python, R, SQL, Scala) can be used to explore, enrich, and visualize data from multiple sources while accommodating business knowledge and domain expertise
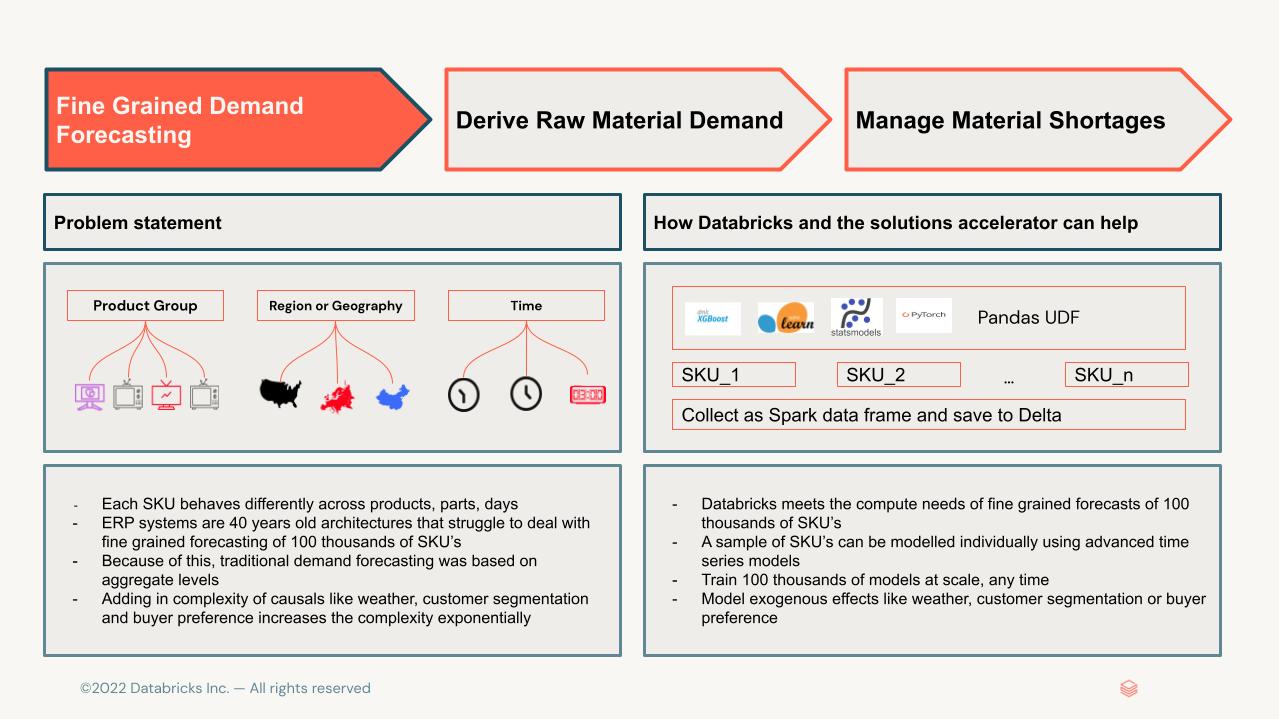
- Modeling per each item (e.g. product, SKU, or part) can be parallelized, scaling to thousands of items
- Tracking experiments using MLFlow ensures reproducibility, traceable performance metrics, and easy re-use.
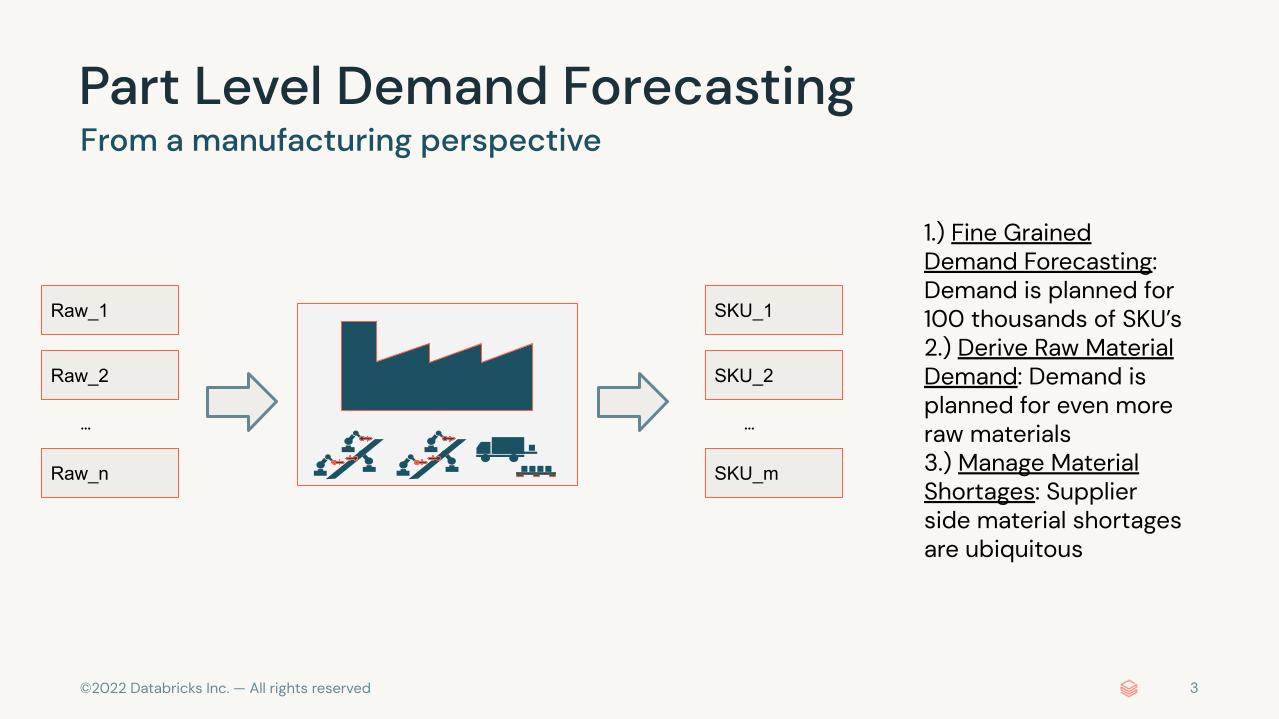
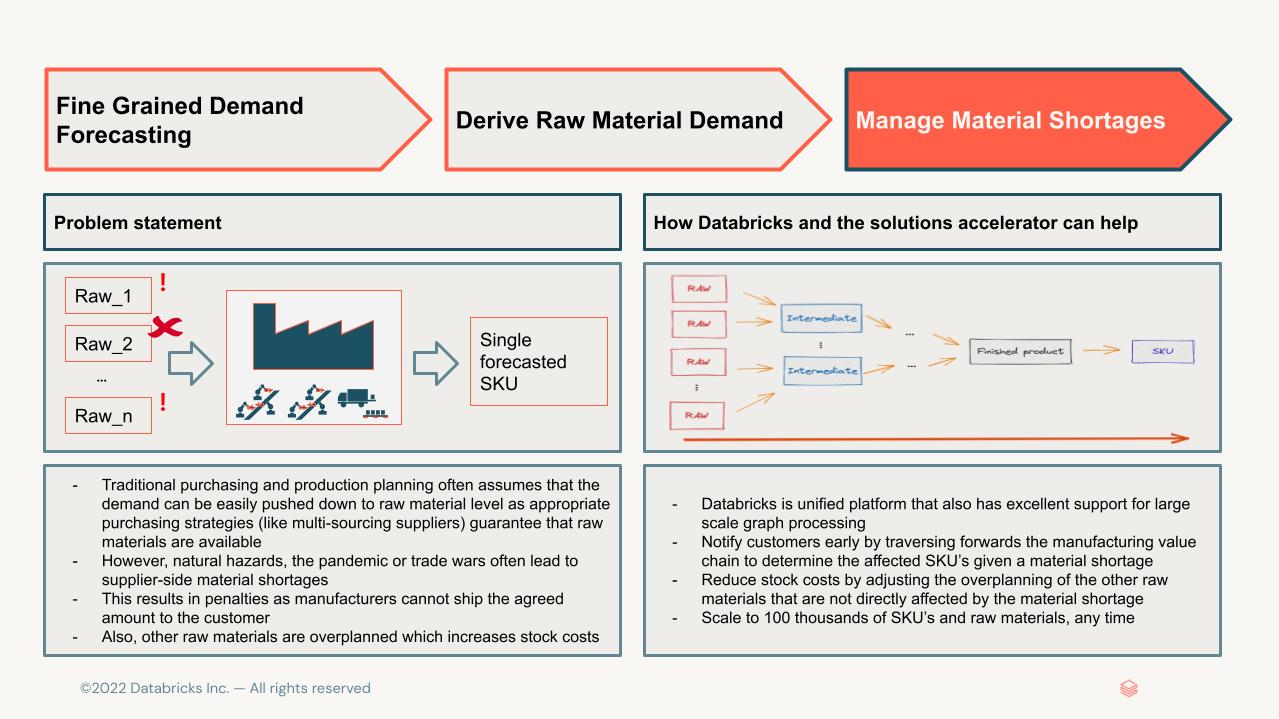
In this solution accelerator, we will show-case the benefits of using Databricks on a simulated data set. We assume the role of a tier one automotive manufacturer producing advanced driver assistance systems. We will then proceed in three steps:
Fine Grained Demand Forecasting Derive Raw Material Demand Manage Material Shortages© 2022 Databricks, Inc. All rights reserved. The source in this notebook is provided subject to the Databricks License [https://databricks.com/db-license-source]. All included or referenced third party libraries are subject to the licenses set forth below.
| Library Name | Library license | Library License URL | Library Source URL |
|---|---|---|---|
| hyperopt | Individual License | https://github.com/hyperopt/hyperopt/blob/master/LICENSE.txt | https://github.com/hyperopt/hyperopt |
| networkx | BSD-3-Clause License | https://github.com/networkx/networkx/blob/main/LICENSE.txt | https://github.com/networkx/networkx |
| graphframes | Apache-2.0 License | https://github.com/graphframes/graphframes/blob/master/LICENSE | https://github.com/graphframes/graphframes |
To run this accelerator, clone this repo into a Databricks workspace. Attach the RUNME notebook to any cluster running a DBR 11.0 or later runtime, and execute the notebook via Run-All. A multi-step-job describing the accelerator pipeline will be created, and the link will be provided. Execute the multi-step-job to see how the pipeline runs.
The job configuration is written in the RUNME notebook in json format. The cost associated with running the accelerator is the user's responsibility.


