Mostly broken: code not (yet) migrated to Twitter's new developer authentication API (July 25th 2018).
Try https://github.com/dataknut/hashTagR instead
Makes extensive use of:
To make comments or analysis requests, raise an issue:
- See the code.
I can't guarantee to respond but it's worth a go.
Or better still, fork & DIY :-)
tweetBluePlanet2: visualisation of tweeting behaviour around BBC's totally awesome Blue Planet 2 programe (October - November 2017)
- Latest results
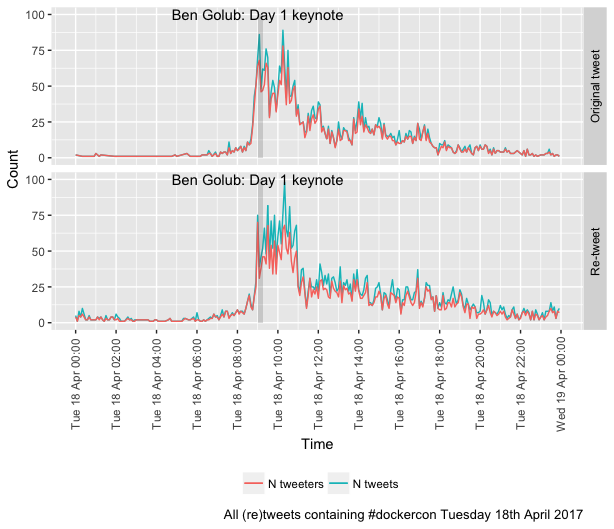
We are collecting & visualising #dockercon tweets for the entire week of these conferences, saving them to an archive and then running them through some R processing & analysis code. The chart below is a simple visualisation of the tweetFlow (TM :-) of tweets and re-tweets on Day 1 of the Austin 2017 conference with the first keynote session 'grey-lighted'.
For full results (to date) which include all days, more days, tweeing locations, zoomable charts and visualisations of tweetStreaks by the most prolific tweeters see:
