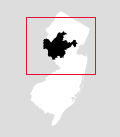
The WNYC Data News team used this generator to make the minimaps for our 2014 election results page.
It uses PhantomJS and a dummy webpage to draw a D3 map and save it as an image.
The example configuration will draw minimaps of New Jersey House of Representatives districts.
- Install PhantomJS.
- Get at least one GeoJSON file with the features you want minimaps for (see "Data").
- Edit
config.jsonwith your options (see "Configuration"). - Edit
style.csswith your preferred colors and styles (see "Styling"). - Run
phantomjs render.jsfrom your Terminal. - Gaze upon your new minimaps and do the dance of joy.
You can also preview what the minimaps will look like by viewing generate.html in a browser (see "Previewing").
If you have questions, ask us!
Your minimaps will be drawn based on GeoJSON files. You can supply two:
- a foreground file. This should have each feature you want to highlight. If you want a minimap of New Jersey house districts, this should be a GeoJSON file of those districts. THIS IS REQUIRED.
- a background file. This will be used to draw a background layer under the highlighted feature. This will be the same for each minimap in the set. So, if you want a minimap of New Jersey house districts, this could be the entire state of New Jersey. This is optional.
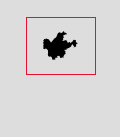
Without a background file:
With a background file:
You need to set the path to each file in config.json:
"backgroundFile": "geo/NJ-background.geojson",
"foregroundFile": "geo/NJ-house.geojson"
The foreground and background can both be the same file:
"backgroundFile": "geo/NJ-house.geojson",
"foregroundFile": "geo/NJ-house.geojson"
But if you do that, you may get weird little border artifacts in the background, so it's probably better to use a background file that merges everything into one feature (e.g. the whole state of New Jersey as a single feature).
In config.json, you set the options that will determine how your maps look. Here's a minimum example config:
{
  "foregroundFile": "geo/NJ-house.geojson",
  "url": "http://localhost/minimaps/generate.html",
  "width": 120,
  "height": 137
}
This will produce a 120x137 PNG minimap for each house district in New Jersey, saved as 0.png, 1.png, 2.png, etc.
Here's a config with more options:
{
  "foregroundFile": "geo/NJ-house.geojson",
  "backgroundFile": "geo/NJ-background.geojson",
  "url": "http://localhost/minimaps/generate.html",
  "width": 120,
  "height": 137,
  "padding": 10,
  "propName": "House District",
  "outputPrefix": "png/NJ-house",
  "useBoxes": true,
  "format": "gif"
}
foregroundFile
The path to the GeoJSON file with your highlightable feature(s) in it.
url
A URL (either local or remote) where generate.html can be loaded.
width
The width for each image, in pixels.
height
The height for each image, in pixels.
backgroundFile
The path to the GeoJSON file with your background feature(s) in it.
If this is not set, there is no background layer.
padding
A minimum padding, in pixels, between the edge of your map and the actual edge of the image. You may want some buffer, especially if you're including useBox to draw rectangles around them, some of which will extend beyond the map.
If this is not set, the minimum padding is 0.
propName
What property name should each feature's image be saved with? If you set:
"propName": "county"
and your feature has:
{
  "type": "Feature",
  "properties": {
    "county": "Rockland"
  },
  "geometry": ...
}
You will end up with a file named Rockland.png for that feature.
If you don't supply this, images will be saved with sequential numbers (0.png, 1.png, etc.).
outputPrefix
You can include a prefix at the start of each filename. For example, if you want to save files to the png/ subfolder and you want each file to start with "counties-" you can use:
"outputPrefix": "png/counties-"
useBoxes
Set this to true to draw a box around each feature. You can style the box (see "Styling").
format
What image format to save as. This can be png, gif, jpeg, or pdf. Default is png.
In the example config, the background is white, the district is black, and the rectangle around it is a 1px red box. You can change all of these things by editing style.css.
Changing the value of stroke will change the color of the border around something.
Setting stroke-width will determine the width of that border.
Setting fill will change the fill color.
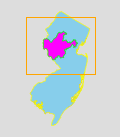
For example:
.background {
  stroke: yellow;
  fill: skyblue;
}

.foreground {
  fill: fuchsia;
  stroke: lime;
}

.box {
  stroke-width: 1px;
  stroke: orange;
}
You can set an overall background color for the image by changing the body's background color:
body {
  background-color: white;
}
The default is transparent, which is only supported if your format is png or gif. If you're making jpgs instead, make sure to set a background color.
If you want to preview your maps, you can load generate.html with a preview parameter:
generate.html?preview
This will rotate every 500ms, cycling through each map indefinitely, as a quick preview.
If you want to preview the map for a specific feature, you need to supply the value for propName (if that's been configured), or the zero-based index of the feature:
//"propName": "county"
generate.html?preview=Rockland

//No propName in config.json, just preview the first feature
generate.html?preview=0

//No propName in config.json, just preview the second feature
generate.html?preview=1
Technically, if you want to hyperefficient, you might want to render a separate PNG for the background layer (the state) and the foreground (the district), and then show them as layers. This would shave off a little bit of file size by not duplicating the state in every file. On the other hand, our way is a lot easier, and as long as you minify the PNGs with something like imagemin, they're only like 2k each so do you really need to shave this particular yak?


