In Silico Modeling for Tumor Growth Visualization
A science project by F. Jeanquartier, C. Jean-Quartier, D. Cemernek and A. Holzinger with the Holzinger Group, Research Unit HCI-KDD. Get in contact with one of the developers via mail f.jeanquartier[at]hci-kdd.org
This is app is for the purpose of scientific simulation and visual analysis of tumor growth.
The app makes use of the Cellular Potts Model (CPM) implemented in Java.
The html5 frontend makes use of the cytoscape.js library for visualization output.
- CPM Model
The CPM model is a popular lattice-based, multi-particle cell-based formalism, also used for modeling tumor growth, first described by Graner & Glazier 1992.
- Cytoscape Visualization
We make use of the graph theory and visualization library Cytoscape.js to create simulation output in html.
More details can be found in our journal publication: In silico modeling for tumor growth visualization – F. Jeanquartier, C. Jean-Quartier, D. Cemernek and A. Holzinger, BMC Systems Biology.2016, 10:59, DOI: 10.1186/s12918-016-0318-8
And on the tumor growth profiles extension in particular: Tumor growth simulation profiling. - C. Jean-Quartier, F. Jeanquartier, D. Cemernek and A. Holzinger, In International Conference on Information Technology in Bio-and Medical Informatics (pp. 208-213). Springer International Publishing, DOI: 10.1007/978-3-319-43949-5_16
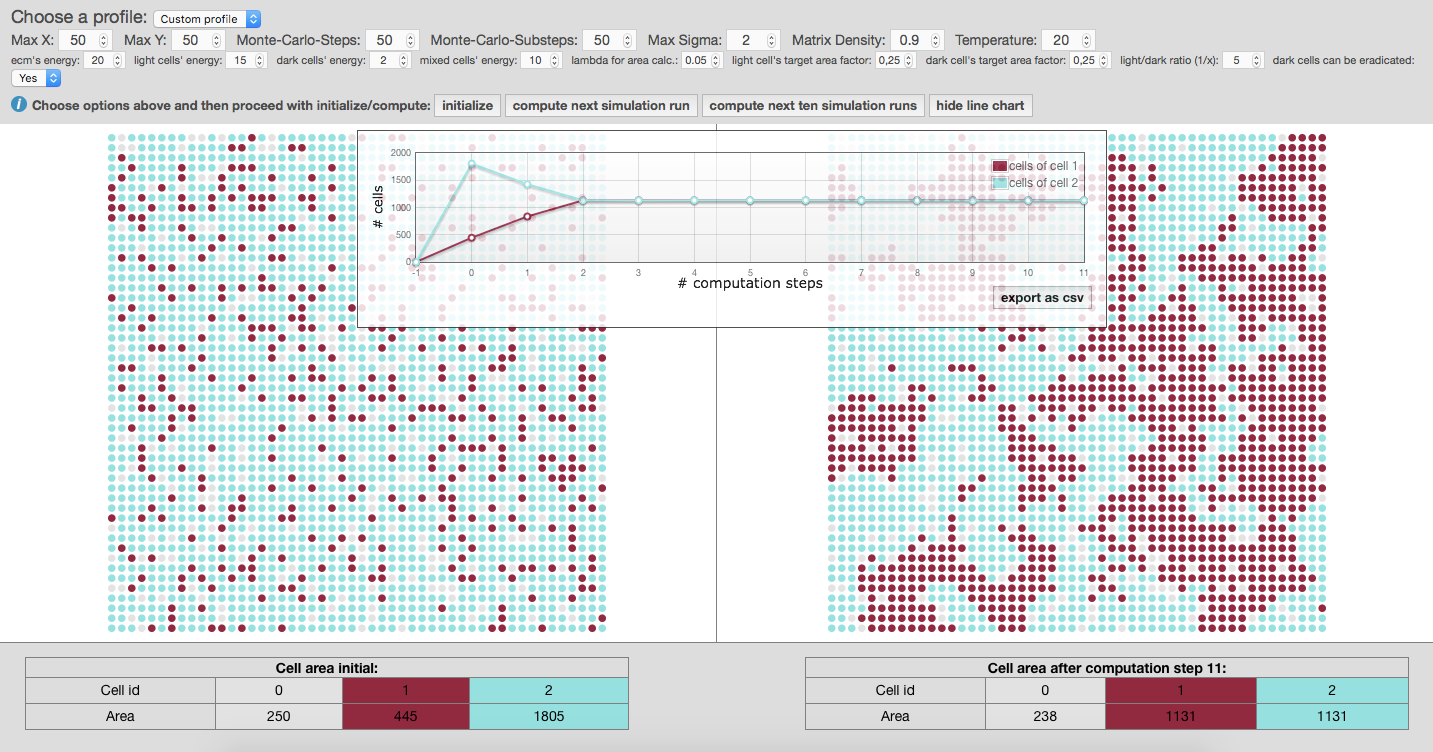
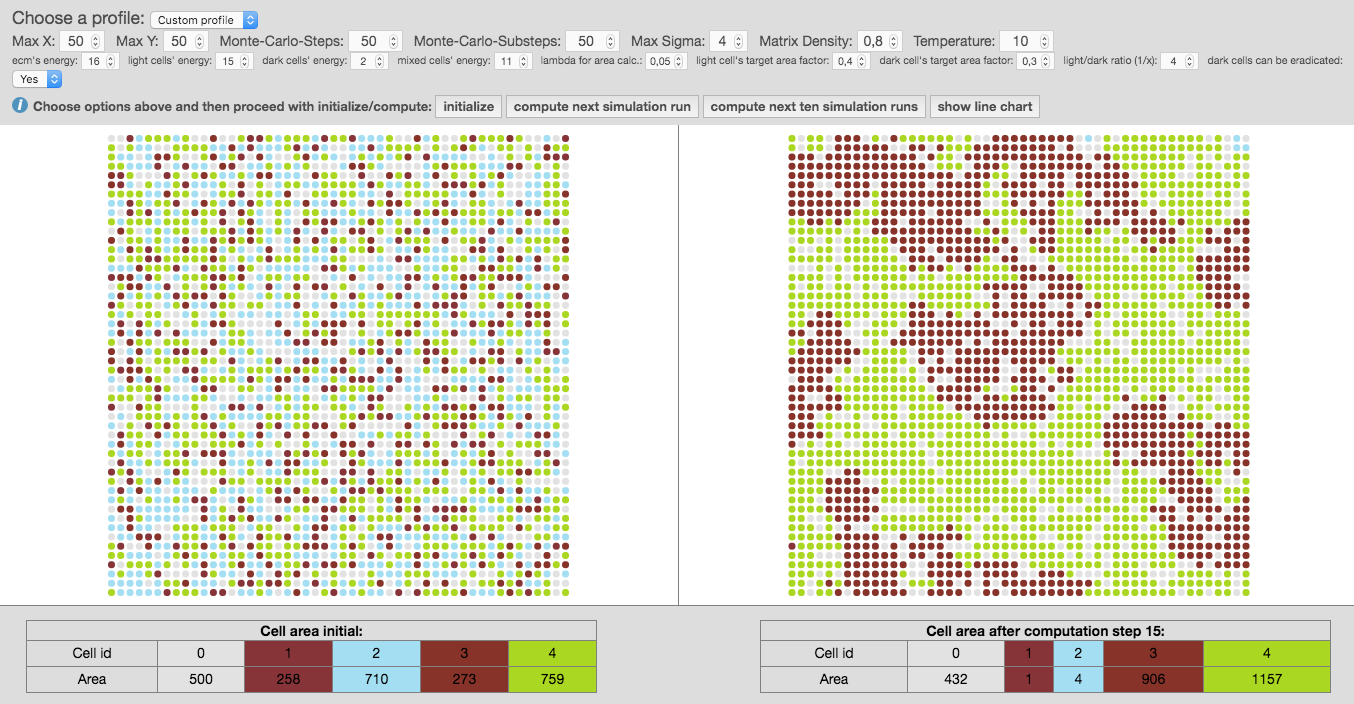
See the overview of the tool's user interface
####Tutorial On Modeling Brain Tumor Growth with cpm-cytoscape####
-
Start the tool via a local build according to the instructions presented below (please note, the demo-server is temporary offline).
-
Go to the tools top section for input parameters and type in the values, given in list beneath. Alternatively, you can try out variations in order to simulate your own sample properties and start a new experiment. By varying several parameters the user is allowed to simulate a wide range of conditions.
-
Max X:50
-
Max Y:50
-
Monte-Carlo-Steps:25
-
Monte-Carlo-Substeps:100 (or smaller down to 25, if you want to have a slower growth rate)
-
Max Sigma:2
-
Matrix Density:1
-
Temperature:4
-
ecm's energy:8
-
light cells' energy:30
-
dark cells' energy:3
-
mixex cells' energy:2
-
lambda for area calc.:0.05
-
light cell's target area factor:1
-
dark cell's target area factor:1
-
light/dark ratio:2
Parameters comprise: lattice size
x * y,
count ofmonte carlo stepsandsubsteps(representing units of time),
number ofcell types σ, namely dark (tumor) and light (normal) cells,
matrix density(given the cell density between dark and light cells in proportion to extracellular matrix),
temperature T(resembling cellular motility),
cell-typeinteraction parameters J(so-called boundary energy coefficient determining cell growth as multiplicative degree of freedom),
cellularelasticity index λ(representing a growth limiting factor),
cell-typetarget areas,
and initializationratiobetween dark (tumor/mutated) and light (normal/healthy) cells
-
After pressing the button
initialize, the graph is created on a grid, randomly presenting individual cells as group of nodes, also called cellular bricks. Colored nodes represent cellular bricks and uncolored nodes are part of the extracellular matrix and resemble the cellular environment without peculiar growth variables. Dark nodes, shown in red, are attributed to cancerous cells and light nodes, shown in blue, stand for normal cells. -
Now you can use the button
compute next simulation runor calculate the next ten computation cycles at once by using the option [compute next two simulation runs]. The given experimental area will be then completely filled after 7 to 8 computation steps. So, malignant cells within the experimental area will have reached their critical mass by then. The simulated cancer cells grow according to Gompertz kinetics imitating 2D cultured glioma cells or spheroids implanted in animals (compare Rubenstein et al. 2008). One computation step now accounts for 50 hours. If you change input parameters of MCS and substeps the time factor will change appropriately, also depending on the size of matrix, given by parameters X and Y. Using the previous input parameters for X and Y equaling 50, the experimental area amounts for up to 2500 cells. -
Press the button
show line chartwill give you the summary of previously calculated steps which you can download as spreadsheet using the option [export as csv]. The line chart shows the amount of computation steps on the x-axis and the amount of cellular bricks on the y-axis. -
Finally, we encourage readers to use GitHub for having a closer look at our implementation, explore it's features and suggest enhancements as well as participate in the development. :)
The app can be easily deployed by making use of the WAR file. Another option is to deploy the whole source. We further encourage developers developers to revise existing.
To run this app you need a Java capable webserver such as Apache Tomcat and at least java version 1.7 to run the app.
Download the latest WAR file 'cpm-cytoscape.war' from https://github.com/davcem/cpm-cytoscape/tree/master/target/cpm-cytoscape.war.
Deploy the war file on your Java capable Webserver such as Tomcat and start the server.
Open a webbrowser and type in the url to the deployed webapp such as http://localhost:8080/cpm-cytoscape/ and start playing around with the app.
Download the latest sources from https://github.com/davcem/cpm-cytoscape/tree/master/src/main.
Create a webapp folder on your Java capable Webserver such as Tomcat and start start the server.
Open a webbrowser and type in the url to the deployed webapp such as http://localhost:8080/cpm-cytoscape/ and start playing around with the app.
We encourage you to have a look at our source code, give us feedback and contribute to the cpm-cytoscape project to foster in silico simulation in cancer research!
We know, that not every clinician and/or scientist is able to run his own web servlet or respectively java capable webserver. Unfortunately our demo server went offline. We are working on another updated online version for demo use: Meanwhile, please try out the the app by deploying the WAR as local tomcat app and give us feedback.
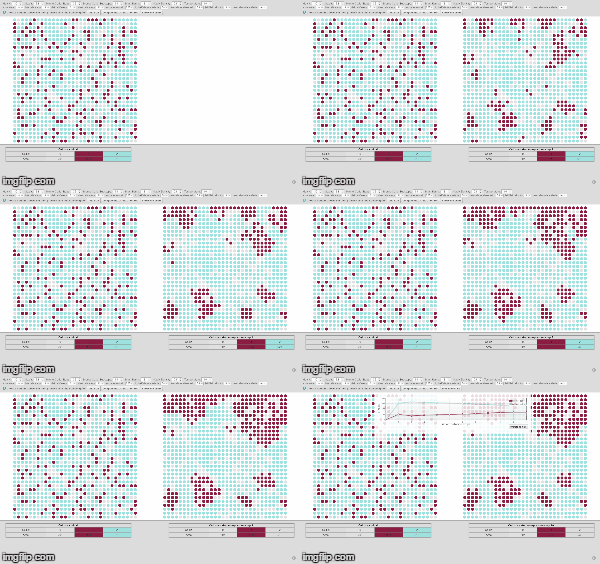
See an example showing several simulation steps as animated GIF also below:
We thank the CGV Institute of the University of Technology Graz for providing the demo server. We thank the HOLZINGER GROUP for giving us the opportunity to get feedback on this research. We also thank all participants for their contributions to the development of components for cpm-cytoscape software.
The content of this project itself is licensed under the Creative Commons Attribution 3.0 license, and the underlying source code used to format and display that content is licensed under the MIT license.


