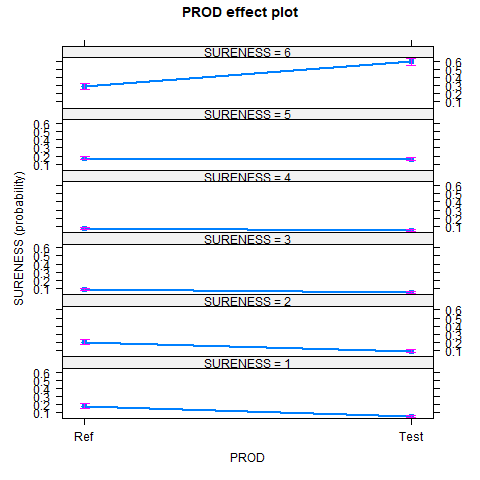
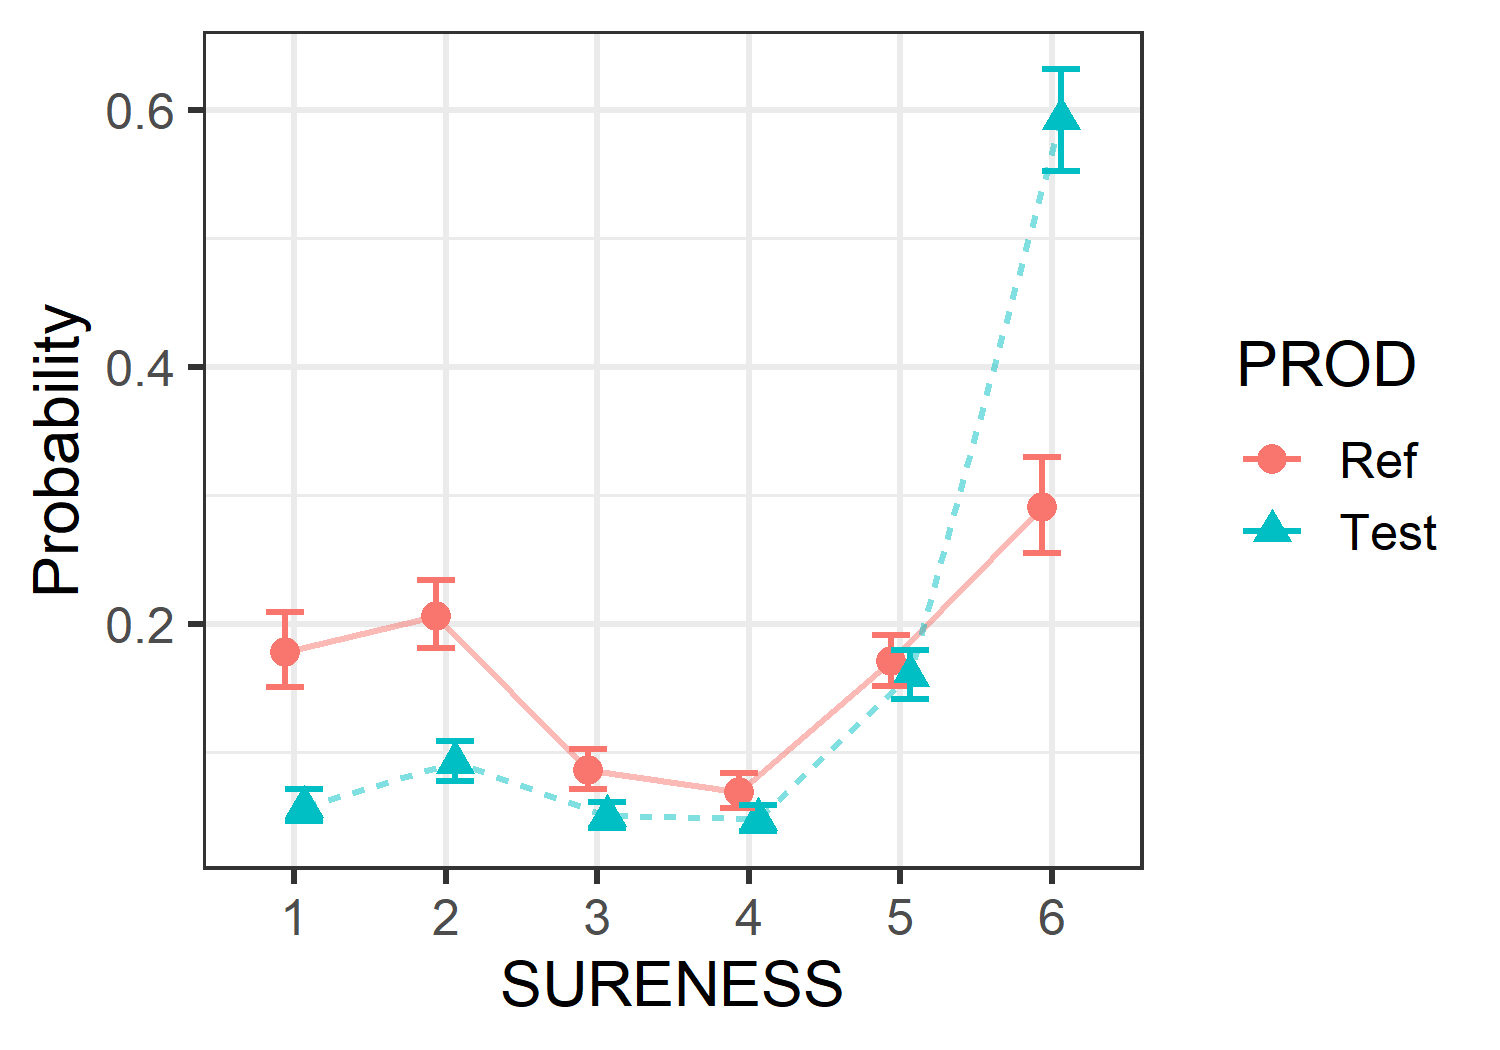
Improved effect plots for ordinal models
library(devtools)
install_github("davedgd/ordinalEffects")
library(ordinal)
library(effects)
library(MASS)
library(ggplot2)

library(devtools)
install_github("davedgd/ordinalEffects")

mm1 <- clmm(SURENESS ~ PROD + (1|RESP) + (1|RESP:PROD),
            data = soup,
            threshold = "flexible")

# using effects
png(file = "p1.png")
plot(Effect("PROD", mm1))
dev.off()
# using ordinalEffects
ordinalEffects::OrdinalPlot(Effect("PROD", mm1), mm1, soup)
ggsave("p2.png", width = 5, height = 3.5)Plot Code:
pd <- position_dodge(0.25)
ggplot(PlotDat$data, aes(x = SURENESS, y = prob, group = PROD)) +
geom_point(aes(shape = PROD, color = PROD), position = pd, size = 3) +
geom_line(size = .75, position = pd, alpha = 0.5, aes(linetype = PROD, color = PROD)) +
geom_errorbar(aes(ymin = lower, ymax = upper, color = PROD), width = .5, position = pd, size = .75) +
labs(y = "Probability") +
theme_bw(base_size = 15)

