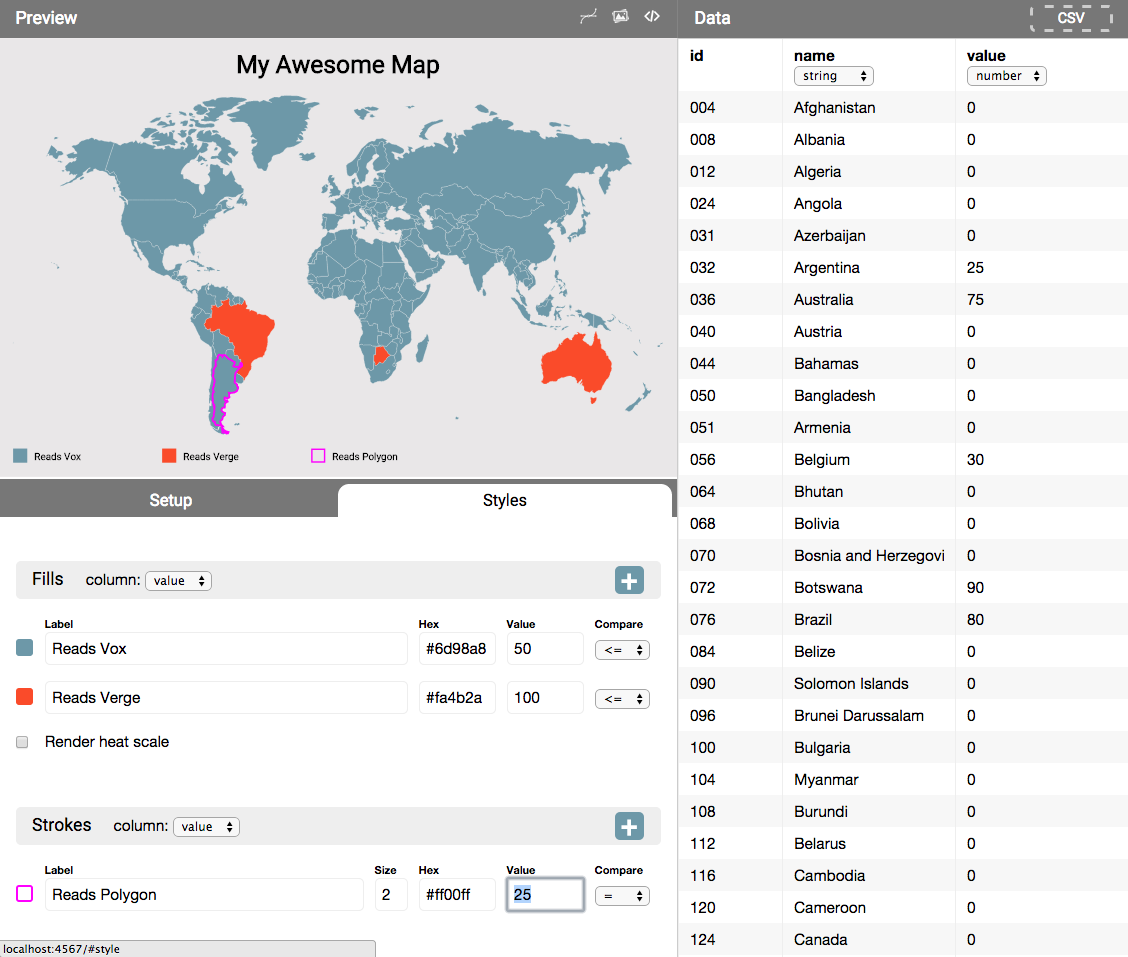
This tool uses D3 to generate choropleth map graphics based upon a data set. Drop in your CSV data, configure your color thresholds, and adjust your display settings. This is a proof of concept app that still needs many features built out, however we welcome any editorial community to use this as a starting point for building great mapping tools. Existing features:
- World and US State maps.
- Thresholds and heat scale fill rendering.
- Stroke rendering for select shapes.
- Basic legend layout.
- Export as PNG
- Export as SVG (needs cleanup)
- Interactive tooltip (needs interactive export option)
1) Install Middleman and the app:
gem install middleman
cd mapper
bundle install
2) To run the app:
bundle exec middleman
The app should startup at localhost:4567.
3) To build the app:
bundle exec middleman build
This will generate a static /build directory with flat HTML, CSS, and JS files that may be uploaded to any web server.
Use the provided CSV templates to format your data:
csv/us-state.csvcsv/world.csv
You may add additional columns to those data templates. The mapper application only requires that the id column remain unchanged for mapping shapes to data rows.
This is a proof of concept project and we encourage contributions. Please review our guidelines and code of conduct before contributing.
- Greg MacWilliam, Vox Media.
