Makes pseudo trades using Stochastic RSI and Bollinger Bands indicators
Using script make sure to:
- pip install -r /path/to/requirements.txt
- Run main.py
The python-binance is a open source library which you can find: https://github.com/sammchardy/python-binance
main.py:
This script contained all the bots changeable information. With the information the script initializes and new TradingBot and calls the backtest function to begin.
TradingBot.py:
More descriptions for each function are in the comments
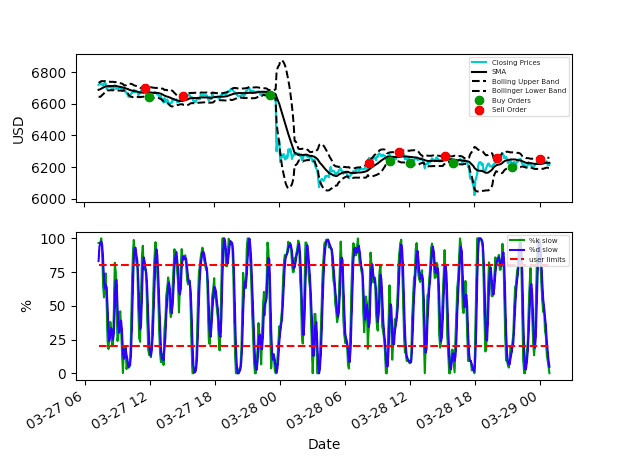
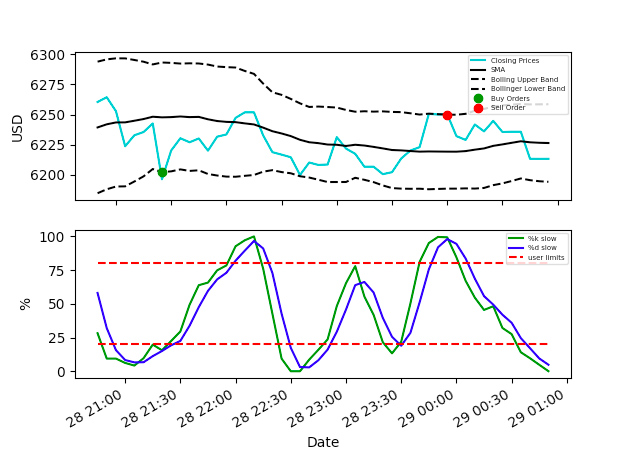
The general idea for this bot was to utilize both the Stochastic RSI and Bollinger Band indicators to determine what to place a buy order and then when to sell it. This bot will not actually create the orders, it just states when it would have created the orders and the values associated with those orders. All indicator information and buy and sell positions are display plot using matplotlib.
As you can see both images above show both the Stochastic RSI, Bollinger Band, closing prices, and the buy and sell positions.
Full information on indicators can be found on https://www.investopedia.com/
RSI (Relative Strength Index):
The relative strength index (RSI) is a momentum indicator that measures the magnitude of
recent price changes to evaluate overbought or oversold conditions in the price of a stock or other asset.
Stochastic RSI:
The Stochastic RSI (StochRSI) is an indicator used in technical analysis that ranges between zero
and one (or zero and 100 on some charting platforms) and is created by applying the Stochastic oscillator formula
to a set of relative strength index (RSI) values rather than to standard price data.

'rsi_period' --> The number of prices changes until rsi value is calculated
'stochastic_period' --> The number of rsi values used in calculating stochastic rsi values
'k_slow_period' --> The number of k_fast values averaged
'd_slow_period' --> The number of k_slow values averaged
Bollinger Bands:
A Bollinger Band® is a technical analysis tool defined by a set of lines plotted two standard
deviations (positively and negatively) away from a simple moving average (SMA) of the security's price.

'simple_moving_average_period'
'bollinger_band_standard_deviation' --> The number of standard deviations you want the upper and lower bands to be
Bot Changeable Attributes:
'pair' : 'BTCUSD' --> You can choose what ever combination of assets you wish to use. They just have to be available
on the binance.us exchange

'stochastic_upper_band' --> This is the upper limit value of the stochastic rsi for putting a sell order
'stochastic_lower_band' --> This is the lower limit value of the stochastic rsi for putting a buy order
'time_look_back' --> How long ago to start pulling historical data from EX: '1 month ago UTC'
'asset_interval' --> The interval of the asset pairs market data  EX: Client.KLINE_INTERVAL_5MINUTE,
'show_times' --> The number of times to show on plot 500 (limited by time_look_back and asset_interval)

