This is a single page responsive app that gives the user a snapshot of their expenses. The user will be able to quickly understand the data by glancing at a monthly total expense overview, month to month expense breakdown, and a transactions chart.
You can visit the app here!
React, JavaScript, Sass/SCSS, HTML5, and CSS3.
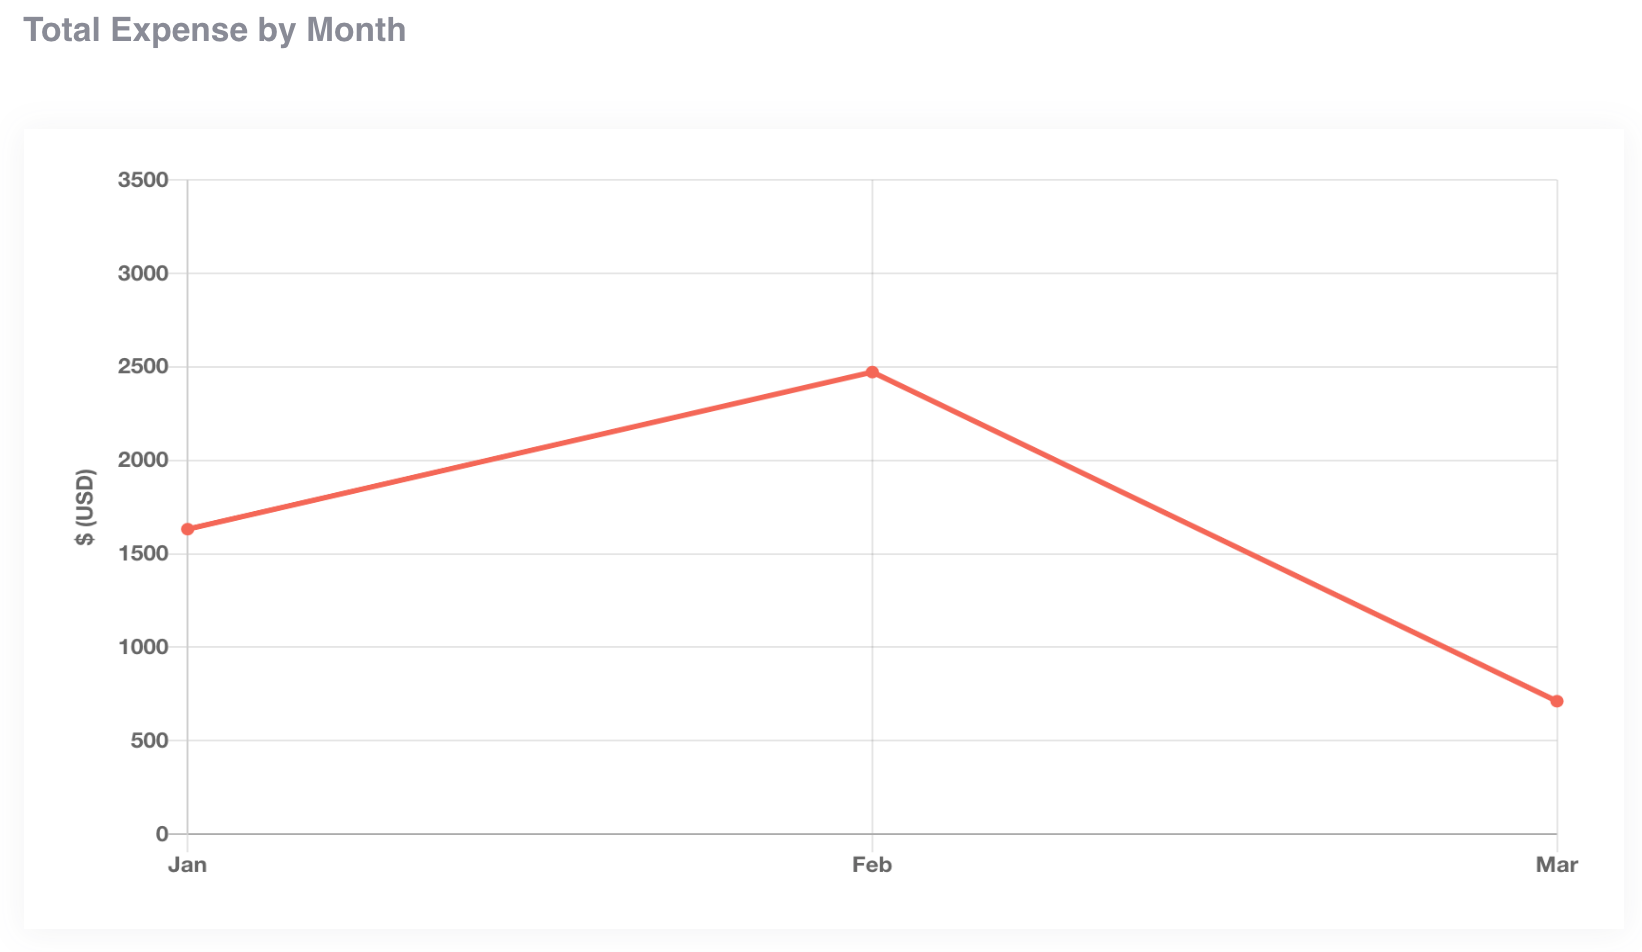
Created using Chart.js
User will be able to track total monthly expenses. Hoving over the month's data point on the graph, will display specific dollar amounts.
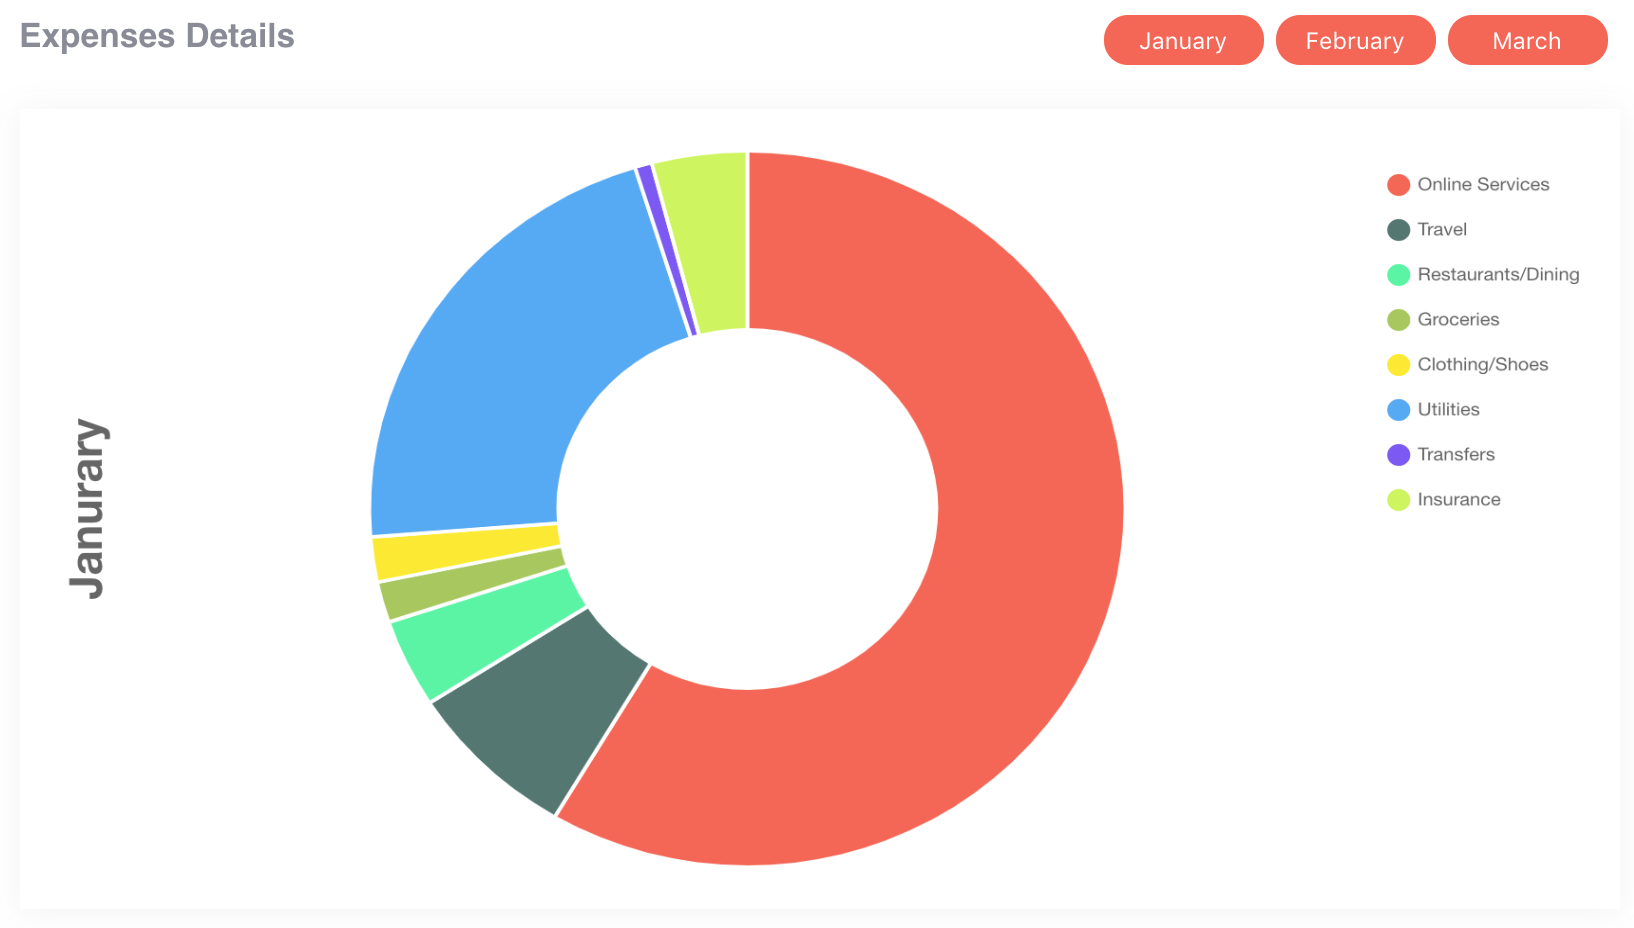
Created using Chart.js
User can view a month's expenses, breakdown into percentages for each category. Hoving over the category's section on the graph, will display specific dollar amounts. Also, the user can select a different month and the pie graph will dynamically regenerate to show the new data.
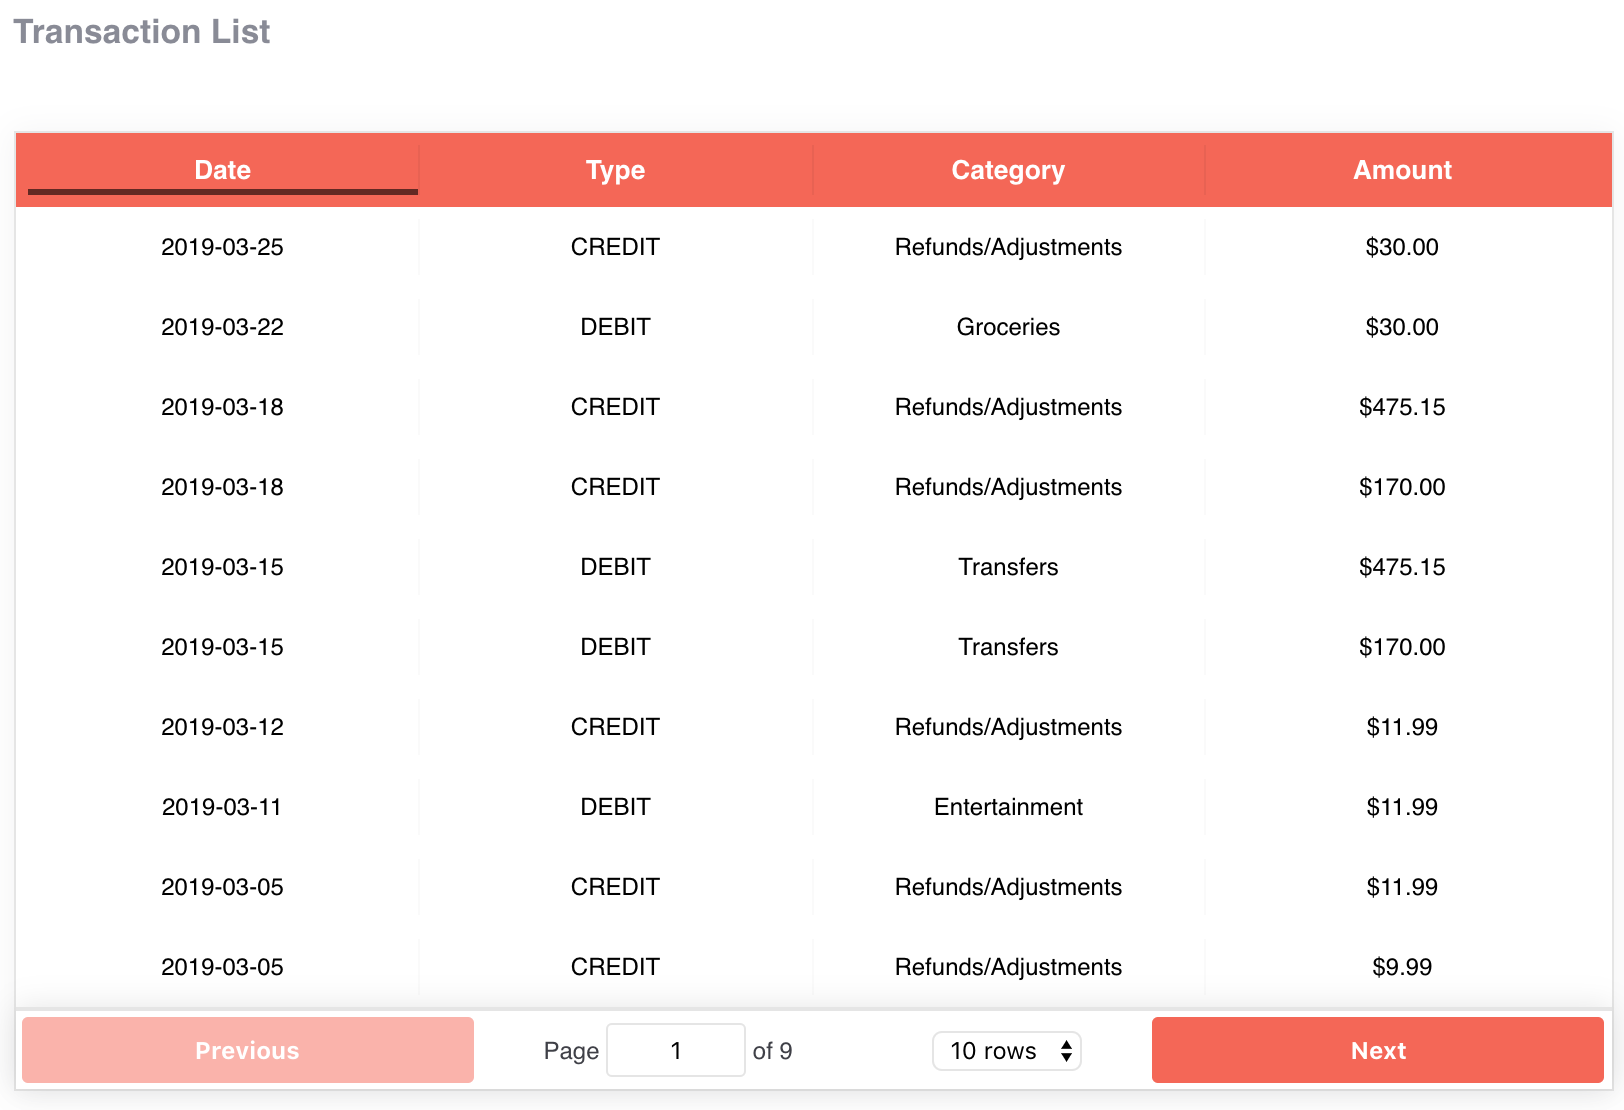
Created using React Table
User can view all transactions made and can also sort through them by date, type, category, or amount.


