A workflow for quantifying clade abundance in phylogenetic trees.
Version: 0.1
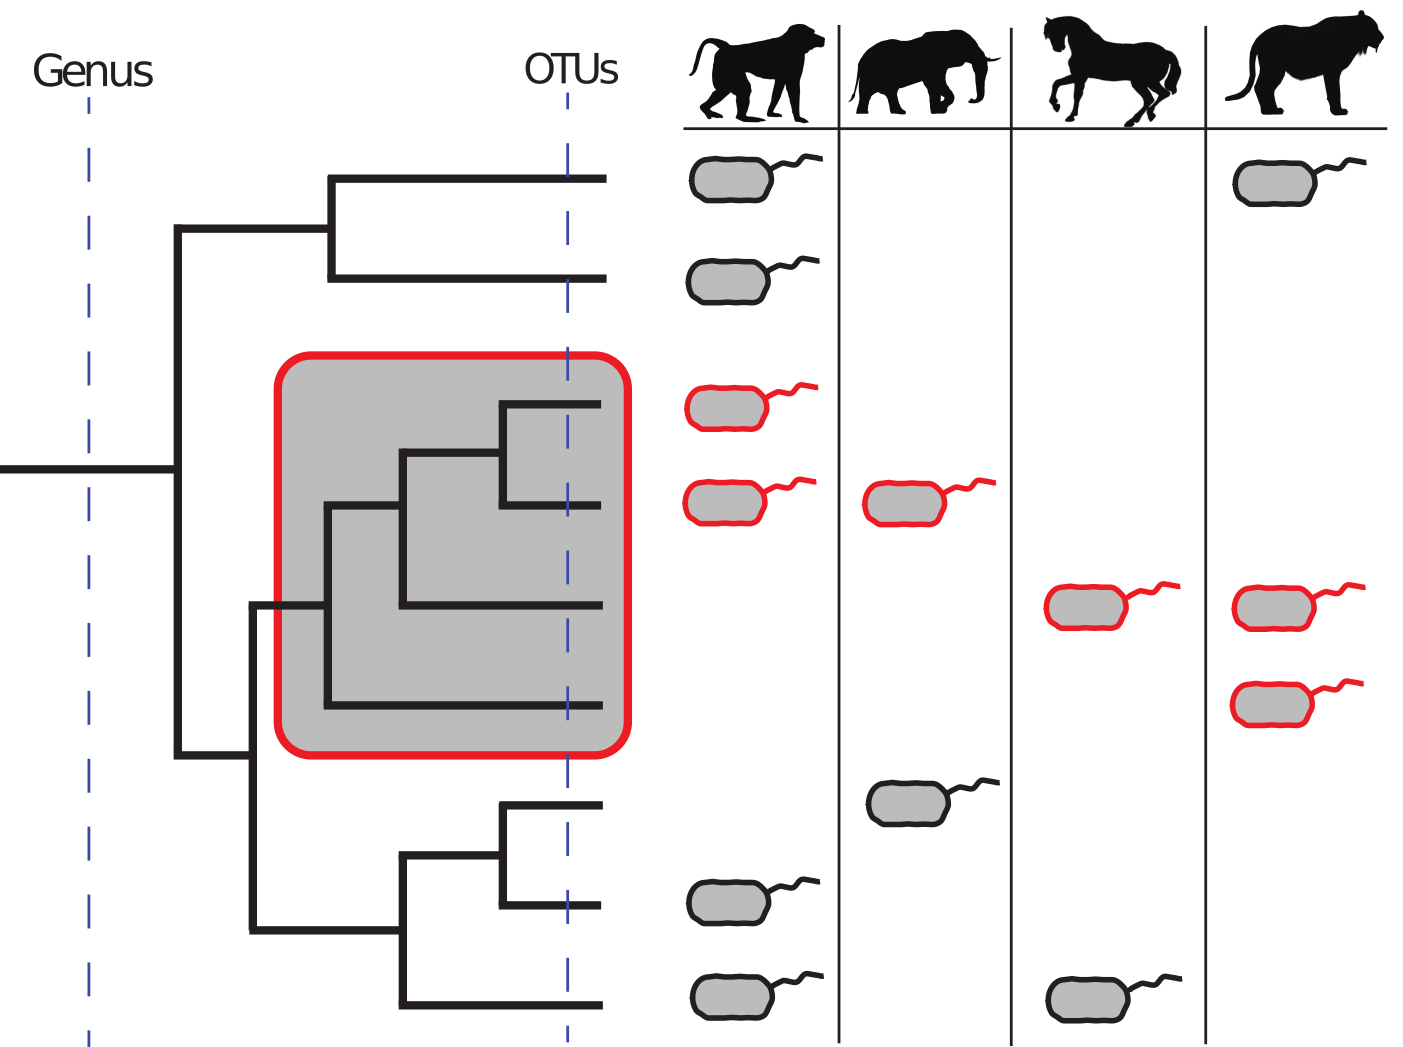
Incorporating phylogeny into the assessment of how microbial lineages are distributed across communities can identify monophyletic clades of microbes that collectively manifest an association with ecological factors. For example, the clade highlighted in red in the image above is universally present across all mammalian microbiome samples, indicating that the clade may have evolved a conserved trait that facilitated its ubiquitous distribution. If we were to consider this relationship at the OTU level (i.e., considering the tips of the tree as appropriate units), the redundancy of OTUs within this clade would obscure the detection of this relationship. On the other hand, if we were to consider the genus level, the aggregation of this clade with others that do not possess the trait would similarly obscure this relationship. The ClaaTU (Cladal Taxonomic Units) workflow uses data files produced by third party microbiome analysis software (e.g., QIIME, Mothur, DADA2, etc.) to identify and quantify the abundance of specific clades in a user provided phylogenetic tree. This allows us to examine the abundance of clades across the input tree from tip to root. Currently, ClaaTU is run as a collection of scripts and a workflow is provided below.
- python (2.7.10)
- dendropy (4.0.2)
- scipy (0.13.0b1)
- numpy (1.8.0rc1)
ClaaTU has only been tested with the versions of the packages indicated.
-
The first thing that ClaaTU needs is a newick tree without internal node identifiers. In this step ClaaTU decorates internal nodes with node identifiers that will be used in downstream scripts. If internal node identifiers are present in the tree provided Claatu will overwrite them.
python <path_to_ClaaTU/bin/prep_tree.py> <input_newick_tree.tre>The output of this script is a phylogenetic tree named "new_prepped_tree.tre". You will use this tree for the rest of the workflow.
-
Now that we have the ClaaTU ready tree we can get to work. The next script that we will run will take in a tab delimited table of OTU counts. You should have this from you microbiome analysis. Note that ClaaTU will not recognize a biom formatted table, so be sure to convert you biom table to text format.
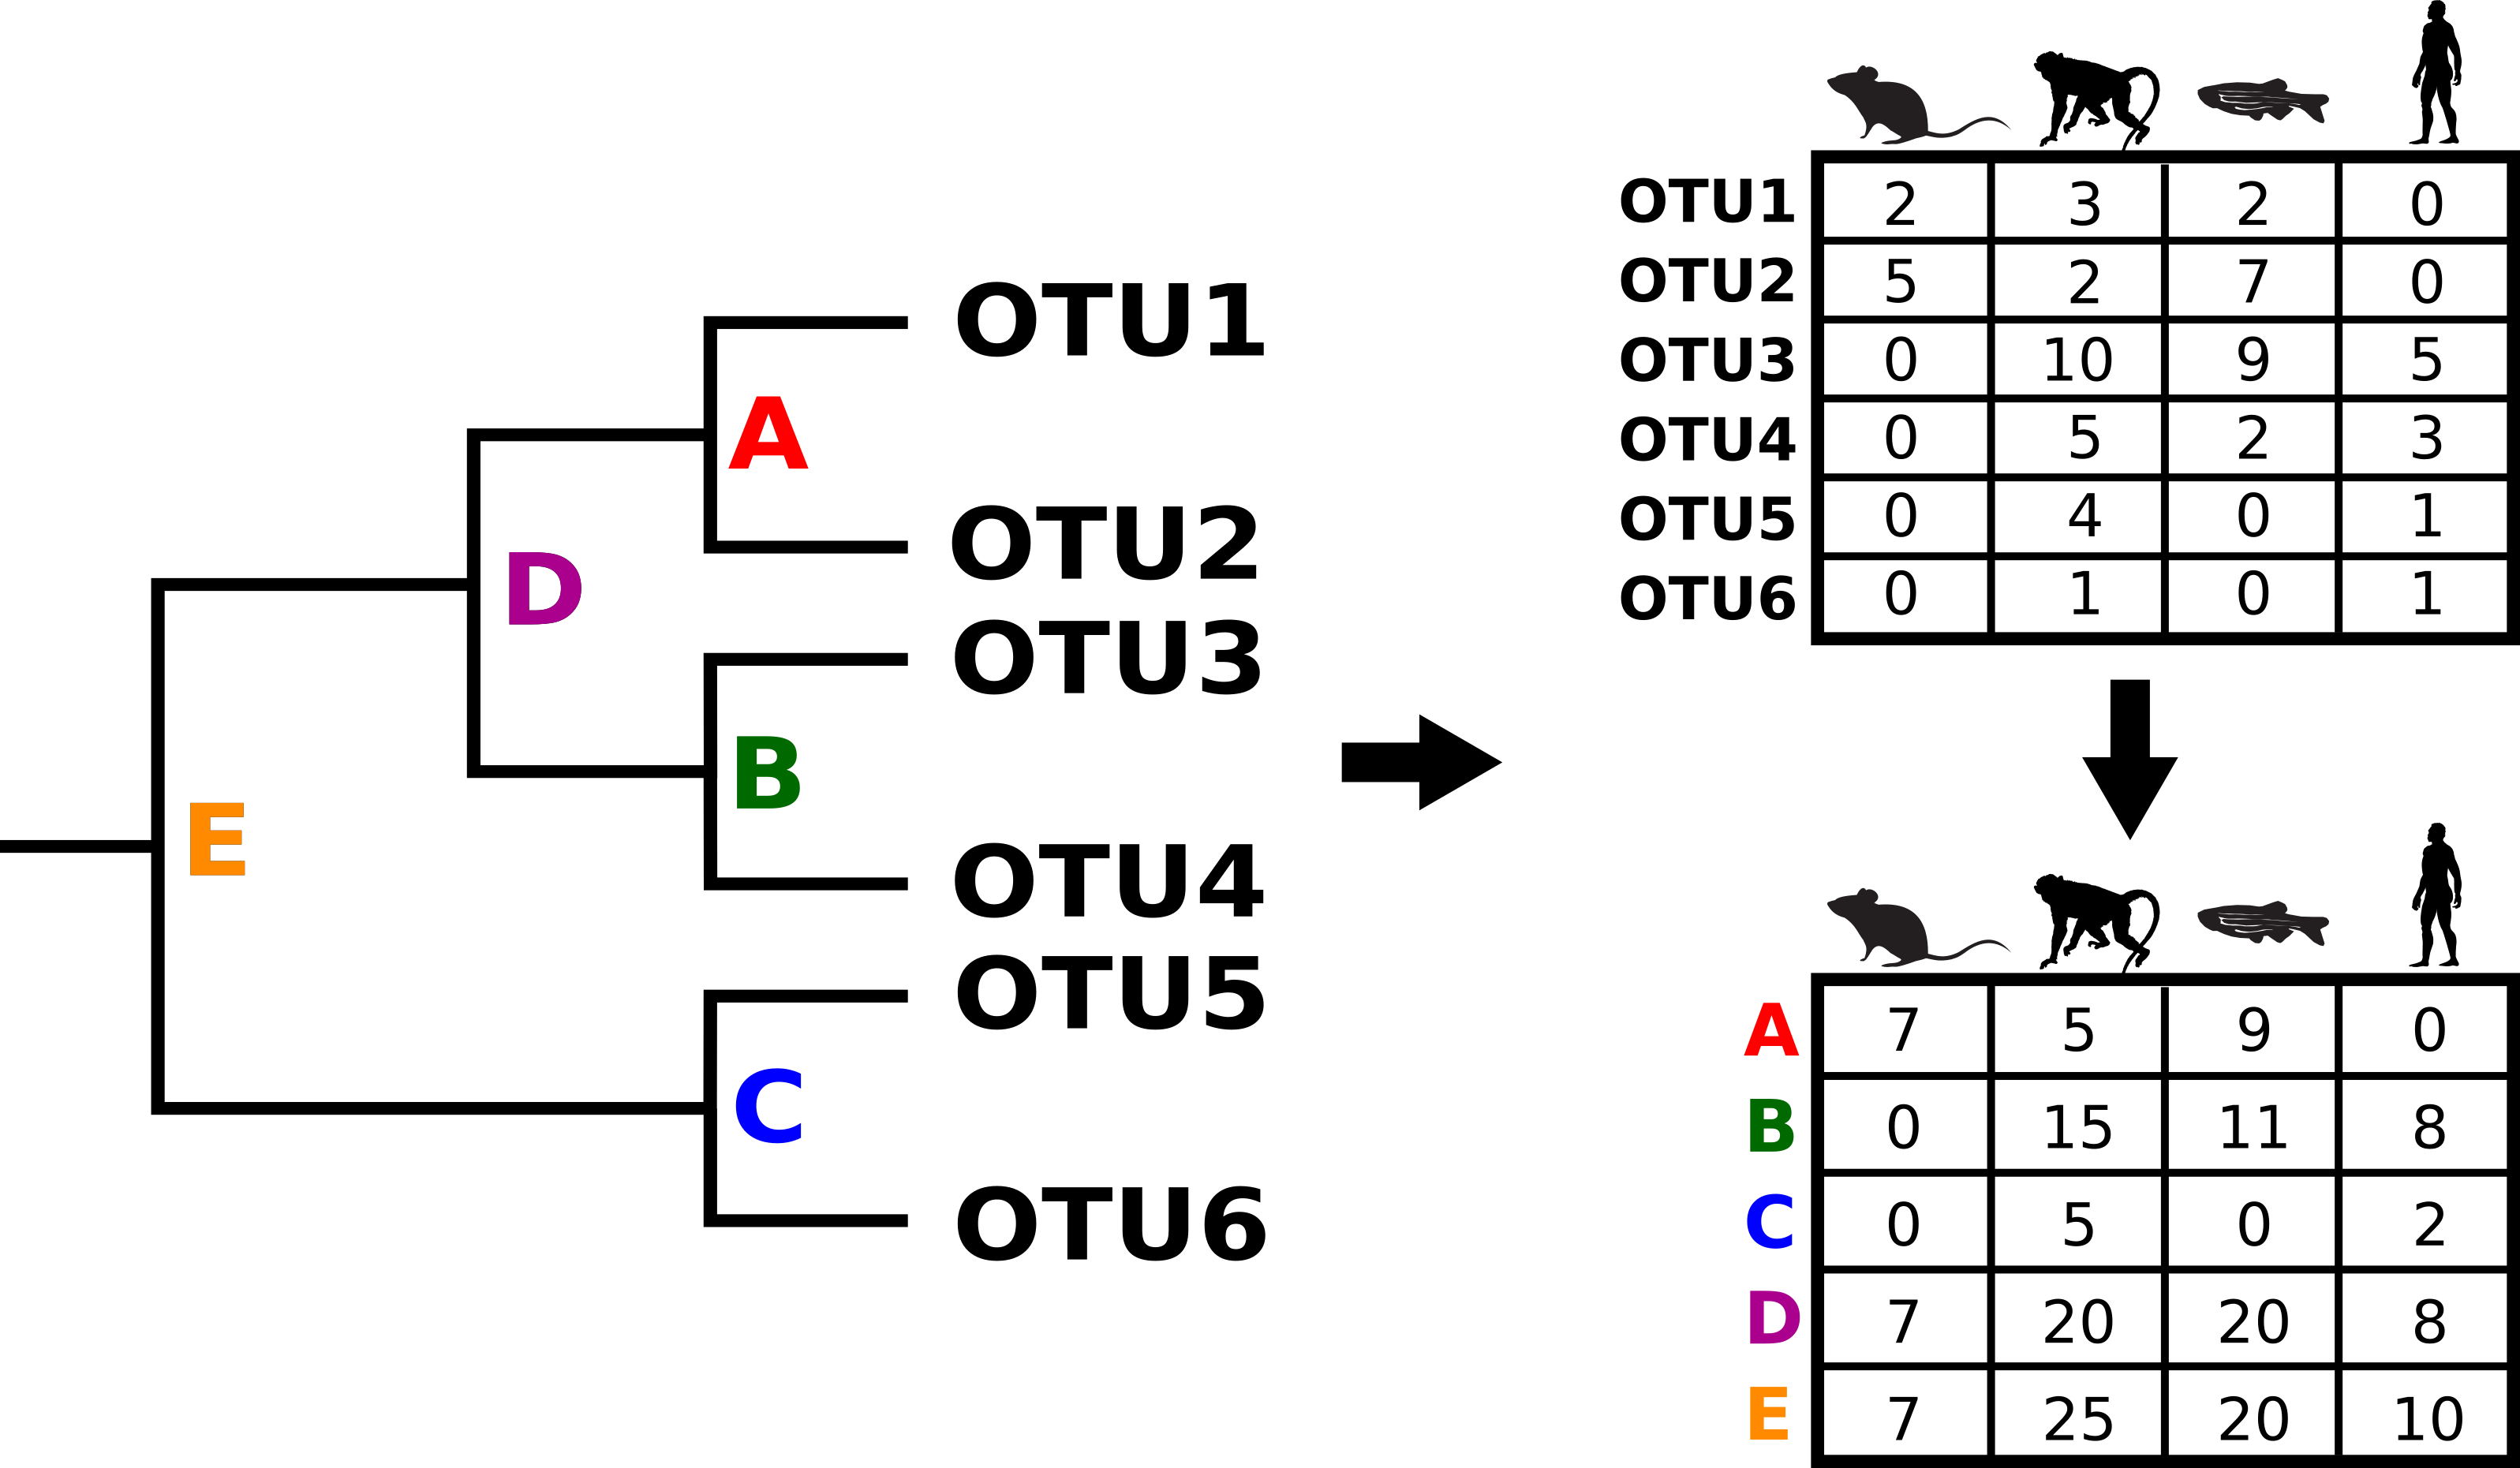
python <path_to_ClaaTU/bin/count_tree.py> <otu_table> <prepped_tree> <out_file_path>The output of this script is a clade counts table with internal node identifiers as columns and sample IDs as rows. These data can be used to examine differential abundance of clades across a case and control study. For some this might be where you stop if all you care about is what clades are in a sample and at what abundance. However, we have add some additional scripts downstream that some might find useful.
-
We realize that many researchers may be interested in the taxonomic labels associated with each clade, particularly if the clade is significantly different between case and control. Currently, we have attempted to address this need by implementing a strategy of propagation of taxonomic labels that use the taxonomic association of the tips (OTUs) and attempts to assign them to the ancestors of this tip. Importantly, this taxonomic label is only assigned to the ancestor of the tip if 100% of the other tips contained by the parent node also share this label. This script requires a taxonomy file, which may have been an output of upstream microbiome analysis. For example, if you used QIIME to analyze you data this file will be called something like rep_set_tax_assignments.txt. The first two columns of this taxonomy file should be OTU ID followed by a taxonomy string. This file must be tab delimited. Taxonomic label propagation can be performed by executing the following:
python <path_to_ClaaTU/bin/clade_stat.py> <prepped_tree> <tax_file> <out_file_path> -p <file_prefix>This generates a tab delimited text file (<file_prefix>_node2tax.txt) with clade ID in the first column and a list of taxonomy strings in the second column.
-
Next we try to find which taxonomic level (if any) is shared by each tip in a clade.
python <path_to_ClaaTU/bin/tax_parser.py> <prefix>_node2tax.txt <outfile_name>This will output a final taxonomy dictionary that contains a mapping of clade (column 1) to tax ID (column 2).
-
Finally, we gather some information about the tree and the nodes in it.
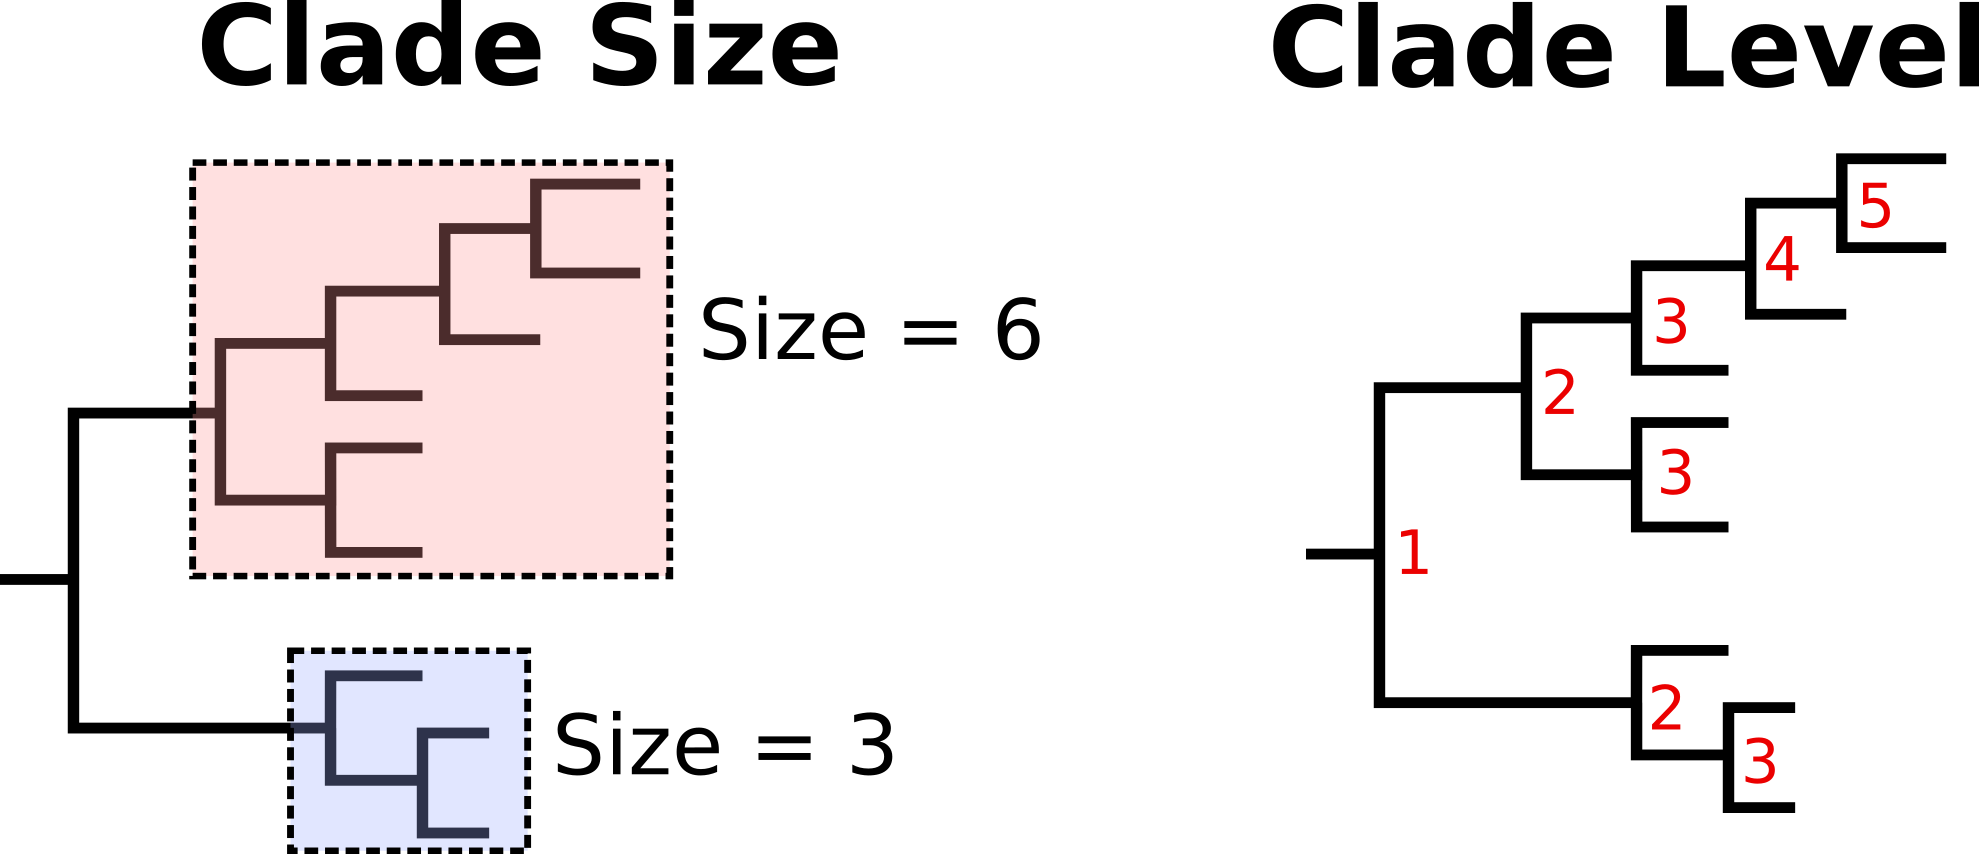
python <path_to_ClaaTU/bin/node_info.py> <prepped_tree> <out_file_path> -p <file_prefix>This should produce three files: <file_prefix>_levels.txt which contains information about how nested a node is, <file_prefix>_dist_median.txt which is a single line file containing the median branch length to the root, and <file_prefix>_dist.txt which gives the branch length to the root from each node.
-
[optional] To determine if a clade is more core than expected by random chance we can conduct a ptest. By default this will evaluate coreness across all samples in a biom table. For this analysis you will need a OTU table in text format, and a prepped tree. You also must specify the number of permutations with the -p flag.
python <path_to_ClaaTU/bin/ptest_tree.py> <otu_table.txt> <prepped_tree> <outfile.txt> -p <#permutations>Alternatively you can create a mapping file that maps sample ids to some group id. This mapping file should be tab delimited (i.e.,sample_ID tab group_id) and should not contain a header.
python <path_to_ClaaTU/bin/ptest_tree.py> <otu_table.txt> <prepped_tree> <outfile.txt> -p <#permutations> -g <mapping_file>After the completion of the random permutations ptest_tree.py calculates a zscore and p-value for each observed coreness value. When no mapping file is given to ptest_tree.py one pvalue is calculated per clade. However, if a mapping file is passed to ptest_tree.py then a p-value is calculated for each clade and each group. For example, if you have 3 groups in the mapping file each clade will have three p-values, one for each group. The output of this will be two files 1) outfile.txt (where outfile is the name you specified), and 2) out_file.txt_stats.txt. Outfile.txt will contain several columns, the first is the clade_ID, the second is the observed coreness, and the third - #permutations is the coreness of the permuted OTU table. Outfile.txt_stats.txt will contain a number of summary statistics in several columns. Column 1 contains the node names, column 2 is the observed coreness, column 3 is the mean coreness of the permutations, column 4 is the standard deviation of the coreness permutations, column 5 is the zscore, column 6 is the p-value of the ztest.
This material is based upon work supported by the National Science Foundation under Grant Number 1557192. Any opinions, findings, and conclusions or recommendations expressed in this material are those of the author(s) and do not necessarily reflect the views of the National Science Foundation.
Like most bioinformatic software CLaaTu is a work in progress. Growing pains are to be expected so please let me know if you discover a bug.


