
We’re building a company to last, brewing beer and building brands that will continue to bring people together for the next 100 years and beyond. With centuries of brewing history, we’ve seen countless new friendships, connections and experiences built on a shared love of beer.
Safety Algorithm is an AI approach developed by Ambev to have a safer environment and avoid incidents on our plants. We hope you copy, use and evolve it. Help us to make the world a better place and reach our dream:
The main goal for the project is predict unsafe conditions that could lead to an accident, called TRI - Total Recordable Injuriues. Thefore, developing a algorithm that outputs to breweries, the probability if an accident is going to happen soon.
As much important as the prediction, the next steps are a big part of the ecosystem. What to do with the information and what action need to be taken is crucial to apply to the field. So, below is a basic diagram regarding the strategy deployed:
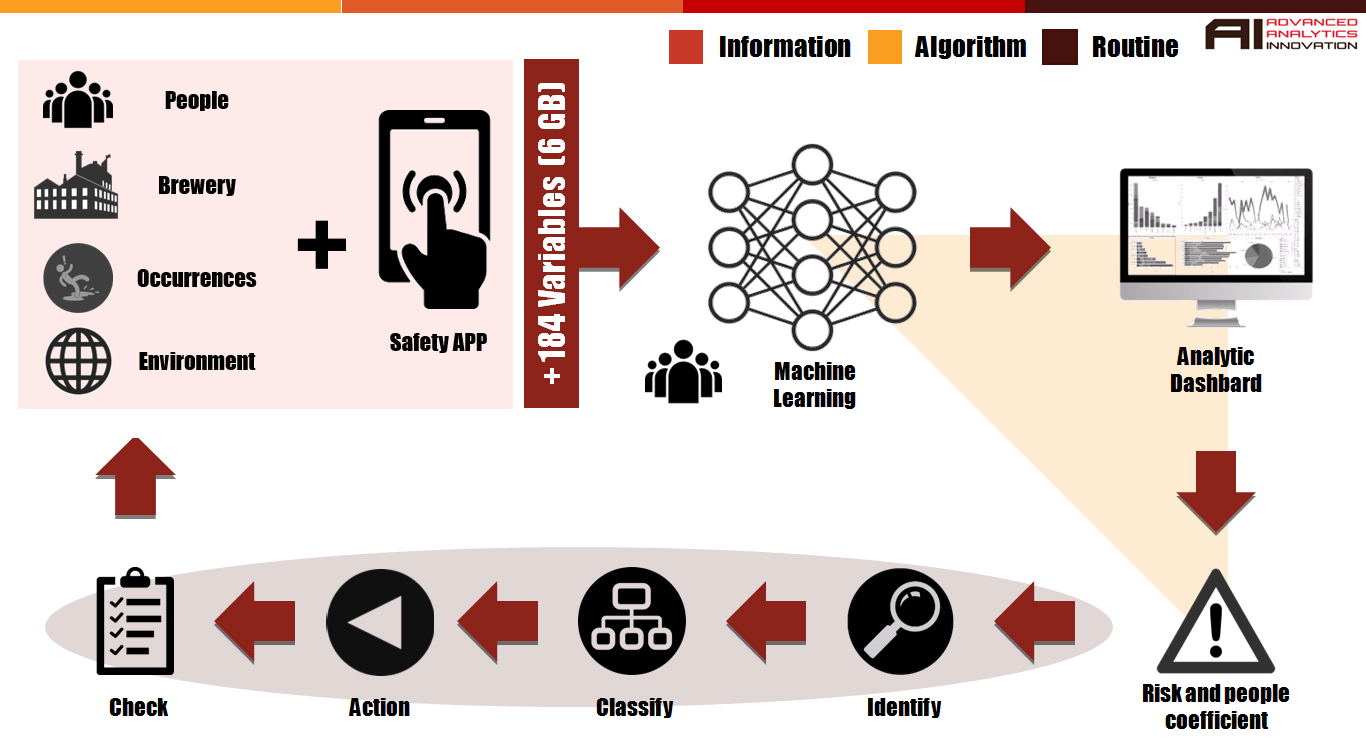
Ideally after steps above all info gathered, by procedure, has to be insert to a system. This system is also an input source for the algorithm, so it has this feedback in order to evaluate if it was a good / bad prodiction.
We are here, trough this opensource code, trying to colaborate with the community. It might not be the perfect solution for all uses, but all necessary tools that you might need in order to do somenthing similiar is implemented in the code, a few examples can be seen below at section "Project Features"
The first version of this project was developed using cloud services, such as Azure plataform from Microsft. We had to first analyse with business all informations that might be most relevant and then, automate all reports from different sources. The algorithm uses those automated reports as inputs, then handled through R, SQL and python languages. As output from the algorithm, there is a csv file feeding a structured capable to update a database on cloud. A dashboard is then connected on this cloud database.
It is important to mention that this project was only able due a long term vision by Ambev, that along years have been working to prepare data to be used.
There are fews mandatory steps in order to deliver a solution based on prediction:
- Get data
- Structured or not.
- Start messing around with it
- Develop Data Visualization. It will help get initial insights.
- Business Intelligence team.
- A team focused only on validation of hypotheses and real generation of value by data.
- Advanced Analytics
- Models and Prediction AIs
This prediction code might be way advanced according your As Is. But keep in mind all the benefits that could be obtained when a long term vision is made. This project shows only one possibility, there are plenty other ideas that can be developed.
🍺 Brayan C. Ksenhuck
🍺 Cassio O. Medeiros
🍺 Fabricio O. Bezerra
🍺 Leonardo G.Rigueto
🍺 Mario E. M. Vieira
🍺 Renata C. G. Castanha
🍺 Thiago Lechuga
❗ The dataset DOES NOT reflect facts. All data was changed with simulated values.
⬛ Operational System Windows, Linux or macOS
⬛ Python 3.6 or later Click here to Download Latest Python
⬛ Jupyter notebook 5.7.8 or later Click here to How to install Jupyter Notebbok
Make sure to succeed on all requirements above mentioned.
Download the files on your computer and double check if .csv file is on the same folder. Remember to change te code below according file's name or even directory:
dataset = pd.read_csv('base.csv', encoding='ISO-8859-1', sep=';')
For more further info, please read this article:
If you are using Jupyter Notebook, click on the first line which can be identified by the In [1]: on the left can shown below highlighted by the red box:

After hit the run button on the toolbar up as can be shown below highlighted by the red box:

-
Exploraty Data Analysis
-
Procedures to Avoid Overfit
-
Data Cleasing / Feature Engineering
In order to reach a better model further on the algorithm, the data cleasing process is a necessary step to prepare a dataset where only data that is relevant for the ANSWER is included. Focusing time on analysing the data is crucial. We used a few steps in order to prepare the data and execute the feature engineering, such as:
-
- Here the idea is to remove all features which variance doesn’t meet some threshold (in this case, zero)
-
- The below removes all features which variance doesn’t meet some threshold (in this case, zero)
-
- Importance of the features according to the algorithm
-
Feature Scaling
-
Models training
-
Evaluate models
-
Log to Email
We developed a solution in order to give visibility about the algorithm. Mainly focused when it is scheduled in a daily basis. That way it is possible to get feedback from the algorithm sent to an e-mail, for example, if all steps was done as expected or even the accuracy and recall.
The code is under Log_Email folder. We used Gmail as domain, but you can use any domain as desired or even use a local SMTP server. In order to do so, Google requests a pre-work, such as allowing SMTP and connections inside security central configuration. The steps can be seen here:
For more information about SMTP and Gmail, please read:
Allowing SMTP connection with GMAIL
Though keep in mind that will be required a few changes at the code at least this two steps if the SMTP server is local or from other domain:
server = smtplib.SMTP('smtp.gmail.com',587)
Change authentication credentials (might be necessary to remove according chosen authentication method)
user = 'youremail@domain.com'
passwd = 'yourpassword'
server.login(user, passwd)
For more information about SMTP on python, please read:
The log is through a dataframe. We have included one example at first step : Reading Database.
Change the row number and include the code below as desired steps that you want to get feedback from. Also remember to change file's name accordingly.
try:
  dataset = pd.read_csv('modelo_unidade_diario_comentado.csv', encoding='ISO-8859-1', sep=';')
  df.iloc[0, df.columns.get_loc('Data')] = datetime.datetime.now().strftime("%d/%m/%y - %H:%M:%S")
  df.iloc[0, df.columns.get_loc('Status')] = 'SUCESSO'
  df.iloc[0, df.columns.get_loc('Comment')] = 'Import dos Dados com SUCESSO'
  validador_log()

except:
  df.iloc[0, df.columns.get_loc('Data')] = datetime.datetime.now().strftime("%d/%m/%y - %H:%M")
  df.iloc[0, df.columns.get_loc('Status')] = 'FALHA'
  df.iloc[0, df.columns.get_loc('Comment')] = 'Import dos Dados com FALHA'
  validador_log()
Add the code along the code as needed.
The actual log send by email is similar as shown below:

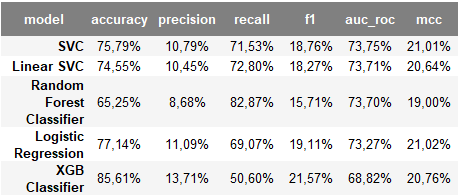
Through the development process we tried several machine learning algorithms, such as random forest, Support vector clustering (SVC), Artificial neural networks (ANN). We have set the train test database to 20% from original database. All further details can be found directly on the code.
Please, fell free to use all options according your dataset.
For further reference and understanding, please read the following:
These are comparative results obtained according tests done based on our train dataset:
-
Accuracy
- The accuracy is intuitively the ability of correctly classifier samples. The best value is 1 and the worst value is 0.
-
Precision
- The precision is intuitively the ability of the classifier not to label as positive a sample that is negative. The best value is 1 and the worst value is 0.
-
Recall
- The recall is intuitively the ability of the classifier to find all the positive samples. The best value is 1 and the worst value is 0.
-
F1
- The F1 score can be interpreted as a weighted average of the precision and recall, where an F1 score reaches its best value at 1 and worst score at 0.
-
AUC
- Compute Area Under the Receiver Operating Characteristic Curve (ROC AUC) from prediction scores. The best value is 1 and the worst value is 0.
-
MCC
- The MCC is in essence a correlation coefficient value between -1 and +1. A coefficient of +1 represents a perfect prediction, 0 an average random prediction and -1 an inverse prediction.
The best fit for our model according all data we used was the the combinacion of classifier SVC and hybrid sampling SMOTEENN. SMOTEENN combine over and under-sampling using SMOTE and Edited Nearest Neighbours.
Therefore we finally applied the algorithm on the test dataset and got the following results:
accuracy 0.76859 (76,86%)
precision: 0.10608 (10,61%)
recall: 0.73761 (73,76%)
f1: 0.18548 (18,55%)
auc: 0.75367 (75,37%)
mcc: 0.21793 (21,79%)
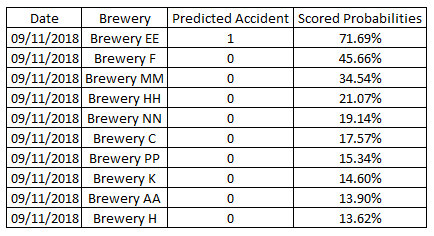
The image below shows the prediction results when the model was applied into the actual data:
Run our experiments online with Binder. Click in the image below:
-
Text Review
-
Detail / Review E-mail FUP configuration and use
-
Create data description
-
Add final result on main algorithm
-
Create FAQ (Not real data, Not production version, ...)
-
ADD integration code to save output data to a SQL Database