Note this repository is very much a proof of concept, it only works on a very basic level. Everything is prone to change, nothing is supported.
Continuous profiling is the act of taking profiles of programs in a systematic way. Conprof is based on a lot of principles and even code of Prometheus, the service discovery mechanism and configuration works very similar to Prometheus and the general functionality is similar, as consecutive profiles of the same type and the same process behave similar to time-series, as in that they are related events of the same origin thus they are in the same series. Only that sample values in Conprof are not float64, but an arbitrary byte array.
Currently only collecting pprof profiles from HTTP endpoints is supported.
Have you ever been in the situation where you know your application has a memory leak or was OOMKilled, but you of course don't have the memory profile from right before that happened? This is why continuous profiling is important, it allows answering these questions even in retrospect.
Conprof is most useful when used together with other systems such as Prometheus, as Prometheus can be used to identify when something happened and Conprof can be used to investigate the particular incident.
Build conprof binary from the root of the repo directory:
go get -u github.com/conprof/conprofRun the example:
conprof all --config.file examples/conprof.yamlOpen http://localhost:8080/ and write a query like {job="conprof"} which after a short amount of time (1 minute should show some data point that can be clicked on). This is conprof profiling itself so the you run it the more data you get.
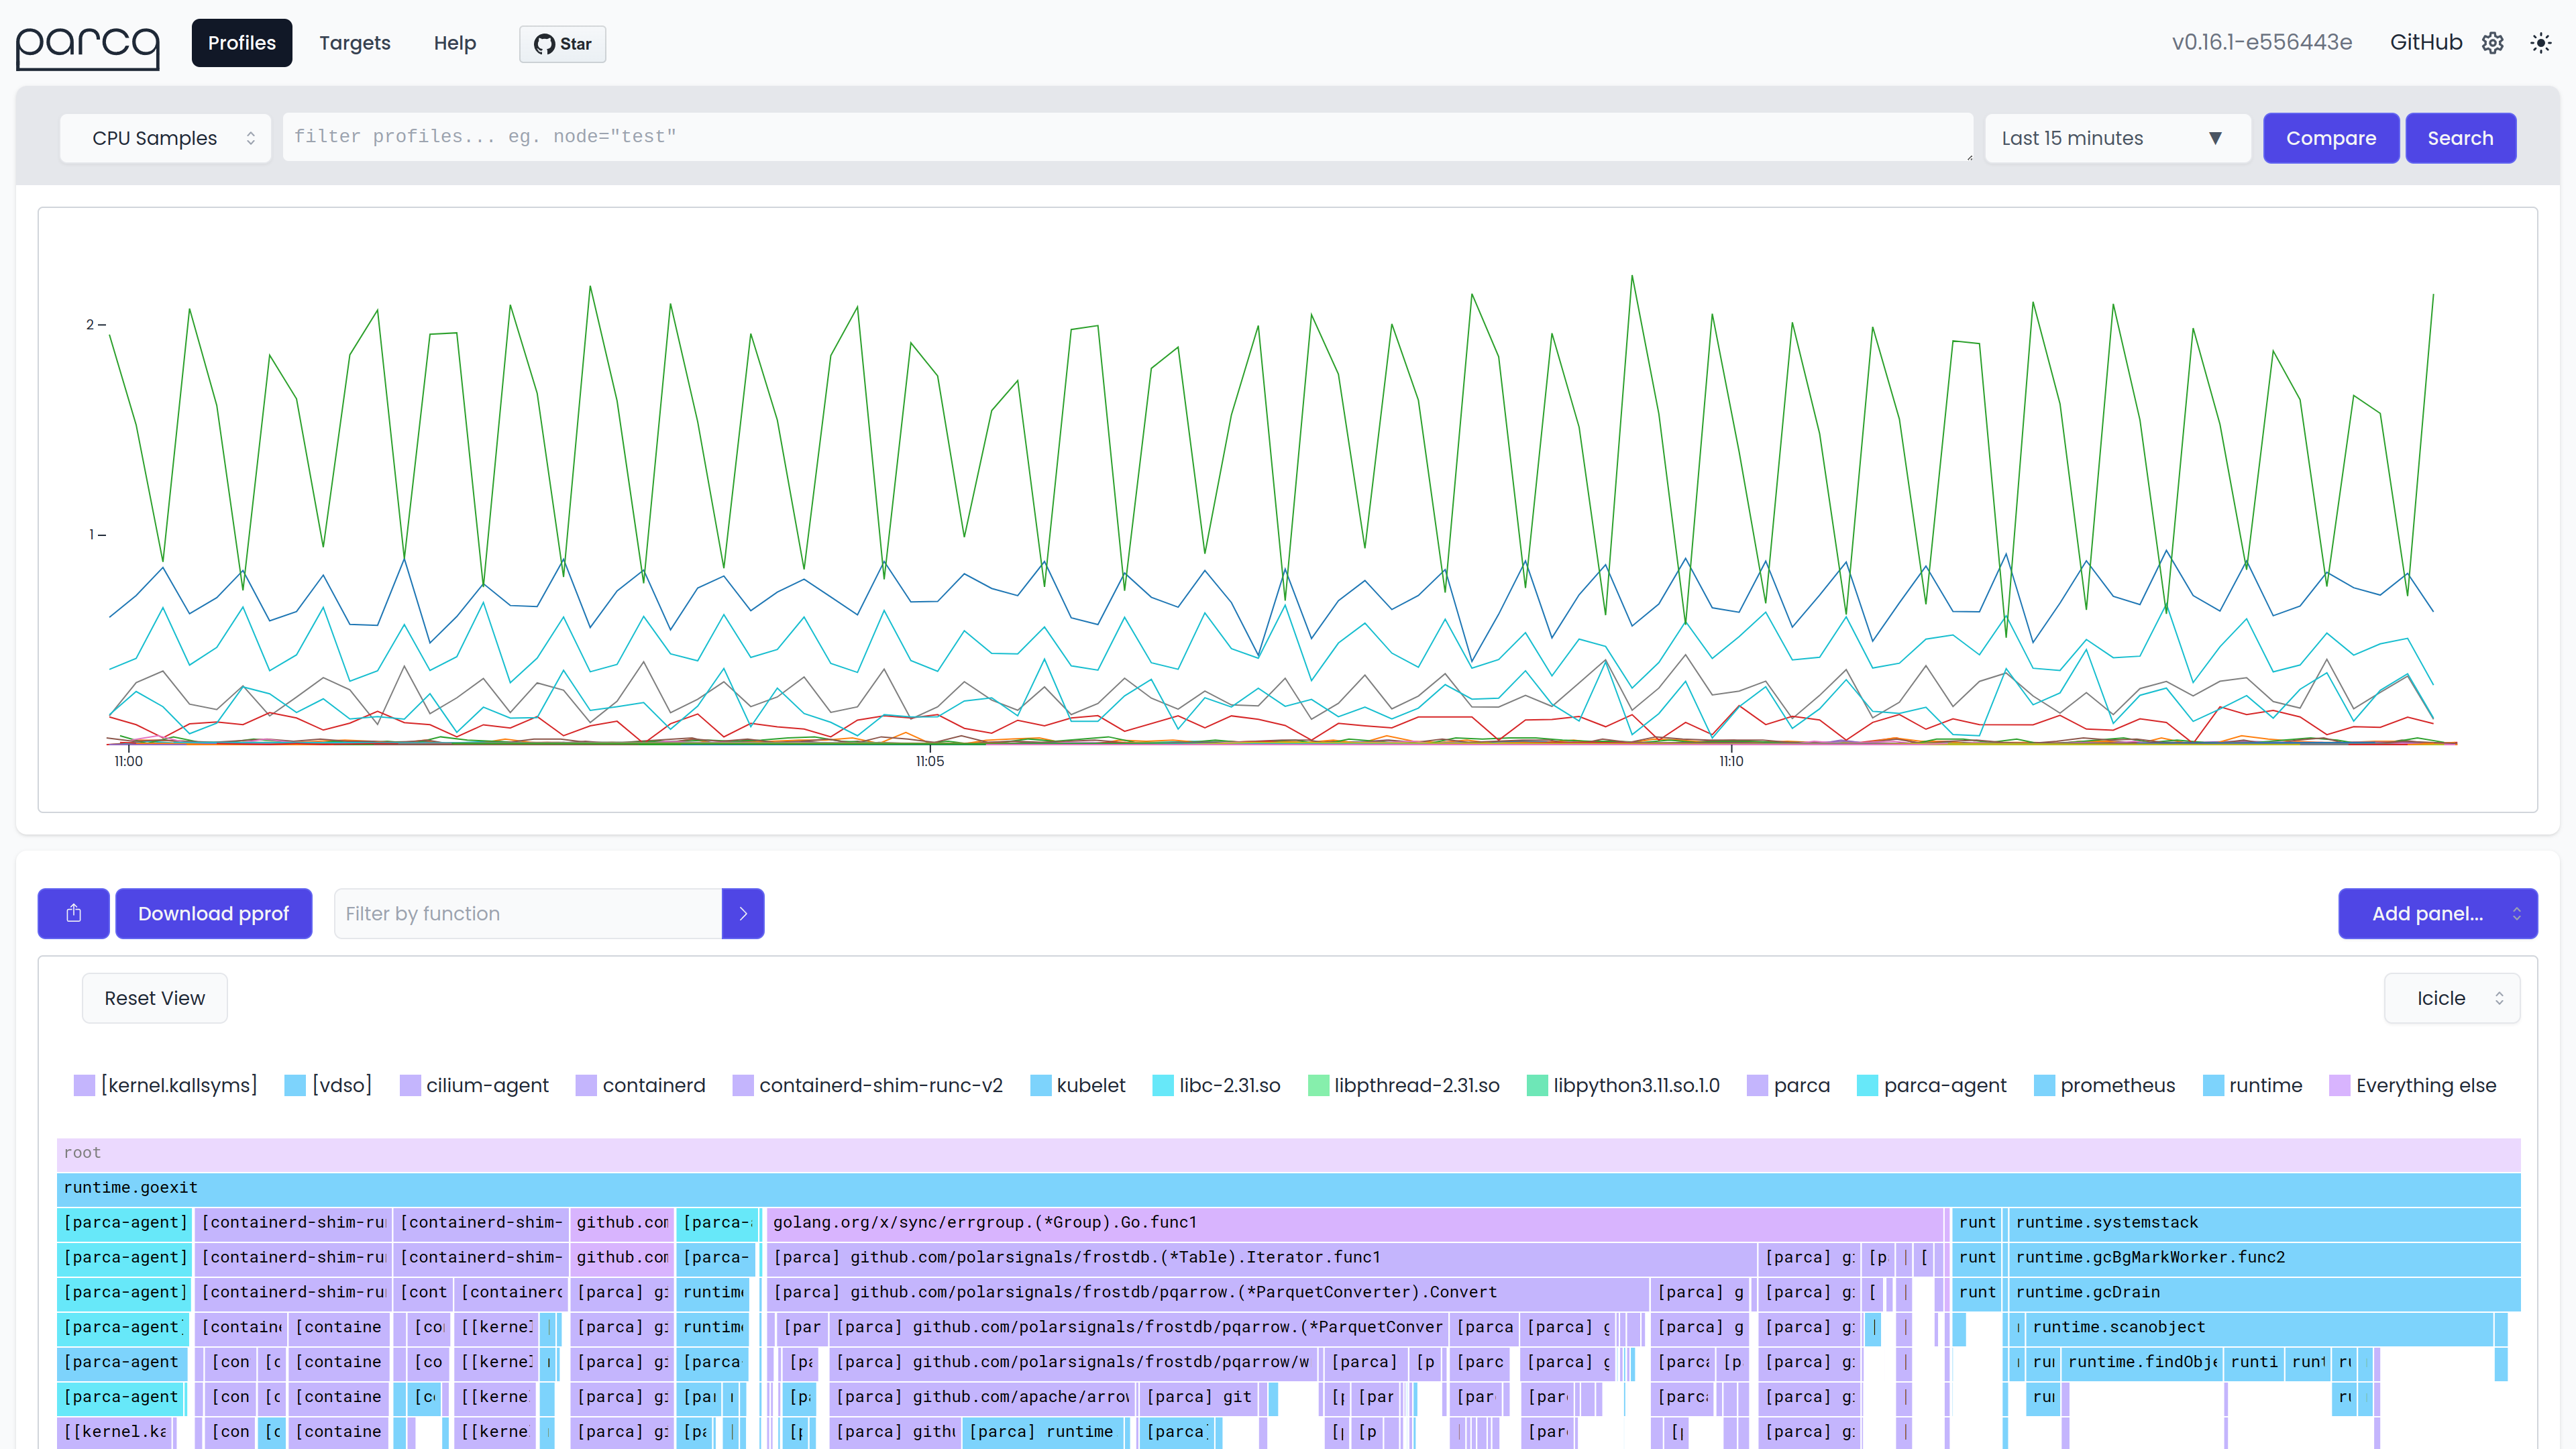
Here's a screenshot of an instance of conprof running for a couple of minutes, and having run the query {job="conprof", profile_path="/debug/pprof/heap"}, plotting samples of heap profiles taken over time.
When clicking on a sample the pprof UI included in the pprof toolchain will be opened, served by conprof. For example:

