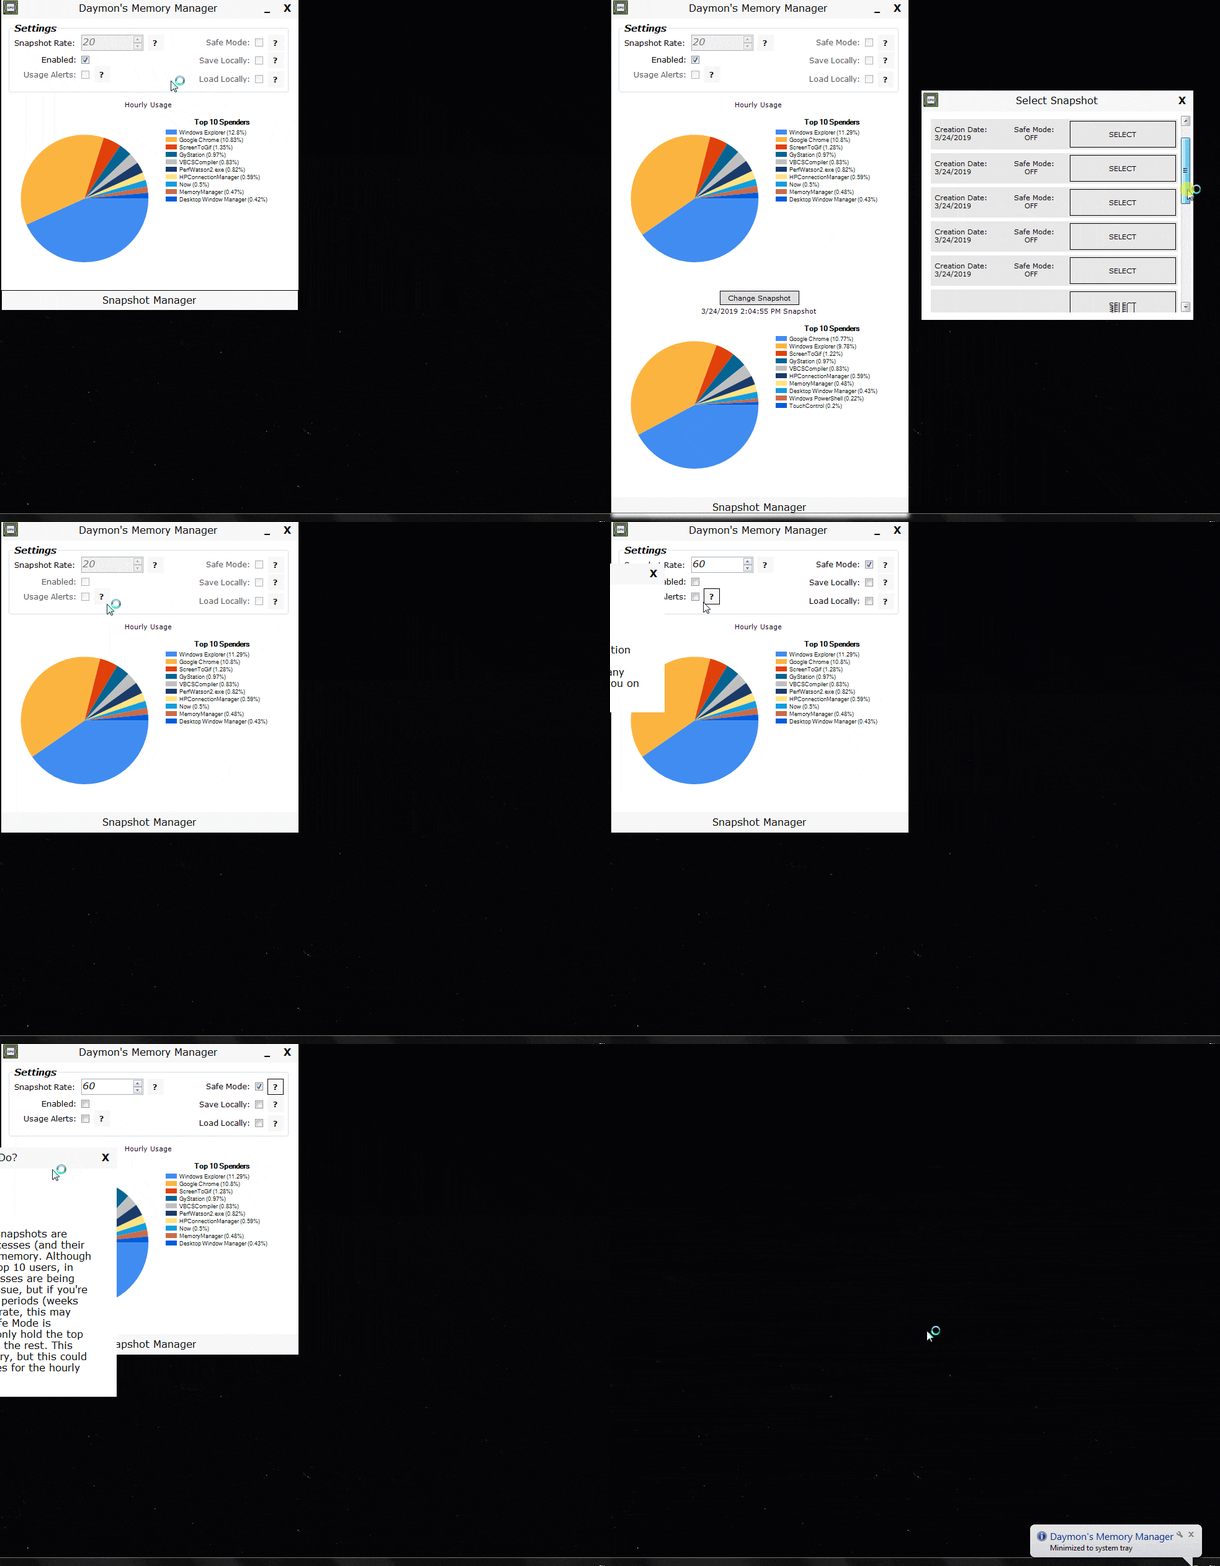
Simple and clean memory manager for monitoring whats going on behind the scenes of your computer! Snapshots are created and displayed to you in a clean and easy to read graph format.
- Clean and modern UI
- Specify snapshot rate
- Safe Mode setting to help conserve memory usage
- Usage alert setting to alert you of any abnormally high usage apps
- Save/Load snapshots to your local HDD
- Help buttons with their own unique form- explaining the usage of each setting
- Hourly Usage chart
- Inspect specific snapshots and their usage
- Winodws only. This utilizes various .NET APIs, which are limited to windows
- Limited cross assembly reading (ie; if you run the application for x86, you can't get snapshots for some x64 applications and vise versa). I plan to implement a workout for this in the future, but its due to a limitation with accessing specific processes under various assemblies
- Hourly graph doesn't handle various memory intensive applications for short durations very well. For this type of monitoring, looking at individual snapshots is more helpful. Hourly graph is more useful for monitoring constant memory usage, OR specifically looking for random memory intensive applications. Just understand that these WILL inflate the graph
- This utilizes .NET APIs that use RPM to access processes, so be careful of using this with games running that have anti-cheats that check for that
- When loading snapshots, the program can differentiate between file extensions and text, but not json. So if you have a txt file in your Export folder, that is of valid json- it'll cause some issues. In general, just keep your Export directory clean
