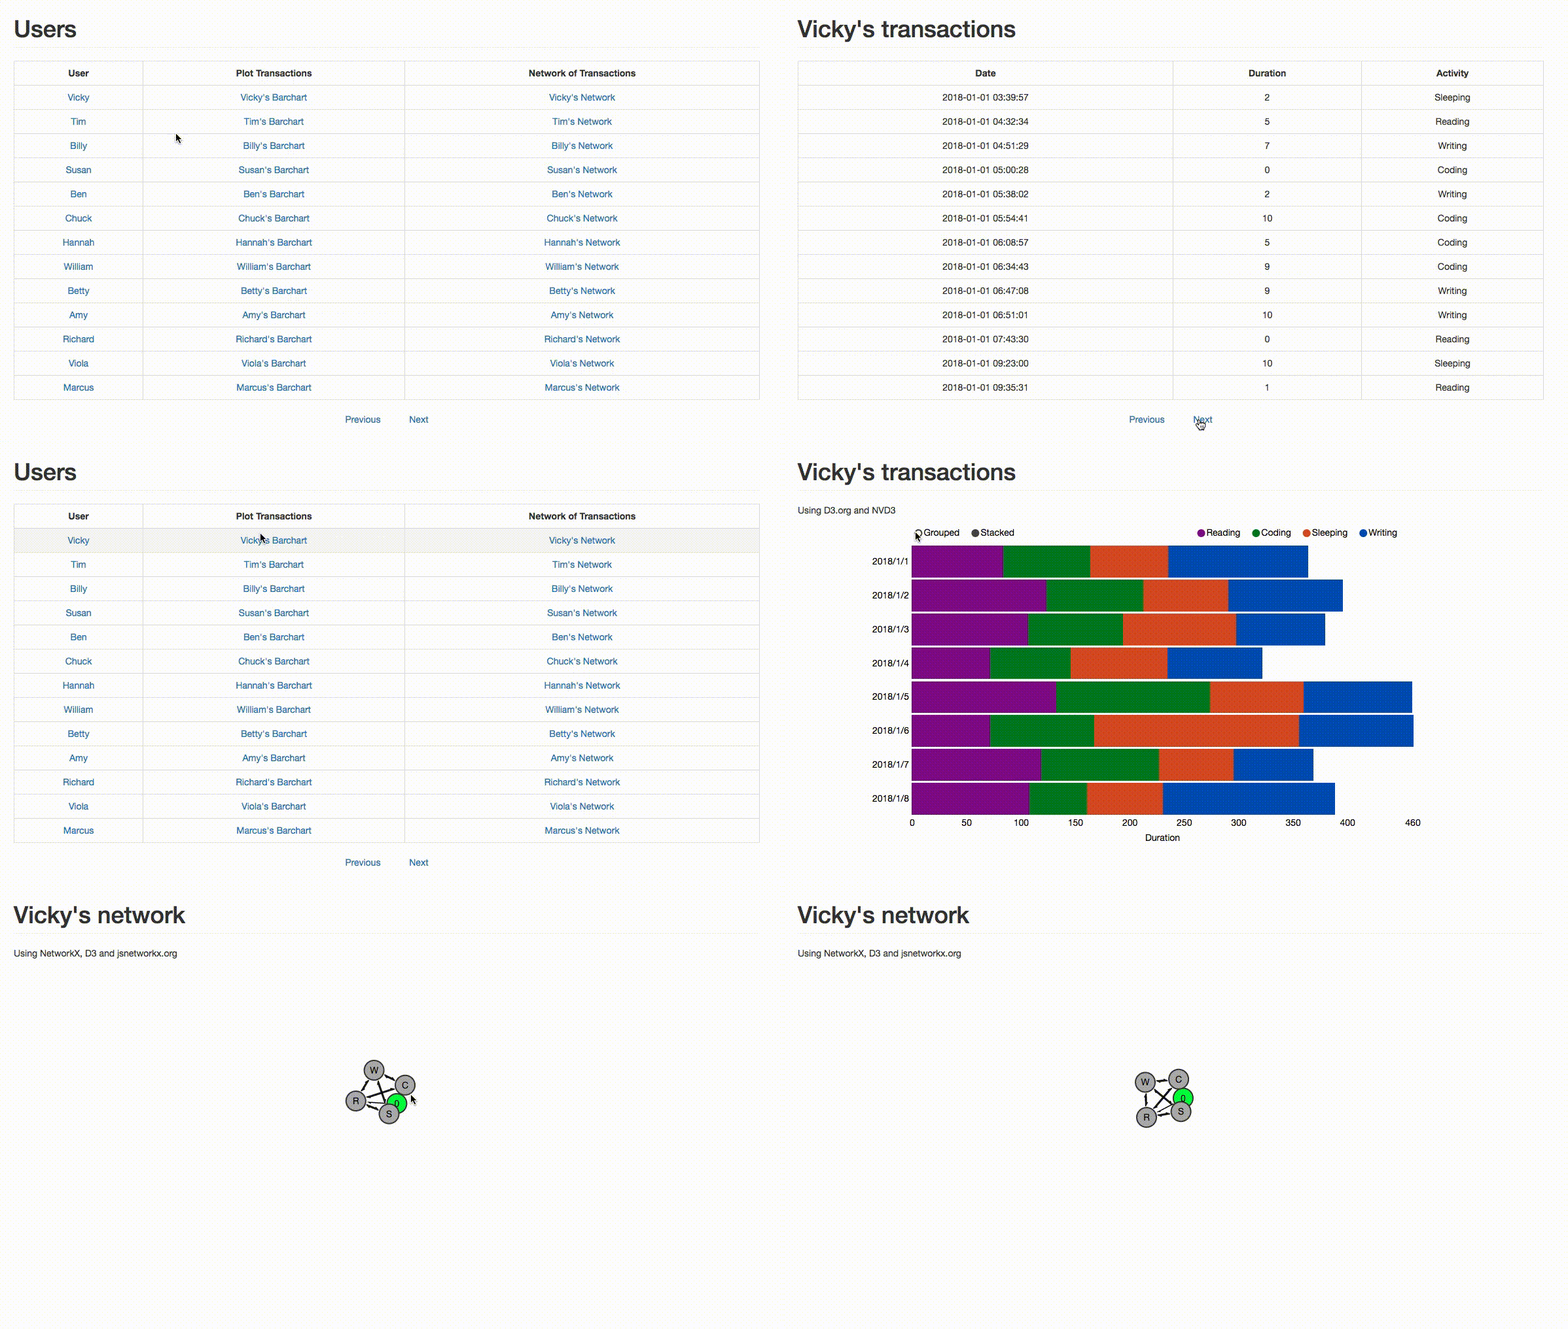
Visualization template that combines several frameworks and allows you to interact with your data on the web using D3 for interactive graphing and NetworkX for networks.
This template has been developed for users to show their Data Science results in an easy and powerful way using technologies like Flask for a web application using Python, MongoDB to store your enourmous amount of data, D3 to plot interactive graphs on the web using NVD3 and NetworkX to plot your networks visualizations using JSNetworkX. It was been also made available as Docker containers with Docker Compose for usability.
You can either use virtual environments or Docker containers:
Creation of a virtual environments done by executing the command venv:
$ python3 -m venv env/
Command to activate virtual environment:
$ source env/bin/activate
Install dependencies:
(env) $ pip install -r requirements.txt
List the libraries installed on your environment:
(env) $ pip freeze
Run the development server:
(env) $ python src/app.py
When you are done, the command to deactivate virtual environment:
(env) $ deactivate
Build image with Docker Compose using the Makefile's command:
$ make build
Run the image to start the mongo and web containers:
$ make run
