This repository contains all the logstash and pmacctd configs, elasticsearch index templates, kibana dashboards and elastalert alerting rules created for the CISE project. It represents an entire configured ELK stack which can be used to record and report on security relevant events for your infrastructure.
Also included are configurations for docker and docker-compose, to allow an entire running stack to be bought up quickly for testing.
It is not intended that you should run an ELK cluster with the settings from this docker-compose environment - in a production setting you should configure a cluster for your own security, availability and performance requirements.
However, the logstash and pmacctd configurations are relevant for all installations.
The sources directory contains subdirectories for the data sources we collect: syslog, dns and sflow. Each source includes logstash configs named index.conf, filter.conf and output.conf and optionally a patterns directory containing logstash grok patterns.
Also included for each source is:
index-template.json, an index template for elasticsearch that contains the type mappings for the source- one or more of
kibana-dashboards.jsonorkibana-dashboards-<type>.jsonwith all the kibana searches, visualisations and dashboards for the source
Some sources also include elastalert rule configs, named <source>-<rule_name>.yaml
The collectors directory contains configurations on how to configure collection agents to send data to the CISE-ELK stack.
The elasticsearch, logstash and pmacct directories contain Dockerfiles and configurations for the docker-compose environment.
Before you can start up the stack, you need to install docker and install docker-compose
Clone this repository, then bring up CISE-ELK by running from the root directory of project:
docker-compose up -d && docker-compose logs -f
This will download and build all the required docker containers, then start them in the correct order. Afterwards you'll have the following services running:
- Elasticsearch
- Logstash
- Kibana
- pmacctd
- RabbitMQ (for pmacctd)
- Redis (for logstash sflow filters)
You need to configure your infrastructure to send data to the CISE-ELK stack
Devices that support syslog should be configured to send data to the IP address or hostname of your stack on port 9991, using either TCP or UDP.
If you already have a centralised syslog server, it may be convenient to configure that server for forward all logs it receives to the CISE-ELK stack.
DNS collection is performed by packetbeat, an elasic product. It is a real time network packet analyser. See Data Collection Configs for more information.
Packetbeat should be configured to send data to the IP address or hostname of your stack on port 9997.
Devices that support sflow should be configured to send sflow data to the IP address or hostname of your stack on port 23501.
Devices that support netflow should be configured to send sflow data to the IP address or hostname of your stack on port 23502.
| Source | Port | Protocol |
|---|---|---|
| Syslog | 9991 | TCP or UDP |
| sflow | 23501 | UDP |
| netflow | 23502 | UDP |
| DNS | 9997 | TCP |
The logstash processing pipeline is configured to augment sflow and netflow traffic records with details from threat intelligence databases, if the IP addresses match. It also add a reputation score to the traffic.
For this to work, you will need to import the threat intelligence databases into elasticsearch regularly using generate-ipdatabase.
This process is not automated as part of the docker compose stack.
Once the CISE-ELK stack has started, the following management tools are available to use (replace localhost with your IP address or hostname)
| Tool | URL | Notes |
|---|---|---|
| Elasticsearch kopf admin | http://localhost:9200/_plugin/kopf/#!/cluster | |
| RabbitMQ web admin | http://localhost:15672/ | user: guest, password: guest |
| Kibana | http://localhost:5601 |
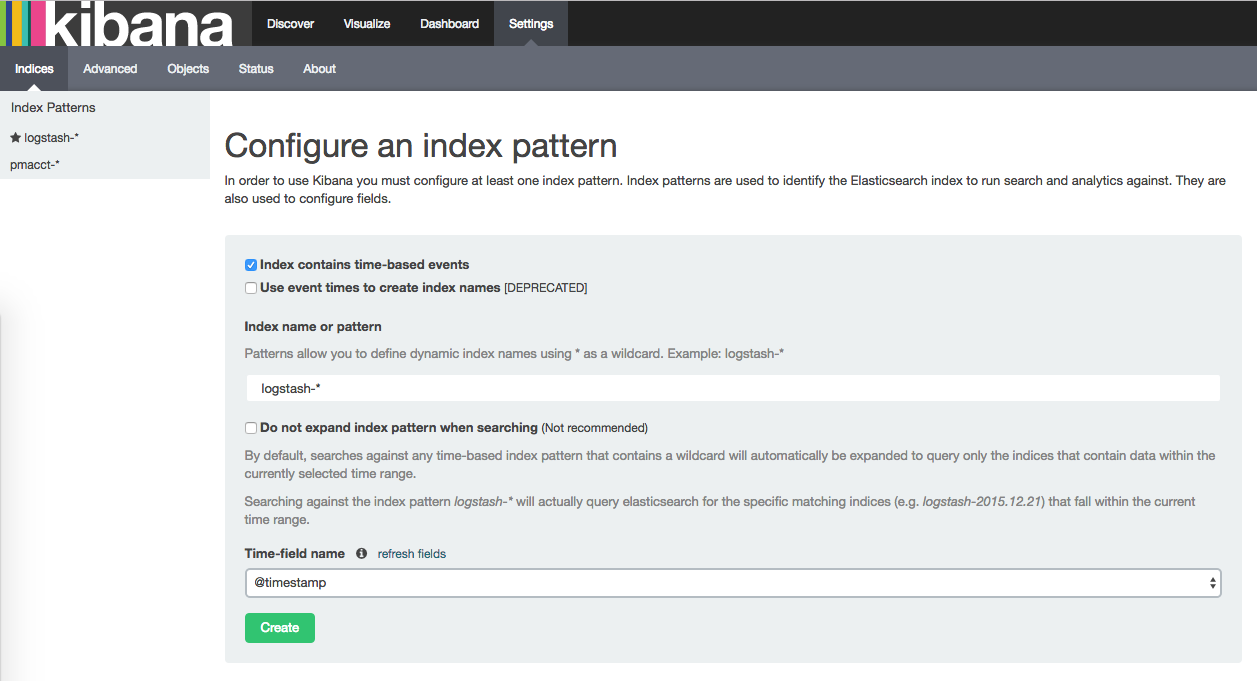
Once you have sent data to logstash for a new source, you'll need to add the index pattern to Kibana to view the data.
The following sources and index patterns can be added:
| Source | Index Pattern |
|---|---|
| Syslog | logstash-* |
| Sflow | pmacct-* |
| DNS | packetbeat-* |
Navigate to Kibana on http://localhost:5601 and select the Settings tab, followed by the Indices sub-tab. (replace localhost with your IP address or hostname)
Type in the name of the index pattern (see list above) and then use the drop down to select @timestamp as the Time-field name. Finally click on the Create button to add the index.
Click on the Discover tab, you should now see the index pattern in the drop down in the top left.
Once data is being sent to the CISE-ELK stack, and the indices have been added to Kibana, the data can be explored using the supplied searches, visualisations and dashboards.
Navigate to Kibana on http://localhost:5601 and select the Settings tab, followed by the Objects sub-tab. (replace localhost with your IP address or hostname)
From the Edit Saved Objects screen, click Import and select from your local filesystem the relevant kibana-dashboards.json for each data source you're using.
Some sources include rules for elastalert alerting. For these to work, you need to define how the alerts will be sent in your environment.
Within each rule, there is a section including the values which need updating
# The following values need to be configured for your environment
es_host: 'elasticsearch'
es_port: 9200
use_kibana4_dashboard: "http://localhost/app/kibana#/dashboard/Syslog-SSH-Authentication-Failures"
email: "administrator@example.com"
smtp_host: "mail.example.com"
from_addr: "elastalert@example.com"
In the test docker environment, only the email, smtp_host and from_addr need updating.
The values for es_host, es_port and the hostname within the use_kibana4_dashboard URL should be changed to match your environment.
## Generating sample data
It may be helpful to generate some data types for testing. Some examples are listed here.
docker-compose exec pmacct /opt/pmacct/sbin/pmacctd -f /opt/pmacct/sflow_agent.conf


