Here is a demonstration of how powerful R can be in carrying out in working with spatial data and geospatial analysis.
The data used in this project is Minneapolis Incidents & Crime data for 2015 (curtesy of Open Data Minneapolis). The data can be downloaded here.
- R - R is an Open-source programming language and software environment for statistical computing and graphics.
- ShinyApp - Shiny is an open source R package that provides an elegant and powerful web framework for building web applications using R.
- Leaflet - Open-source JavaScript library for building mobile-friendly interactive maps.
- GGPlot2 - Data visualization package for the statistical programming language R.
- DPLYR - A powerful R-package for data wrangling and manipultion in R.
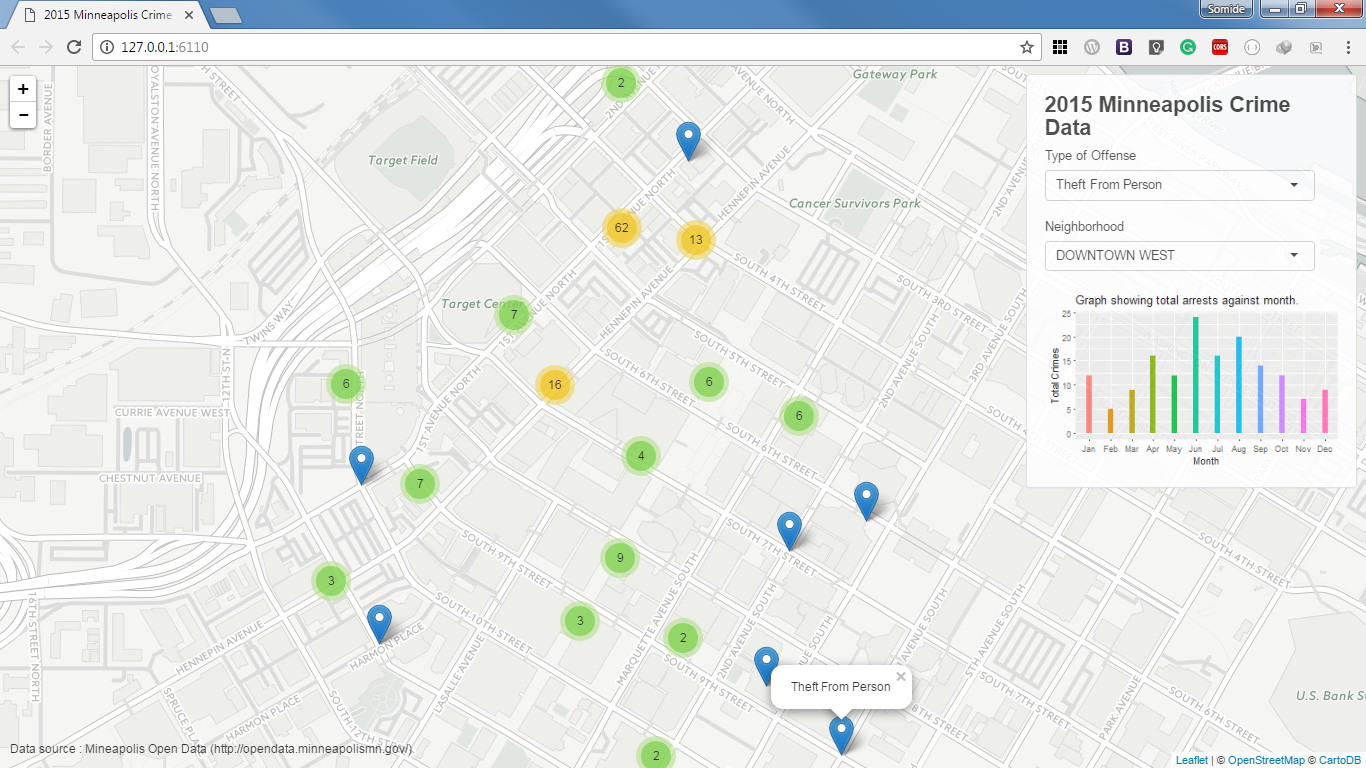
Click here to view demo.
Please feel free to fork this package and contribute by submitting a pull request to enhance the functionalities.
Why not star the github repo? I'd love the attention! Why not share the link for this repository with friends that you think would need this? Spread the word!
Don't forget to follow me on twitter!
Thanks! Olaoye Somide.
The MIT License (MIT). Please see License File for more information.