Specification curve in Stata
Hi,
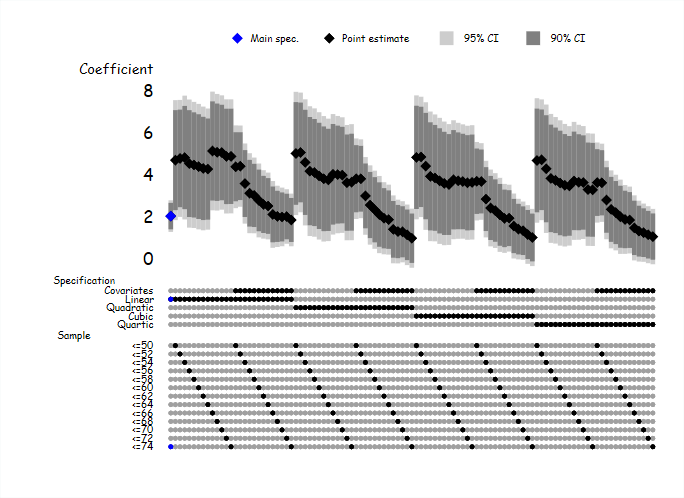
the "file spec_curve_demo.do" shows how you can create a specification curve (like the ones below) in Stata. The example uses the auto dataset in Stata.
- I created a small function to store estimates, but created the chart manually based on the stored estimates.
- Brian Heseung Kim implemented the option to sort by category. To activate that just remove the "sort beta".
You are very welcome to use the code, change it, suggest improvements etc. You do not need to give me credit, but be kind to someone today.
I was inspired to create this chart by Peter Eibich (https://www.demogr.mpg.de/en/institute/staff_directory_1899/peter_eibich_3594.htm) who had a similar chart in a presentation. So any credit should go to him
There is a lot of material on this out there that is much more sophisticated. See for example the work of Uri Simonsohn (number 37): http://urisohn.com/
Best, Hans

