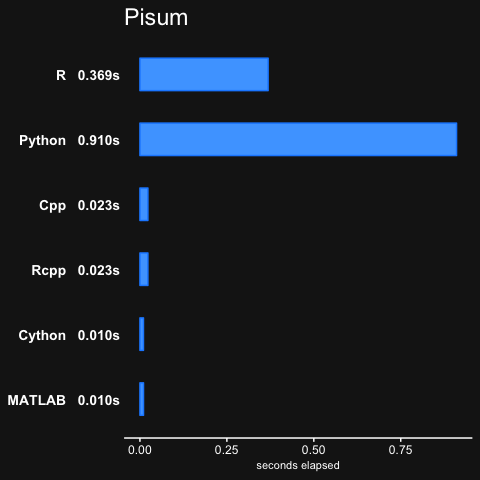
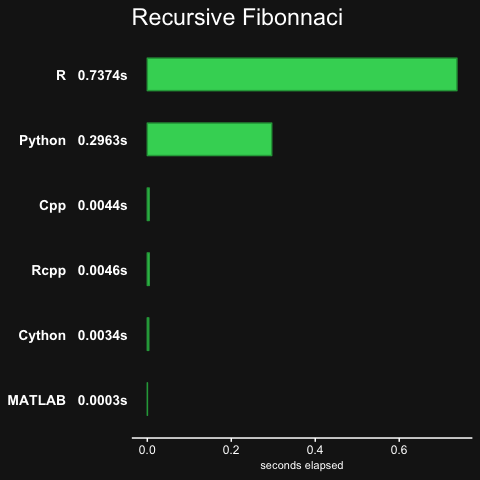
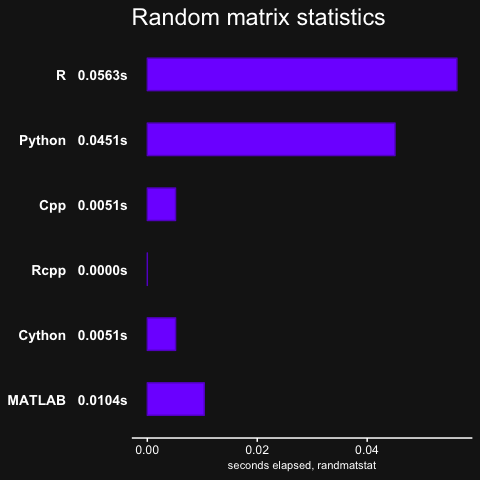
This repo uses Julia's microbenchmarks to see how using Rcpp and Cython compare to using R, Python and C++.
The original benchamrks already compared R, Python, MATLAB and C++, but did not include benchmarks for Rcpp and Cython. The C++ Armadillo library is used for the linear algebra functions in C++.
The three benchamrks from Julia's microbenchmarks that are used are:
pisum, which is essentially a function with two nested for-loops.fib, computes the Fibonacci numbers in a recursive manner (not efficient)randmatstats, some matrix algebra with statistics functions.
Note that there are two versions: one with Armadillo with_arma and one without no_arma.
The no_arma version only has the pisum and fib benchmarks.
Note that there was no Rcpp result for randmatstat, because of issues installing RcppAramdillo along with the regular Armadillo library on OSX, so the Rcpp result was recorded as 0.
To run the benchmarks:
cd no_arma
cd maketable
./run_all
The same can be done in the with_arma folder, but again note that the C++
Armadillo library is used for the linear algebra functions in C++.
Also not ethat the Rcpp version does not do the mat
This will create the necessary tables.
To make the plots in R, you will need the ggplot2 and ggpubr packages:
source("makeplots.R")
makeplots(T)
makeplots(T)    # might need to run function a second time
There seems to be an issue with the plots not appearing if not run a second time (grid issue?).
- C++ compiler
- R, with the
Rcppandmicrobenchmarkpackage installed (andggplot2andggpubrif the plots are wanted). - Python 3, with Cython
- MATLAB
Any of these can be removed from being benchamrked by modifying the run_all.sh script in the maketable subfolder.


