- numpy (
pip install numpy) - scipy (
pip install scipy) - matplotlib (
pip install matplotlib) - mne (optional) (
pip install mne): Only for read EDF file
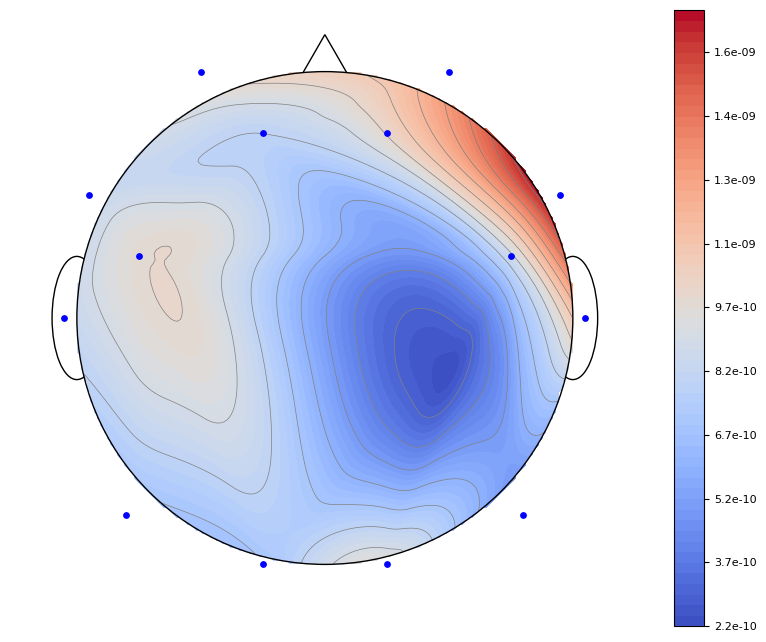
Input: data- 1D array 14 power values ax- Matplotlib subplot object to be plotted every thing fig- Matplot lib figure object to draw colormap
Output: matplotlib axis
Code:
import mne
import matplotlib.pyplot as plt
from topograph import get_psds, plot_topomap


data = mne.io.read_raw_edf('1.edf')
raw_data = data.get_data()
ch_data = raw_data[2:16,:]
pwrs, _ = get_psds(ch_data)

fig, ax = plt.subplots(figsize=(10,8))
plot_topomap(pwrs, ax, fig)
plt.show()
fig.savefig("topograph.png", bbox_inches='tight')To download sample EDF dataset please refer Person identification from EEG using various machine learning techniques with inter-hemispheric amplitude ratio
