How do we measure a player success or make an assumpption that one player is better than the rest? Or better question is how do we measure the overall success a player brings to their team? This will determine which player will eventually win the most valuable player award at the end of the season or make it to the All-Star team
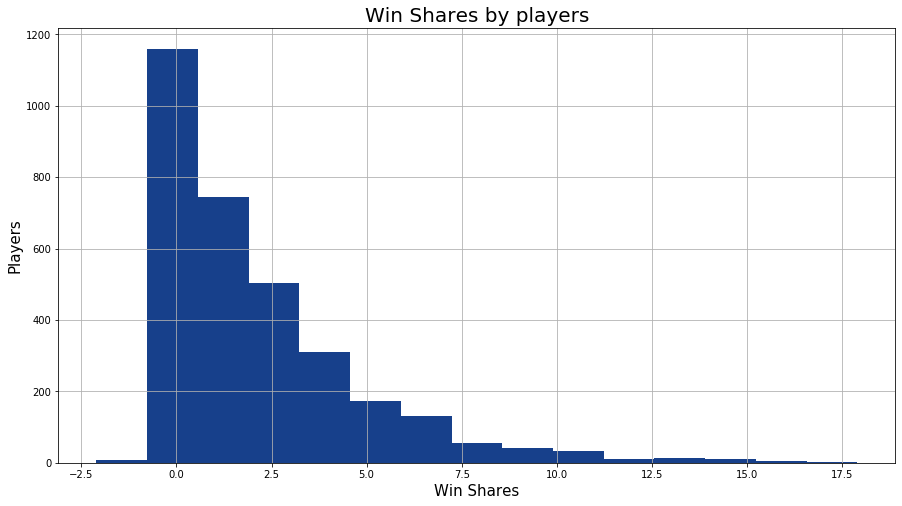
According to Basketball-Reference, win shares is a metric that estimates the number of wins a player produces for his team throughout the season. We believe win shares is a very good indicator but how do we predict win shares and what is it based on - Personal Success? Or Basic stats like number of points you score, assist or rebound? Or Advances Stats like how well you contribute to the team? Or rather a combination of Basic and Advanced metrics?
What criteria matters most in making your MVP decision? Answers by some of NBA sports writers/analyst?
- Steve Aschburner: The MVP is the best player on the team with the best record.
- Fran Blinebury: Consistent individual excellence combined with team leadership and more than a few moments of transcendent brilliance.
- John Schuhmann: My vote went to the individual who had the biggest effect on why a good team was good.
- Sekou Smith: I've said all along that there's a complicated matrix of factors that go into making this vote.
- Ian Thomsen: I love this award because it’s all about value: who has done the most for his team?
- Lang Whitaker: I'm doing my best to keep it simple: Value.
Source: https://www.nba.com/article/2017/04/12/blogtable-what-criteria-matters-most-making-mvp-decision
Web Scrape data for Win Shares
- Scrape data for 2015-2019 seasons and 2019-2020 season: www.basketball-reference.com
- Scrape historical data first using "Scraping Historical NBA Data.ipynb" jupyter notebook
- Latest data for 2020 season is scraped in the other jupyter notebook with the machine learning predictions
Data for NBA Fantasy
- Download data from Rotoguru website: www.rotoguru.net
Scikit Learn
Pandas
Matplotlib
Seaborn - Install in Python environment using "pip install seaborn"
Plotly - Install in Python environment using "pip install plotly==4.5.0"
Pulp
- Web Scrape from Basketball Reference (www.basketball-reference.com)
-
2015-2019 Seasons
- Basic Stats
- Advanced Stats
- Merge them into one and save as CSV
-
2019-2020 Season
- Basic Stats
- Advanced Stats
- Merge them into one
- Ran up to date data for current season
-
Beautiful Soup was used to scrape the data. The links for basic stats and advanced stats are different. The code below shows how the links are being called to scrape for each year:
adv_url = "https://www.basketball-reference.com/leagues/NBA_{}_advanced.html".format(year) adv_html = urlopen(adv_url) soup_av = BeautifulSoup(adv_html) pg_url = "https://www.basketball-reference.com/leagues/NBA_{}_per_game.html".format(year) pg_html = urlopen(pg_url) soup_pg = BeautifulSoup(pg_html) -
- After data collection, run the machine learning models in the "NBA MVP-All-Star - Final-Copy.ipynb" jupyter notebook.

- Find the most important feature(s) to be used for the model
- Random Forest Regression
VORP: 0.8285404212518993 G_x: 0.06380038885382514 PER: 0.0186782592608807 BPM: 0.01807723677658762 TS%: 0.016132740946558193 TRB: 0.008268285038248831 PTS: 0.006065029406858381 STL%: 0.0059862467509281675 MP_x: 0.004177103796505039 FT%: 0.003677702839141312 FG%: 0.003576500074199313 AST: 0.0032318963860369417 USG%: 0.0027751805810590584 eFG%: 0.002460066294153274 ORB%: 0.0020797810811591755 DRB%: 0.0020229700506229076 TRB%: 0.002005456459413652 3P%: 0.0019891514999140296 BLK%: 0.0019057894086372037 Age_x: 0.0018462354155869777 BLK: 0.0013590939101316367 STL: 0.001344463917653198- Correlation Matrix (Pearson R-Square Correlation)
- Create a Heatmap
- Perform supervised multi-linear regression ML analysis to predict win shares of all the current players (2019-2020):
- Training and Validation using scikit learn module
- Train –
- Year 2015-2019
- Multi-Linear Regression
- Validate/Test –
- Year 2019-2020 (Current Season)
- Check our predicted win shares values against the actual
- The player with most win shares will eventually win MVP at the end of the season
- Train –
- Prediction All-Star Players
- Players with top 10 Win shares will be All-star starters
- Compare the predicted all-star starters with actual All-Star starters (All-star game - 2/16/2020)
Fantasy Basketball is a fun game to play during the basketball season.Every fantasy basketball league is different. We focused on Fan Duel, and getting predictions for its Stats. Our aim was to create the fantasy team with best possible player for each position. Using Stats like FDP,Blocks,Steals,Points,Rebound,Trunover,Assists etc., We tried predicting best player based on each positions.

* 2019-2020 Seasons
-
Training and Testing using scikit learn module
- ElasticNet module
-
Predictions
- Fan Duel Point (FDP)
- Blocks
- Steals
- Points
- Rebounds
- Turnovers
- Assists
- Using more historical data to train into the multi-linear regression model was a challenge.
- The actual All-Star players may be selected based on some emotional bias than the statistics.
- Define features and model for the Fantasy Duel analysis was really challenging
- The short time to do Exploratory analysis and adjust the model
- Creating and launching a webapp to visualize predictions would be helpful for end users to use the insights
- Make predictions for All-NBA Team (PG, SG, SF, PF, C)
- Improve the collection (web Scrapping) of daily games/players
- Improve the current prediction model and test other models
- Create a Web interface and allow selection of players for the webapp
- Include a list of active Injured players to the model
- Sai
- Dan
- Deepen
- Pratikchhya
- Pavana Srinivasa