There was this monumental talk in late 2019 about the correctness of the punctuality statistics published by Deutsche Bahn, which got me interested in api.deutschebahn.com.
This repo contains non of the train schedule data. Instead it has change-logs of the parking api, station data api and the station facilities status api (status of elevators and escalators), collected since late January 2020.
Everything is browsable in the static data page.
Each table shows the top-ten most-changed objects.
288 objects, 73,942 snapshots, 116,433 changes (2020-01-25 23:27:15 - 2022-09-01 09:00:01)
| id | name | num changes |
|---|---|---|
| 100054 | Düren P1 Parkplatz Ludwig-Erhardt-Platz | 7820 |
| 100083 | Frankfurt (Main) Hbf P3 Vorfahrt II | 4621 |
| 100201 | Mainz Hbf P3 Tiefgarage Bonifazius-Türme UG -1 | 4314 |
| 100084 | Frankfurt (Main) Hbf Bustasche | 4311 |
| 100280 | Bad Cannstatt P3 Parkhaus Wilhelmsplatz Ebenen -3 und -2 | 3399 |
| 100279 | Bad Cannstatt P2 Parkhaus Wilhelmsplatz Ebenen -1 bis 6 | 2801 |
| 100023 | Berlin Ostbahnhof P1 Parkplatz | 2366 |
| 100291 | Ulm Hbf P2 Parkplatz | 2131 |
| 100090 | Freiburg (Breisgau) Hbf P1 Tiefgarage am Bahnhof | 1776 |
| 100066 | Duisburg Hbf P2 Parkhaus UCI | 1759 |
3,894 objects, 17,278 snapshots, 500,332 changes (2020-01-25 23:16:01 - 2022-09-01 09:01:01)
| id | name | num changes |
|---|---|---|
| 10556568 | Tuttlingen ELEVATOR zum Gleis 4/5 | 1755 |
| 10556567 | Tuttlingen ELEVATOR zum Gleis 2/3 | 1727 |
| 10556569 | Tuttlingen ELEVATOR zu Gleis 1 | 1727 |
| 10248843 | Regensburg Hbf ESCALATOR von Empfangshalle zu Brücke | 1492 |
| 10248859 | Regensburg Hbf ESCALATOR von Empfangshalle zu Brücke | 1430 |
| 10460422 | Diepholz ELEVATOR zu Gleis 2/3 | 1419 |
| 10354470 | Osnabrück Hbf ELEVATOR zu Gleis 1 | 1414 |
| 10417241 | Osnabrück Hbf ELEVATOR zu Gleis 4/5 | 1408 |
| 10417240 | Osnabrück Hbf ELEVATOR zu Gleis 2/3 | 1401 |
| 10466017 | Laupheim West ELEVATOR zu Gleis 2/3 | 1401 |
5,406 objects, 910 snapshots, 67,255 changes (2020-01-27 12:43:06 - 2022-09-01 06:05:01)
| id | name | num changes |
|---|---|---|
| 1947 | Friedrichshafen Stadt | 24 |
| 6714 | Westerland (Sylt) | 23 |
| 2514 | Hamburg Hbf | 22 |
| 3631 | Leipzig Hbf | 22 |
| 1821 | Berlin-Schönefeld Flughafen | 21 |
| 1859 | Frankfurt (Oder) | 21 |
| 1906 | Freilassing | 21 |
| 4234 | München Hbf | 21 |
| 6418 | Villingen (Schwarzw) | 21 |
| 8192 | Flughafen BER - Terminal 1-2 | 21 |
The APIs are sampled with separate cronjobs running these shell commands:
# parking each 15 minutes
curl -X GET --header "Accept: application/json" \
    --header "Authorization: Bearer <YOUR_API_TOKEN>" \
    "https://api.deutschebahn.com/bahnpark/v1/spaces/occupancies" \
    > `date -Is -u`.json

# stations once a day
curl -X GET --header "Accept: application/json" \
    --header "Authorization: Bearer <YOUR_API_TOKEN>" \
    "https://api.deutschebahn.com/stada/v2/stations?searchstring=*" \
    > `date -Is -u`.json

# elevators each hour
curl -X GET --header "Accept: application/json" \
    --header "Authorization: Bearer <YOUR_API_TOKEN>" \
    "https://api.deutschebahn.com/fasta/v2/facilities?type=ESCALATOR,ELEVATOR"
    > `date -Is -u`.json
This simple setup does no error handling. If the endpoint is temporarily busy the snapshot is lost.
Each API response is a list of objects which look like:
{
  "allocation": {
    "validData": true,
    "capacity": 133,
    "category": 4,
    "text": "> 50"
  },
  "space": {
    "id": 100291,
    "label": "P2",
    "name": "Parkplatz Ulm Hauptbahnhof",
    "nameDisplay": "Ulm Hbf P2 Parkplatz",
    "station": {
      "id": 6323,
      "name": "Ulm Hbf"
    },
    "title": "Ulm Hbf P2 Ulm Hbf P2 Parkplatz"
  }
}
Note that the original objects did contain a
timestampandtimeSegmentfield. There are discarded in the changelogs to minimize the amount of data.
{
  "aufgabentraeger": {
    "name": "Nahverkehrsservicegesellschaft Thüringen mbH",
    "shortName": "NVS"
  },
  "category": 6,
  "evaNumbers": [
    {
      "geographicCoordinates": {
        "coordinates": [11.593783, 50.93692],
        "type": "Point"
      },
      "isMain": true,
      "number": 8011058
    }
  ],
  "federalState": "Thüringen",
  "hasBicycleParking": true,
  "hasCarRental": false,
  "hasDBLounge": false,
  "hasLocalPublicTransport": true,
  "hasLockerSystem": false,
  "hasLostAndFound": false,
  "hasMobilityService": "no",
  "hasParking": false,
  "hasPublicFacilities": false,
  "hasRailwayMission": false,
  "hasSteplessAccess": "partial",
  "hasTaxiRank": false,
  "hasTravelCenter": false,
  "hasTravelNecessities": false,
  "hasWiFi": false,
  "mailingAddress": {
    "city": "Jena",
    "street": "Spitzweidenweg 28",
    "zipcode": "07743"
  },
  "name": "Jena Saalbf",
  "number": 3044,
  "priceCategory": 6,
  "regionalbereich": {
    "name": "RB Südost",
    "number": 2,
    "shortName": "RB SO"
  },
  "ril100Identifiers": [
    {
      "geographicCoordinates": {
        "coordinates": [11.593348001, 50.936519303],
        "type": "Point"
      },
      "hasSteamPermission": true,
      "isMain": true,
      "rilIdentifier": "UJS"
    }
  ],
  "stationManagement": {
    "name": "Chemnitz",
    "number": 115
  },
  "szentrale": {
    "name": "Erfurt Hbf",
    "number": 50,
    "publicPhoneNumber": "0361/3001055"
  },
  "timeTableOffice": {
    "email": "DBS.Fahrplan.Thueringen@deutschebahn.com",
    "name": "Bahnhofsmanagement Chemnitz"
  }
}{
"description": "zu Gleis 1",
"equipmentnumber": 10354738,
"geocoordX": 11.5873405,
"geocoordY": 50.924981,
"state": "ACTIVE",
"stateExplanation": "available",
"stationnumber": 3043,
"type": "ELEVATOR"
}The change-logs are collected in json files per year in docs/data/ using a self-baked format which does not contain too much space and allows committing new json lines with minimal diffs.
All object keys are sorted alphabetically to avoid needless commit diffs.
To get access to all objects via python:
from src.changelog_reader import ChangelogReader

for changelog_file, dates_file in ChangelogReader.get_changelog_files("stations"):
    reader = ChangelogReader(changelog_file, dates_file)
    for object_id in reader.object_ids():
        for timestamp, data in reader.iter_object(object_id):
            print(f"object {object_id} at time {timestamp} is {data}")
If an object was not listed during a snapshot, data will be None.
The reader.iter_object(object_id) method iterates through all changes of the
object. The reader.iter_object_snapshots(object_id) method iterates through
each snapshot regardless if the object is changed or does not yet exist.
Below are some plots and crude analysis of the data. The jupyter notebooks used for it are in the notebooks/ directory.
Counting the number of elevators and escalators that do not have state
ACTIVE produces this interesting curve:
The different colors represent the amount of time that these machines where inactive, 100% meaning it was inactive the whole day.
The small repeating pikes align with the working days each week. This is probably caused by a mixture of two things: Elevators might tend to break more often when used, and there are certainly more reports/complaints about defect machines on workdays, compared to the weekends.
There seems to be a bad trend visible. The number of defect machines is growing. How many machines are there anyways? Plotting the number of listed IDs per day..
..reveals that there are 200 new devices since beginning of 2020. That is a bigger increase than the increase of the number of defect devices over the same period. Something else is going on...
Each elevator/escalator device has a stationnumber attached. From the station data
we can get a couple of meta information. After trying a few of them, the
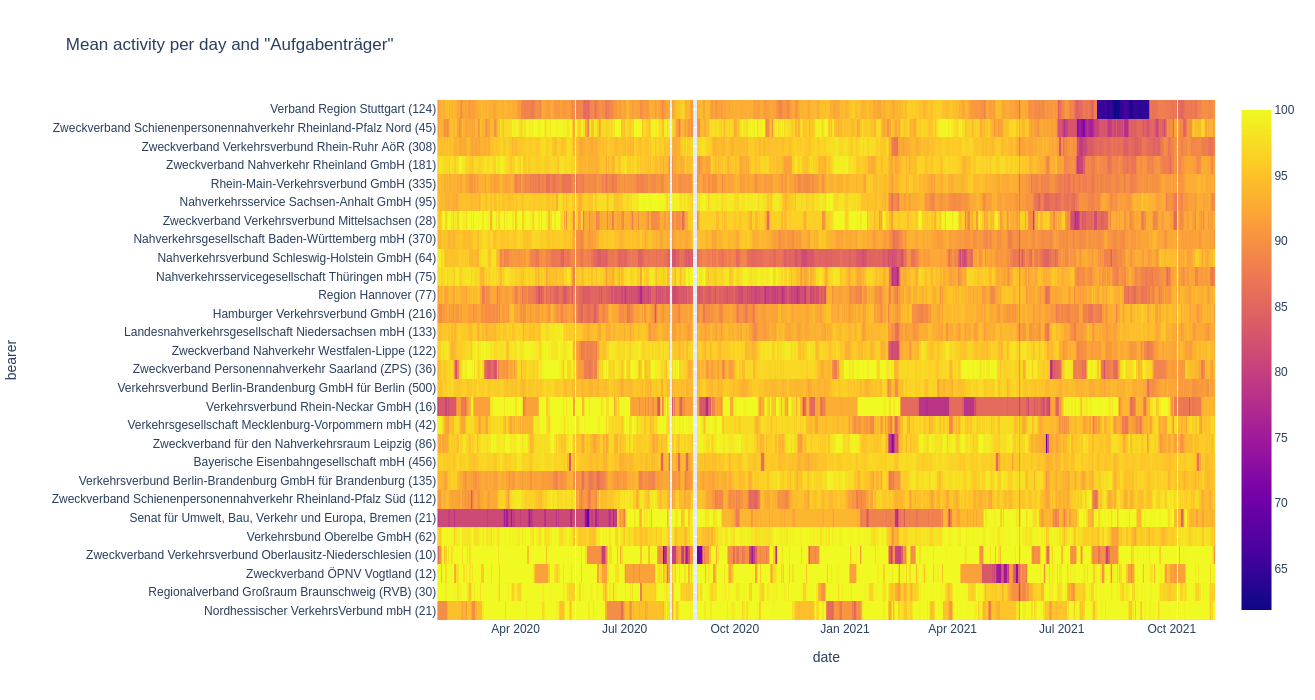
aufgabentraeger entry seems to relate somewhat with the inactivity during
the second half of 2021:
In the above plot, the y axis has been sorted by mean activity during late 2021. Verband Region Stuttgart is the main cause of trouble, followed by a couple of Rhineland-ian associations. The number behind the labels shows the overall number of devices of each Aufgabenträger. If Verband Region Stuttgart drops from about 90% to 64% mean activity per day through the period of Aug. 2021 to mid September that's quite something.
I completely don't know Stuttgart by detail so can only guess about. There's this construction site. at the main station which perfectly matches the date. Only that Stuttgart Hauptbahnhof belongs to Nahverkehrsgesellschaft Baden-Württemberg mbH and they don't show that dropout of activity.`
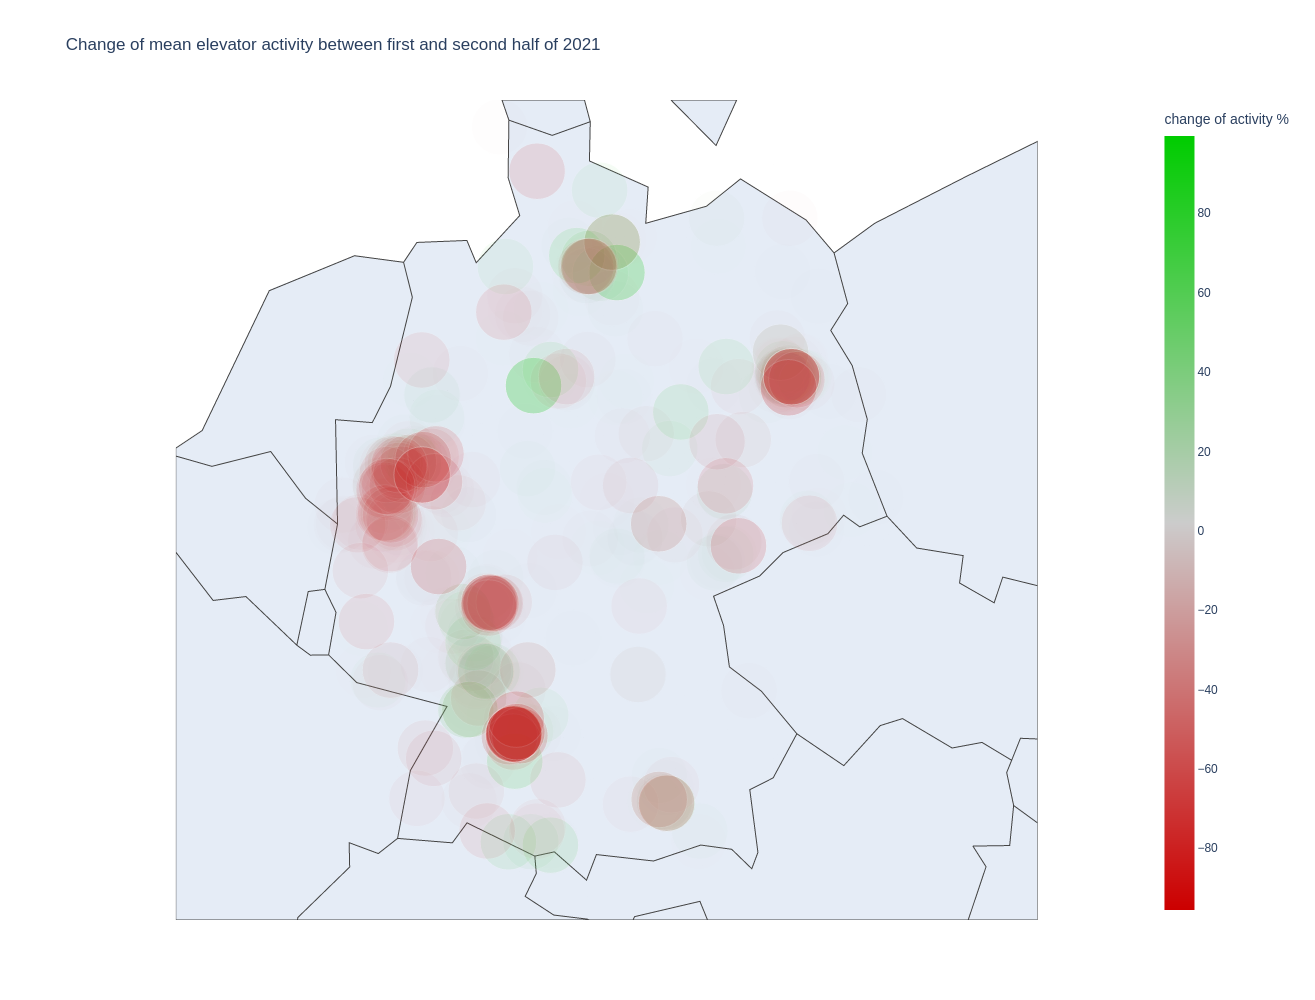
Plotting the change of device activity between early and late 2021 per geo-position makes the finger-pointing even easier:
I admit, there are a lot of elevators in the Rhineland (west) and i wouldn't want to manage them all. Stuttgart is the big spot in the south-west, Berlin (east) and Hamburg (north) also seem to have evolved ongoing problems.
The parking data is a little bit lame. Instead of actual numbers of free spots there
is only a category that says:
- 0 to 10
- 11 to 30
- 31 to 50
- 51 to maximum capacity
First of all, here's the number of places for each day that are
- listed: included in the API response list
- valid: have the
validDataflag and contain a value forcategory - active: a change of
categorywas recorded during that day
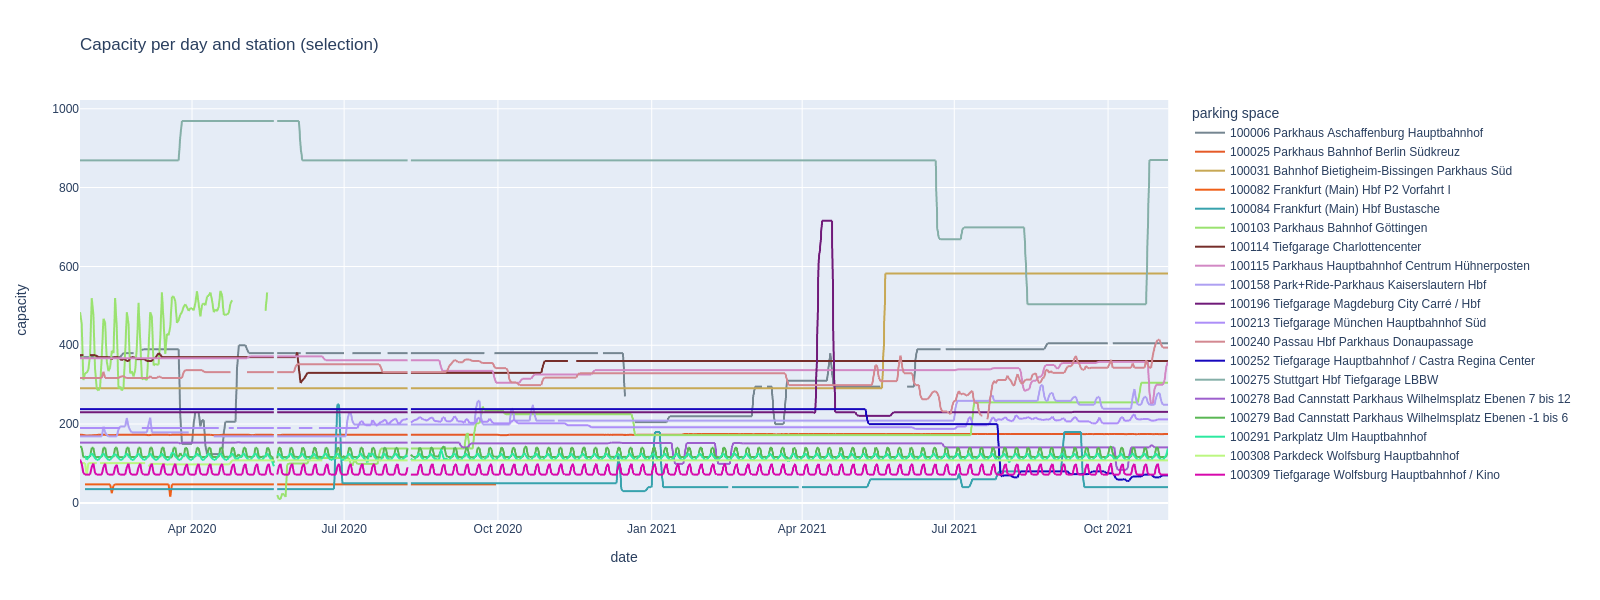
The idea of approximating the percentage of occupation using the category and the capacity becomes less attractive when looking at the capacity changes over time:
It's quite hard to explain what's going on there. Some parking lots seem to change their maximum capacity regularly every other weekday. Some of them temporarily loose capacity, maybe because of construction sites and some seem to mix up their occupation data with the capacity data. Other parking lots seem to grow immensely during a couple of days, or people just type in wrong numbers and some else corrects them?
In face of this totally erratic data, let's just look at pure category numbers:
The plot shows only stations with a certain amount of activity and
the black line shows the average of these stations.
Except for late summer (Aug. to Oct.) there does not seem to be happening much.
Or in other words, the parking lots do not change
their average category per month a lot. Also the plot is pretty much unreadable.
We can also look at the percentage of how much each category is listed. This time per day and for all stations:
One very significant impact which is visible here is the corona lock-down which
happened in Germany at about 16th of March 2020, which is exactly the beginning
of the flat area in the upper green line representing the > 50 category.
Apart from the category which somehow represents the number of free spaces we can simply plot the amount of change. This might go as a measure of general activity. Below is plotted the mean absolute difference of the category value between two hours, shown as average per week and space:
You know, just by looking at that one must judge that the pandemic is still going on.
The number of changes to station data per day tells us that the data monkeys are somewhat busy:
There is only one snapshot stored each day, so the number of stations edited per day is equal to the number of all edits per day. Also note, that for some stupid reason i setup the cronjob to 7 AM. Unless the data monkeys where up early or working through the night, the changes have probably occurred the day before the snapshot! However, i won't change the snapshot time for consistency.
Some particular dates jump out of the above graph where more than 5000 stations are edited during the same day. Here's a list of the top-five changes for each of these dates.
2020-06-03- 5455 x replace
ril100Identifiers.geographicCoordinates.coordinates.0 - 5454 x replace
ril100Identifiers.geographicCoordinates.coordinates.1 - 9 x add
ril100Identifiers.geographicCoordinates - 1 x replace
localServiceStaff.availability.friday.fromTime - 1 x replace
localServiceStaff.availability.friday.toTime
- 5455 x replace
2021-06-03- 5399 x remove
hasSteplessAccess - 5399 x replace
federalState - 5399 x replace
regionalbereich.shortName - 5371 x remove
timeTableOffice - 267 x replace
ril100Identifiers.isMain
- 5399 x remove
2021-06-04- 5399 x add
hasSteplessAccess - 5399 x add
timeTableOffice - 5399 x replace
federalState
- 5399 x add
2021-06-08- 5664 x replace
ril100Identifiers.isMain - 5458 x replace
evaNumbers.isMain - 1 x replace
mailingAddress.street - 1 x replace
evaNumbers.4.isMain - 1 x replace
ril100Identifiers.4.isMain
- 5664 x replace
2021-06-17- 5464 x replace
ril100Identifiers.geographicCoordinates.coordinates.0 - 5463 x replace
ril100Identifiers.geographicCoordinates.coordinates.1 - 61 x add
ril100Identifiers.geographicCoordinates - 3 x replace
mailingAddress.street - 1 x replace
ril100Identifiers.4.geographicCoordinates.coordinates.0
- 5464 x replace
2021-06-26- 5399 x replace
ril100Identifiers
- 5399 x replace
2021-07-02- 5399 x replace
ril100Identifiers - 5397 x replace
evaNumbers.isMain
- 5399 x replace
First of all, June 3rd (or probably June 2nd) seems to be the traditional day
to publish updated geo-coords for all stations. In 2021 a couple of major update
sessions followed after June 3rd, e.g. the federalState was replaced
with abbreviations, which got reverted again, and things got
removed and reappeared later.


