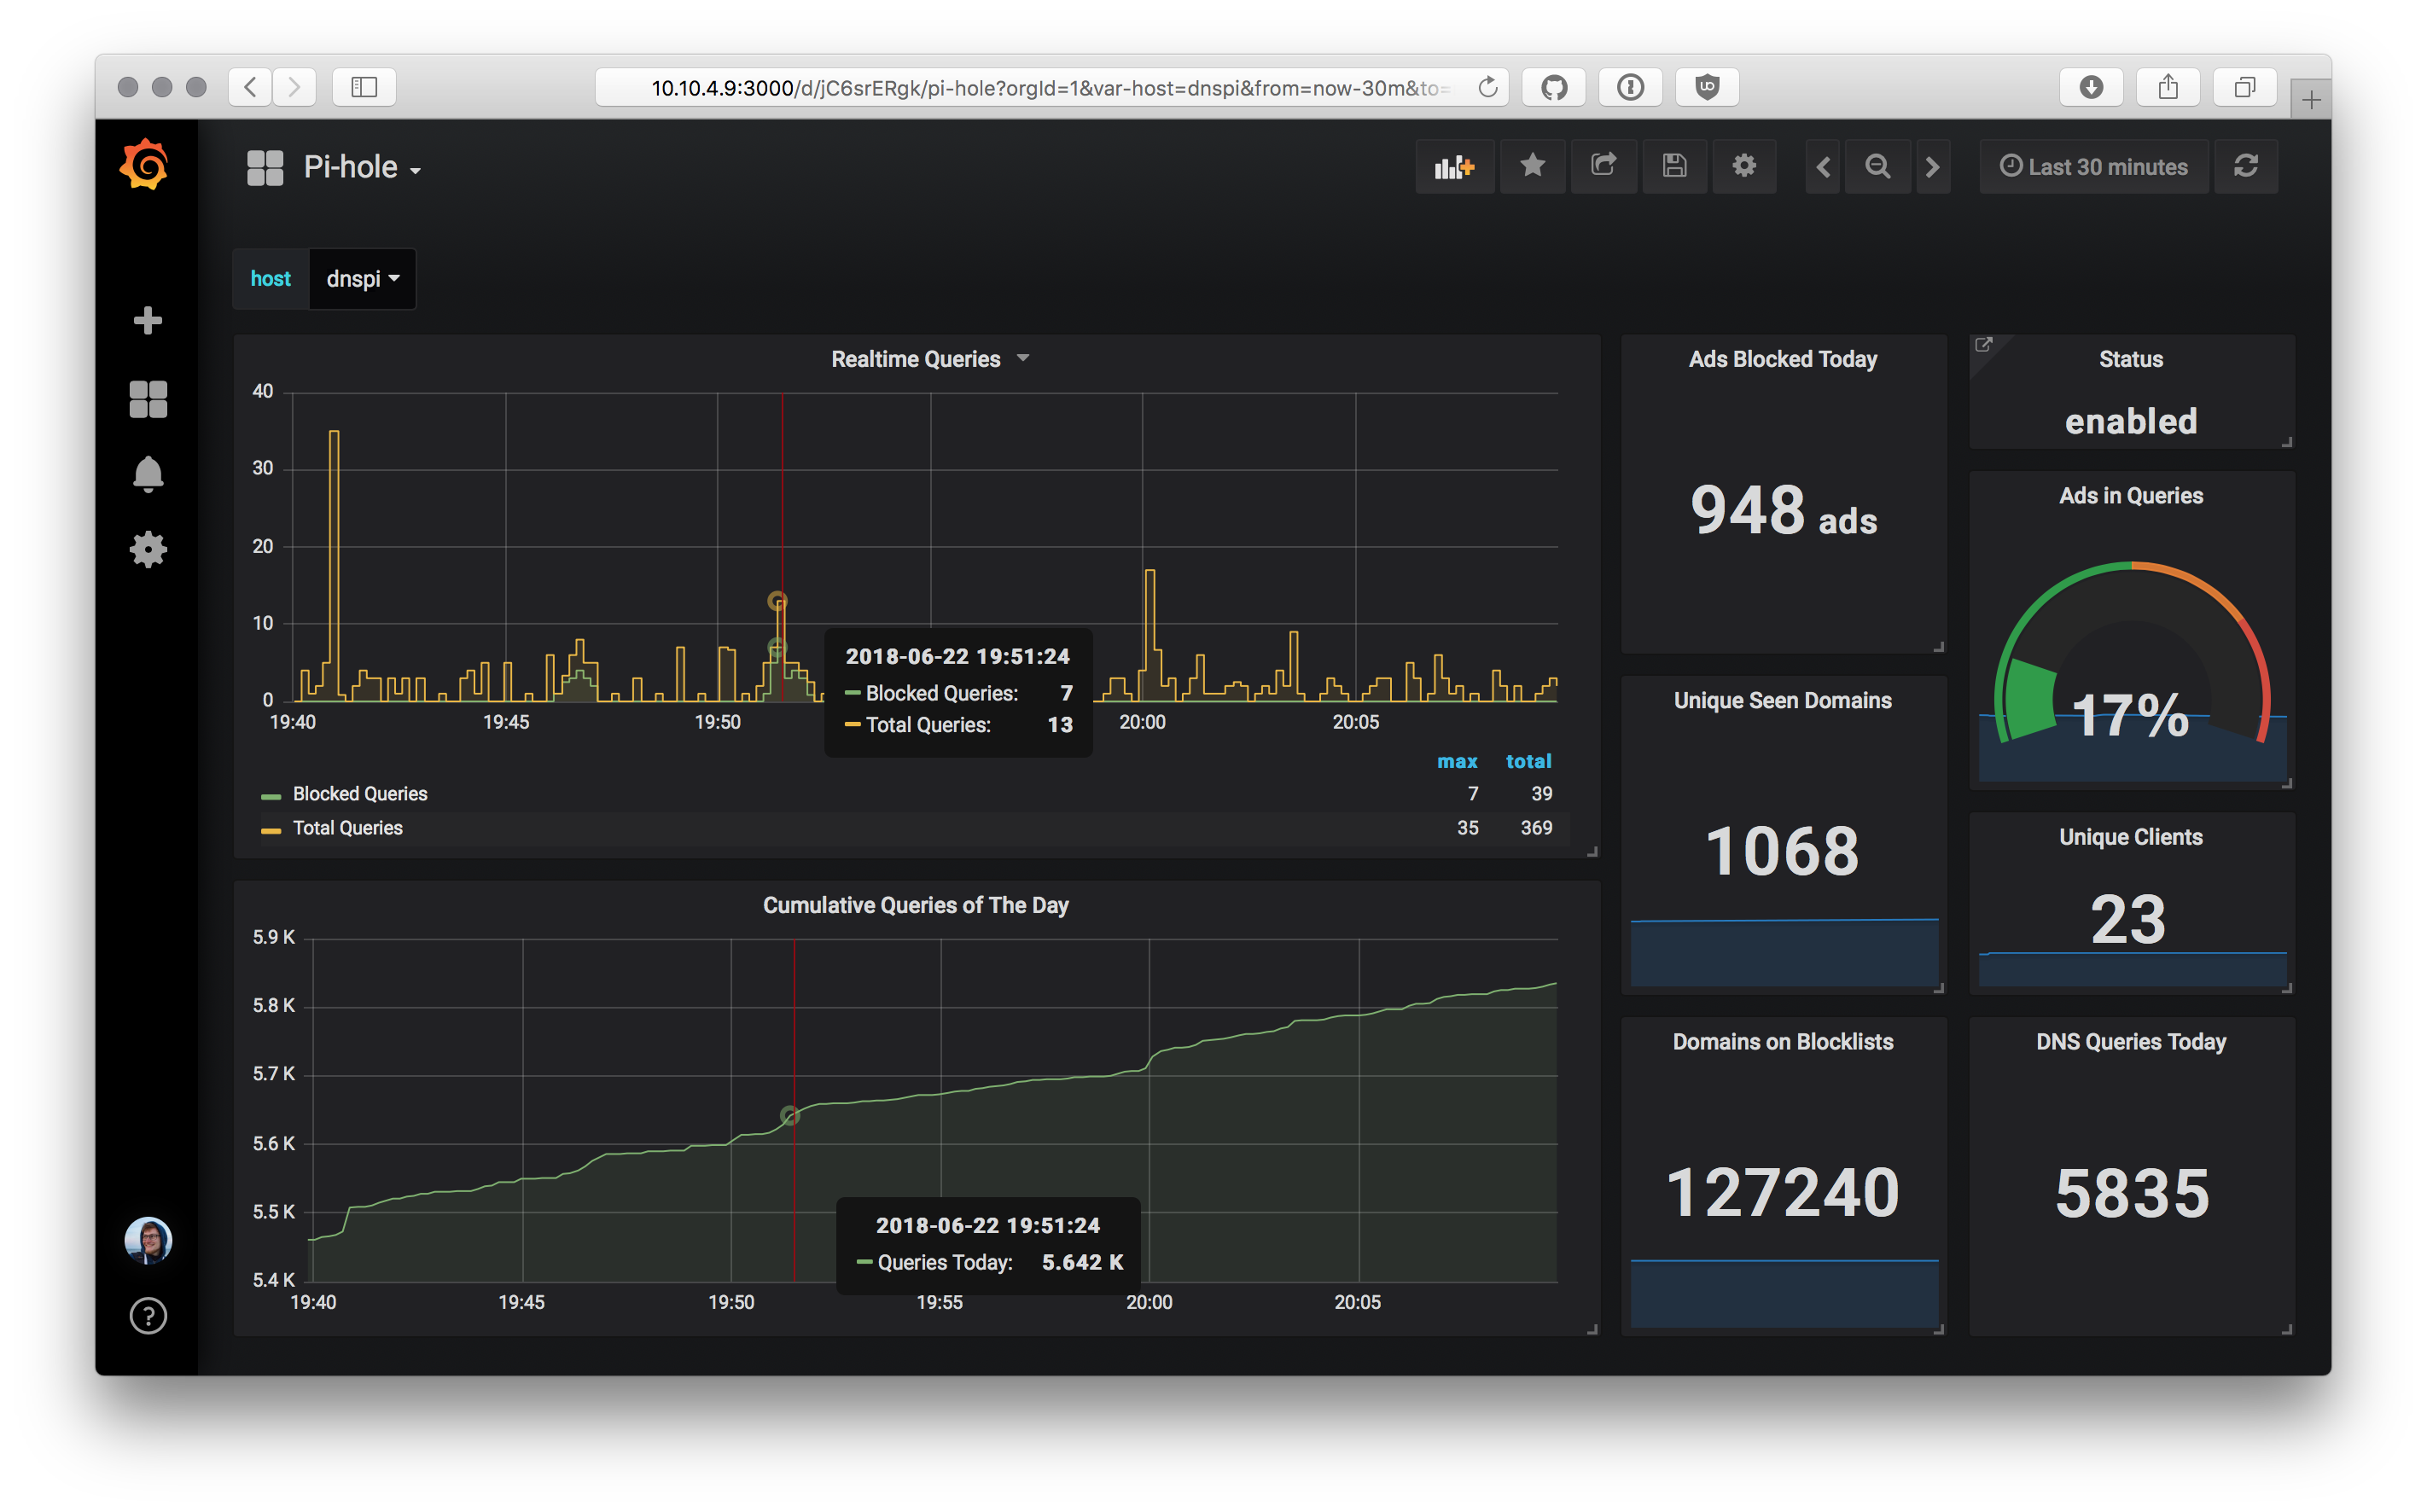
A simple daemonized script to report Pi-Hole stats to an InfluxDB, ready to be displayed via Grafana.
Heads-up: the configuration options changed fundamentally in recent versions. Please read up on the current state below.
-
To use docker for running the daemon, use the following command:
docker run \
  -e PIHOLE_INFLUXDB_HOST="myhostname" \
  -e PIHOLE_INFLUXDB_PORT="8086" \
  -e PIHOLE_INFLUXDB_USERNAME="myusername" \
  -e PIHOLE_INFLUXDB_PASSWORD="mysupersecretpassword" \
  -e PIHOLE_INFLUXDB_DATABASE="pihole" \
  -e PIHOLE_INSTANCES="localhost=http://127.0.0.1/admin/api.php" \
  registry.gitlab.com/janw/pi-hole-influx
-
For running it on a Raspberry Pi (arm v7 arch), use the dedicated
armv7image tag:docker run \ -e PIHOLE_INFLUXDB_HOST="myhostname" \ -e PIHOLE_INFLUXDB_USERNAME="myusername" \ -e PIHOLE_INFLUXDB_PASSWORD="mysupersecretpassword" \ --network host \ registry.gitlab.com/janw/pi-hole-influx:armv7
Before you can run the above, you will need to have your docker server authenticated with registry.gitlab.com:
- Create a personal access token following this documentation: https://docs.gitlab.com/ee/user/profile/personal_access_tokens.html (Save the personal access token somewhere safe. Once you leave or refresh the page, you won’t be able to access it again.)
- Login to the registry with:
docker login -u <your-gitlab-username> -p <access-token> registry.gitlab.com
The following values are the defaults and will be used if not set:
PIHOLE_INFLUXDB_PORT="8086"PIHOLE_INFLUXDB_HOST="127.0.0.1"PIHOLE_INFLUXDB_DATABASE="pihole"PIHOLE_INSTANCES="localhost=http://127.0.0.1/admin/api.php"
PIHOLE_INSTANCES contains the Pi-hole instances that are to be reported. Multiple instances can given in a dict-like boxed syntax, known as Inline Tables in TOML:
PIHOLE_INSTANCES="{first_one='http://127.0.0.1/admin/api.php',second_pihole='http://192.168.42.79/admin/api.php'[,…]}"Note that instances are prefixed by a custom name.
If you want to run the daemon through Docker-compose, you might appreciate the configuration example below.
version: "2"
services:
  piholeinflux:
    image: registry.gitlab.com/janw/pi-hole-influx
    container_name: piholeinflux
    restart: unless-stopped
    environment:

      # Replace details with your InfluxDB's hostname and credentials
      PIHOLE_INFLUXDB_HOST: "10.10.10.1"
      PIHOLE_INFLUXDB_PORT: "8086"
      PIHOLE_INFLUXDB_USERNAME: "pihole"
      PIHOLE_INFLUXDB_PASSWORD: "pihole"
      PIHOLE_INFLUXDB_DATABASE: "pihole"

      # Replace with your Pi-Hole's address including path to API below
      PIHOLE_INSTANCES: "pihole=http://10.10.0.10/admin/api.php"

    # OPTIONAL: Instead of the aobove environment variables,
    #           use a custom copy of the user.toml config file.
    volumes:
- ./custom/config.toml:/user.tomlAs Pi-hole (as the name suggests) is built specifically with the Raspberry Pi in mind (and I run it on there as well), the following steps assume an instance of Pi-hole on Raspbian Strech Lite, with no additional modifications so far. Piholestatus will be configured to run on the same Pi.
First install the necessary packages via apt as Raspbian Lite does have neither git nor pip installed.
sudo apt update
sudo apt install git python3-pip -y
Now clone the repo, install the Python dependencies, and make sure to copy and adjust the example configuation file to match your setup.
git clone https://github.com/janw/pi-hole-influx.git ~/pi-hole-influx
cd ~/pi-hole-influx

# Install requirements via pip
pip3 install -r requirements.txt

# Copy config.example and modify it (should be self-explanatory)
cp user.toml.example user.toml
vi user.toml
Before starting the daemon for the first time, symlink the systemd service into place, reload, and enable the service.
sudo ln -s /home/pi/pi-hole-influx/piholeinflux.service /etc/systemd/system/
sudo systemctl --system daemon-reload
sudo systemctl enable piholeinflux.service
Now you're ready to start the daemon. Wait a few seconds to check its status.
sudo systemctl start piholeinflux.service
sudo systemctl status piholeinflux.service
The status should look as follows. Note the Status: line showing the last time, the daemon reported to InfluxDB:
● piholeinflux.service - Pi-hole-Influx - Send Pi-hole statistics to InfluxDB for visualization
   Loaded: loaded (/home/pi/pi-hole-influx/piholeinflux.service; enabled; vendor preset: enabled)
   Active: active (running) since Fri 2018-06-22 19:03:56 UTC; 10min ago
     Docs: https://github.com/janw/pi-hole-influx
 Main PID: 21329 (python)
   Status: "Reported to InfluxDB at 2018-06-22 19:14:09 +0000"
   CGroup: /system.slice/piholeinflux.service
           └─21329 /usr/bin/python /home/pi/pi-hole-influx/piholeinflux.py
The example dashboard seen at the top uses the collected data and displays it in concise and sensible graphs and single stats. The dashboard can be imported into your Grafana instance from the dashboard.json file included in the repo, or by using ID 6603 to import it from Grafana's Dashboard Directory.
The script originally created by Jon Hayward, adapted to work with InfluxDB by /u/tollsjo in December 2016, and improved and extended by @johnappletree. "If I have seen further it is by standing on the shoulders of giants". 🤓

