Code in base R for the data visualizations of '30 Years of Socio-Economic Developments in Central and Eastern Europe'
The set of data visualizations is available at http://dimiter.eu/Visualizations_files/CEE.html
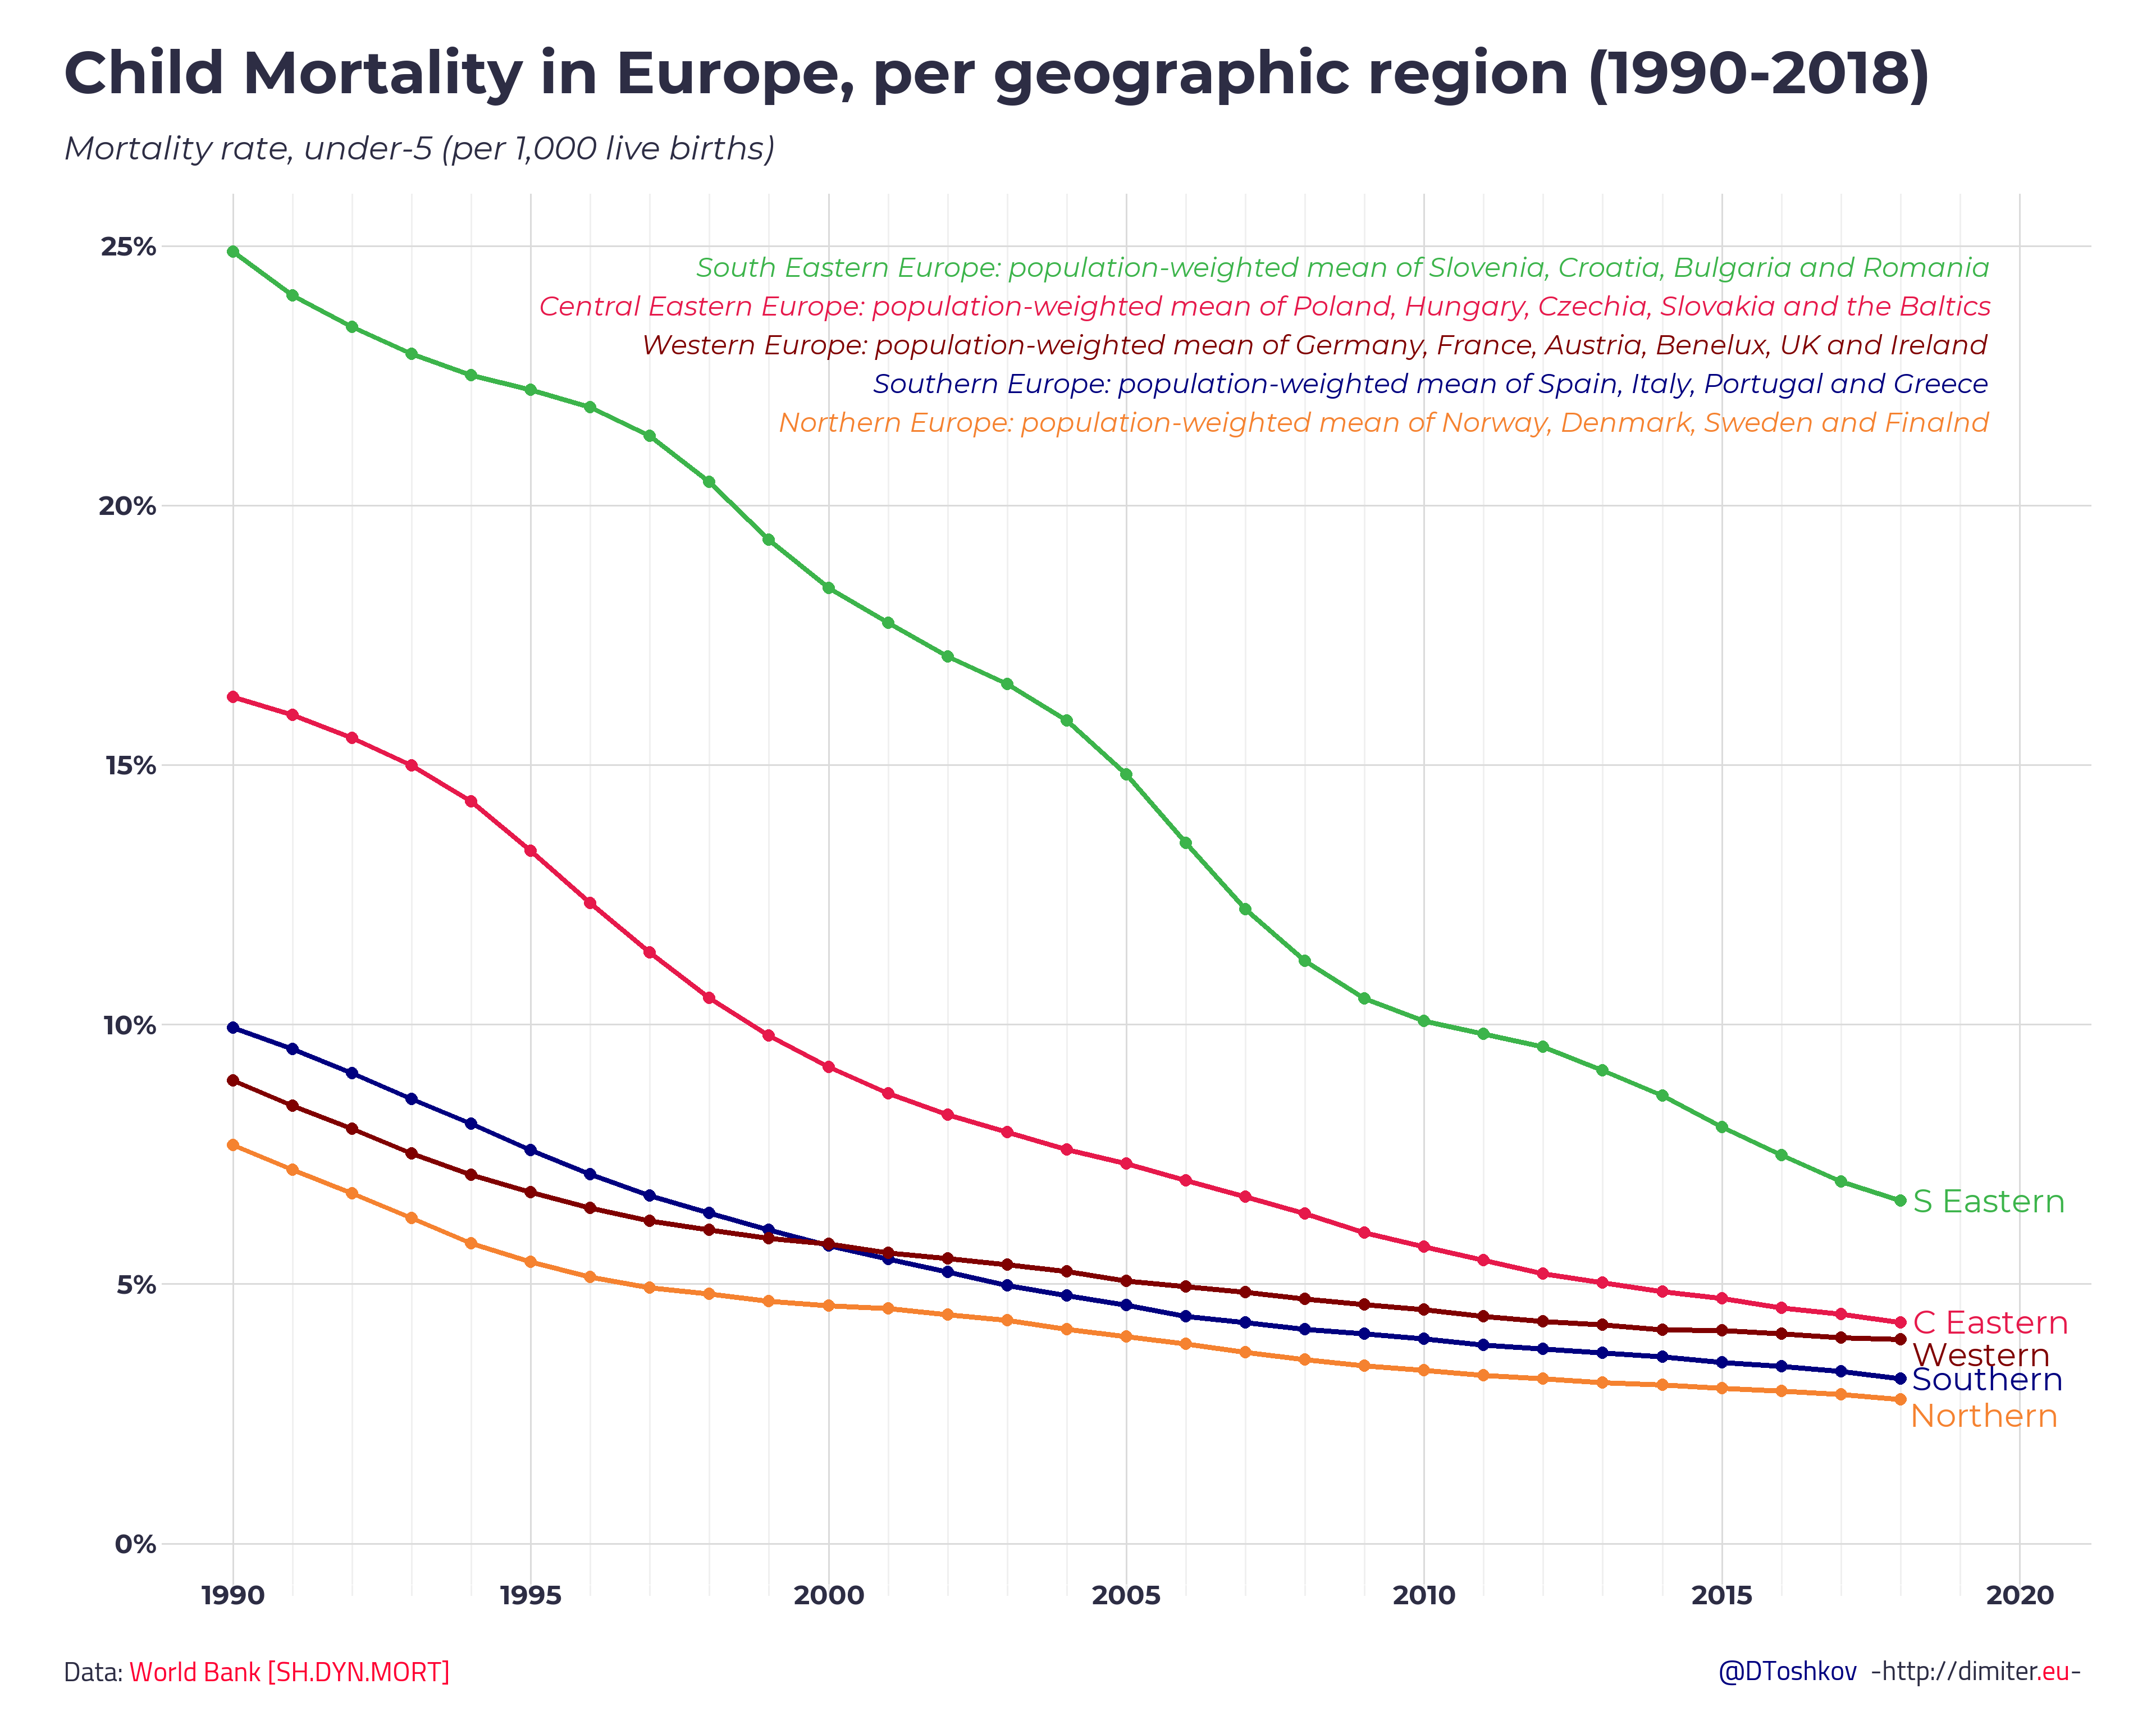
This is one of the 13 graphs:
Code for the data visualizations of 30 Years of Socio-Economic Developments in Central and Eastern Europe
R
Code in base R for the data visualizations of '30 Years of Socio-Economic Developments in Central and Eastern Europe'
The set of data visualizations is available at http://dimiter.eu/Visualizations_files/CEE.html
This is one of the 13 graphs: