PyComplexHeatmap is a Python package to plot complex heatmap (clustermap). Please click here for documentation.
https://dingwb.github.io/PyComplexHeatmap
PYPI
wiki/layout
wiki/Parameters
wiki/Features
- matplotlib>=3.4.3
- numpy
- pandas
- scipy
- fastcluster
pip install --ignore-install matplotlib==3.5.1 numpy==1.20.3 pandas==1.4.1
pip install seaborn #only needed when call functions in tools.py
Ding, W., Goldberg, D. and Zhou, W. (2023), PyComplexHeatmap: A Python package to visualize multimodal genomics data. iMeta e115. https://doi.org/10.1002/imt2.115
DOI: 10.1002/imt2.115
- Install using pip:
pip install PyComplexHeatmap

#upgrade from older version
pip install --upgrade PyComplexHeatmap- Install the developmental version directly from github:
pip install git+https://github.com/DingWB/PyComplexHeatmapif you have installed it previously and want to update it, please run
pip uninstall PyComplexHeatmap
and install from github again
OR
git clone https://github.com/DingWB/PyComplexHeatmap
cd PyComplexHeatmap
python setup.py installfrom PyComplexHeatmap import *
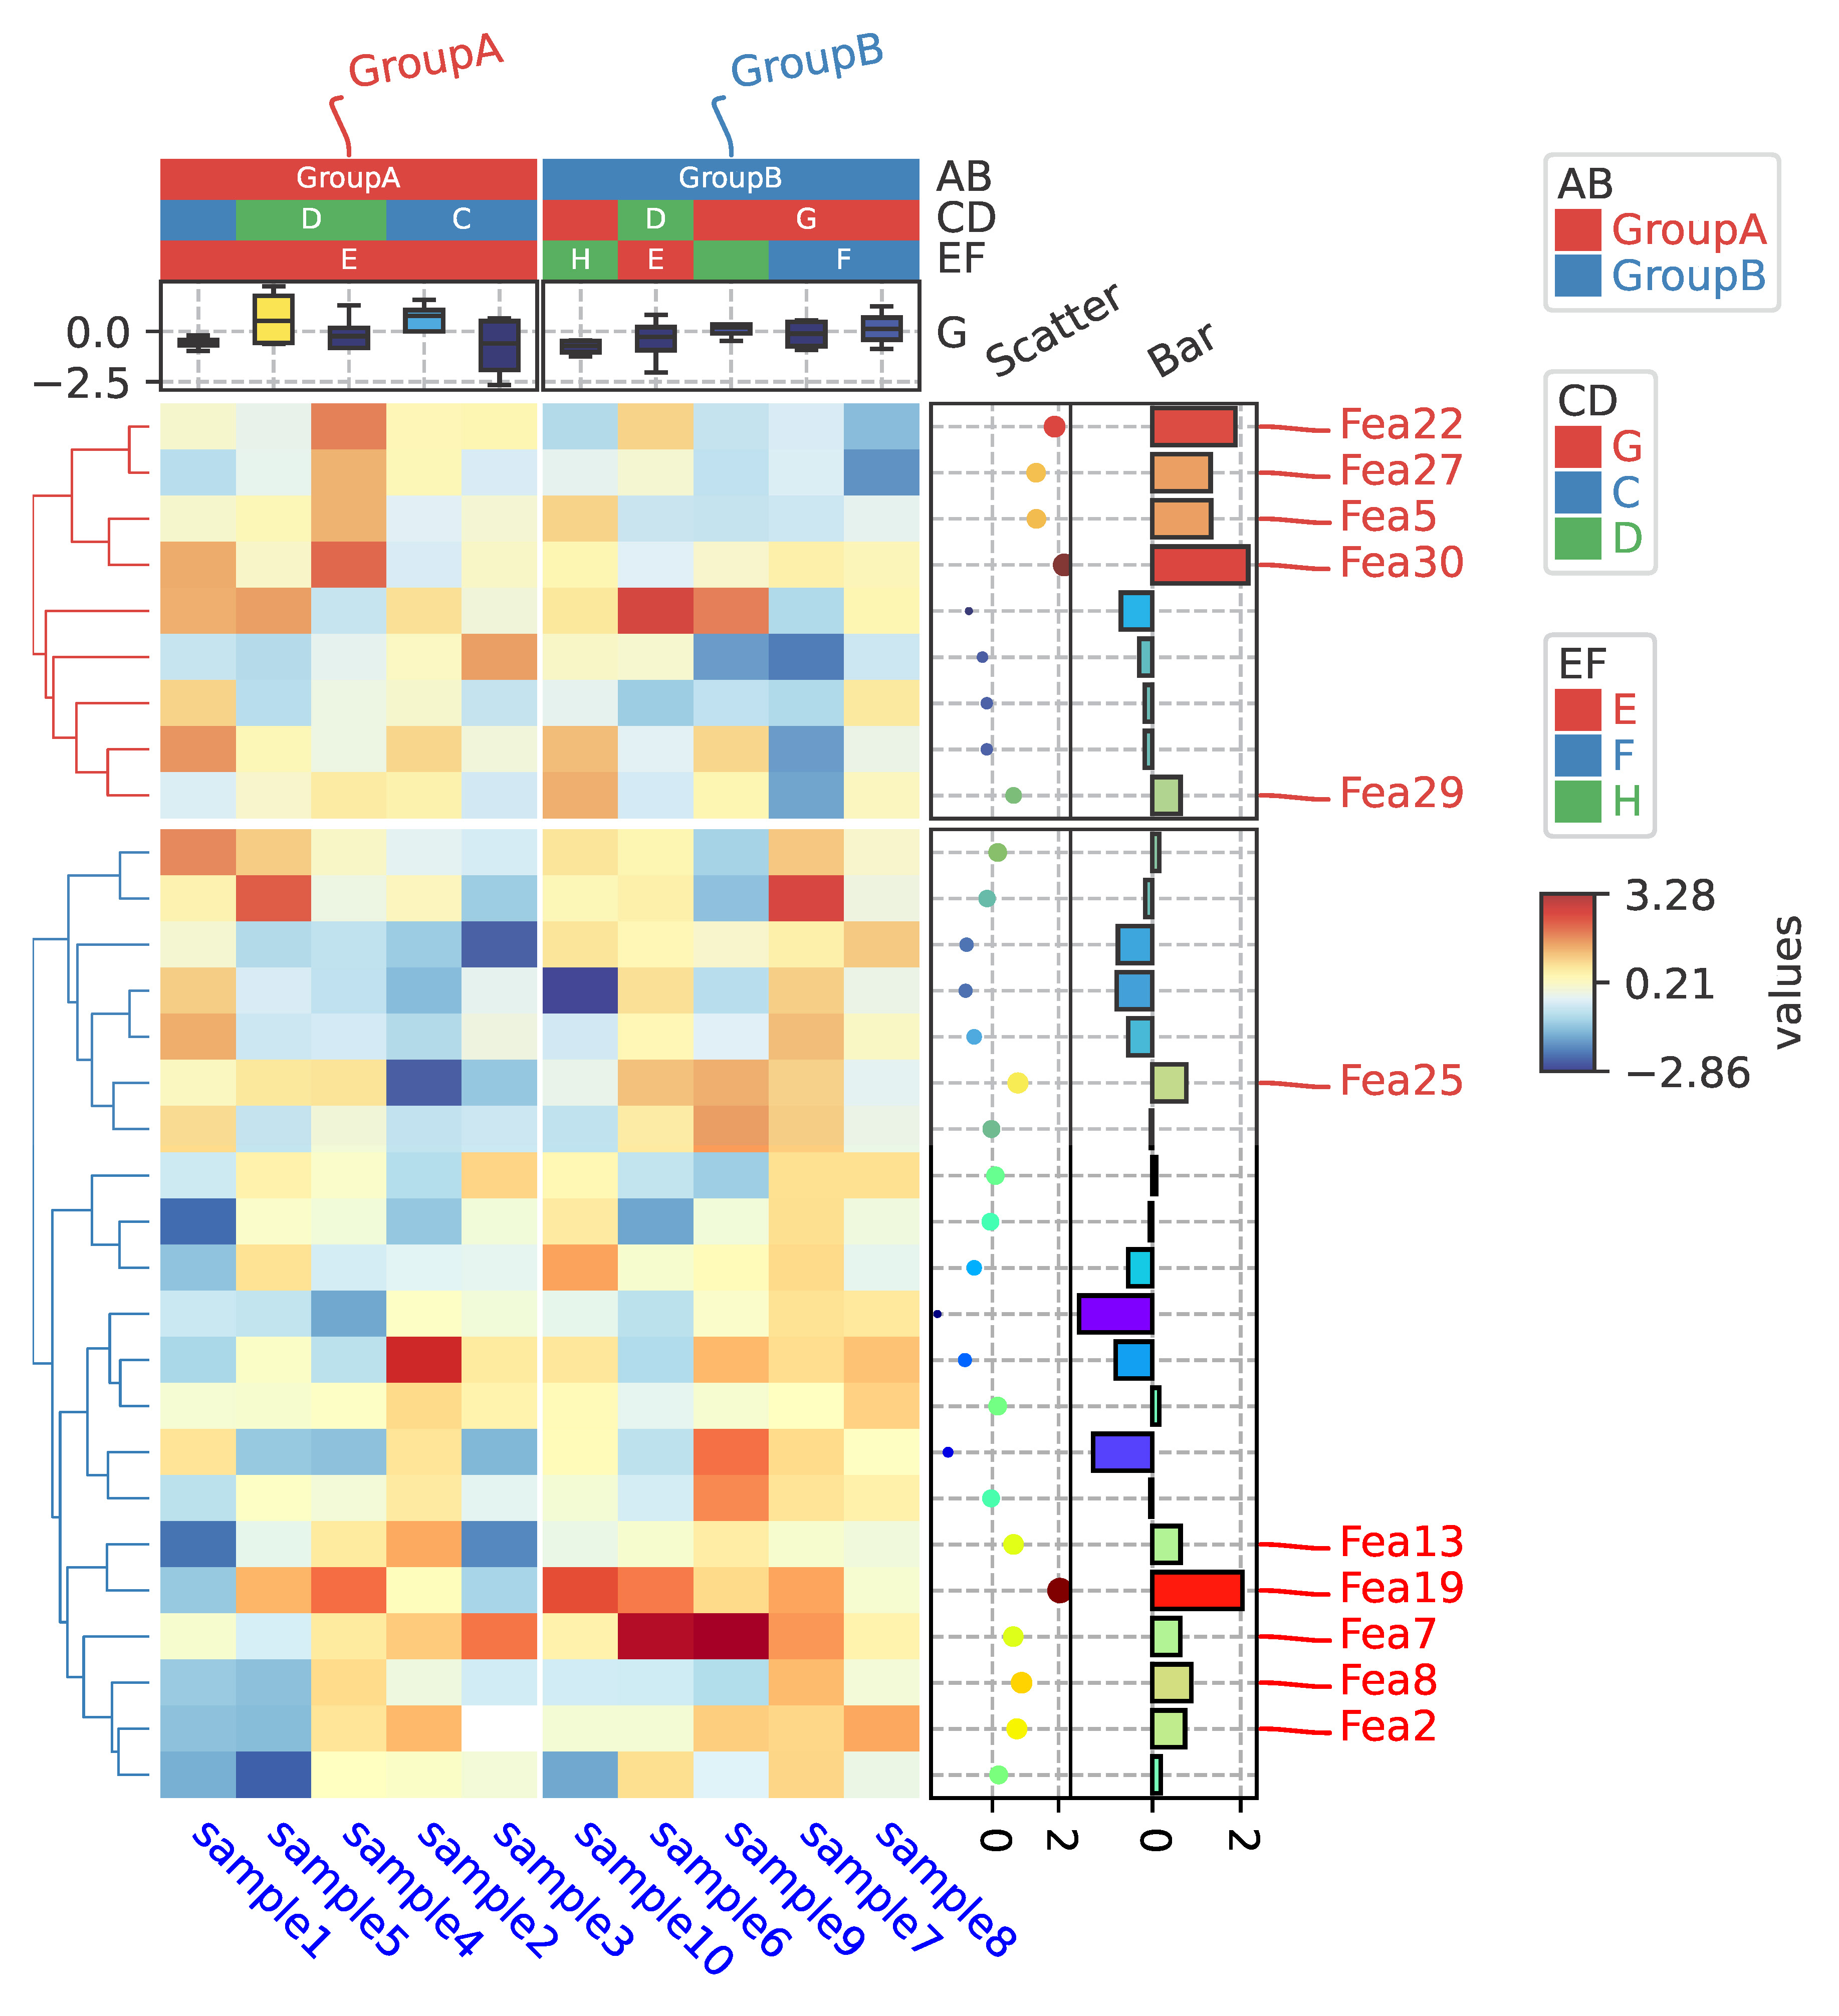
#Generate example dataset (random)
df = pd.DataFrame(['GroupA'] * 5 + ['GroupB'] * 5, columns=['AB'])
df['CD'] = ['C'] * 3 + ['D'] * 3 + ['G'] * 4
df['EF'] = ['E'] * 6 + ['F'] * 2 + ['H'] * 2
df['F'] = np.random.normal(0, 1, 10)
df.index = ['sample' + str(i) for i in range(1, df.shape[0] + 1)]
df_box = pd.DataFrame(np.random.randn(10, 4), columns=['Gene' + str(i) for i in range(1, 5)])
df_box.index = ['sample' + str(i) for i in range(1, df_box.shape[0] + 1)]
df_bar = pd.DataFrame(np.random.uniform(0, 10, (10, 2)), columns=['TMB1', 'TMB2'])
df_bar.index = ['sample' + str(i) for i in range(1, df_box.shape[0] + 1)]
df_scatter = pd.DataFrame(np.random.uniform(0, 10, 10), columns=['Scatter'])
df_scatter.index = ['sample' + str(i) for i in range(1, df_box.shape[0] + 1)]
df_heatmap = pd.DataFrame(np.random.randn(30, 10), columns=['sample' + str(i) for i in range(1, 11)])
df_heatmap.index = ["Fea" + str(i) for i in range(1, df_heatmap.shape[0] + 1)]
df_heatmap.iloc[1, 2] = np.nan
#Annotate the rows with sample4 > 0.5
df_rows = df_heatmap.apply(lambda x:x.name if x.sample4 > 0.5 else None,axis=1)
df_rows=df_rows.to_frame(name='Selected')
df_rows['XY']=df_rows.index.to_series().apply(lambda x:'A' if int(x.replace('Fea',''))>=15 else 'B')
#Create row annotations
row_ha = HeatmapAnnotation(
Scatter=anno_scatterplot(df_heatmap.sample4.apply(lambda x:round(x,2)),
height=12,cmap='jet',legend=False),
Bar=anno_barplot(df_heatmap.sample4.apply(lambda x:round(x,2)),
height=16,cmap='rainbow',legend=False),
selected=anno_label(df_rows,colors='red',relpos=(-0.05,0.4)),
label_kws={'rotation':30,'horizontalalignment':'left','verticalalignment':'bottom'},
axis=0,verbose=0)
#Create column annotations
col_ha = HeatmapAnnotation(label=anno_label(df.AB, merge=True,rotation=10),
AB=anno_simple(df.AB,add_text=True),axis=1,
CD=anno_simple(df.CD,add_text=True),
EF=anno_simple(df.EF,add_text=True,
legend_kws={'frameon':True}),
G=anno_boxplot(df_box, cmap='jet',legend=False),
verbose=0)
plt.figure(figsize=(5.5, 6.5))
cm = ClusterMapPlotter(data=df_heatmap, top_annotation=col_ha,right_annotation=row_ha,
col_cluster=True,row_cluster=True,
col_split=df.AB,row_split=2,
col_split_gap=0.5,row_split_gap=0.8,
label='values',row_dendrogram=True,
show_rownames=False,show_colnames=True,
tree_kws={'row_cmap': 'Set1'},verbose=0,legend_gap=5,
cmap='RdYlBu_r',xticklabels_kws={'labelrotation':-45,'labelcolor':'blue'})
#plt.savefig("example0.pdf", bbox_inches='tight')
plt.show()Click picture to view the source code
|
|
|
|
|
|
|
|
|
|
|
|
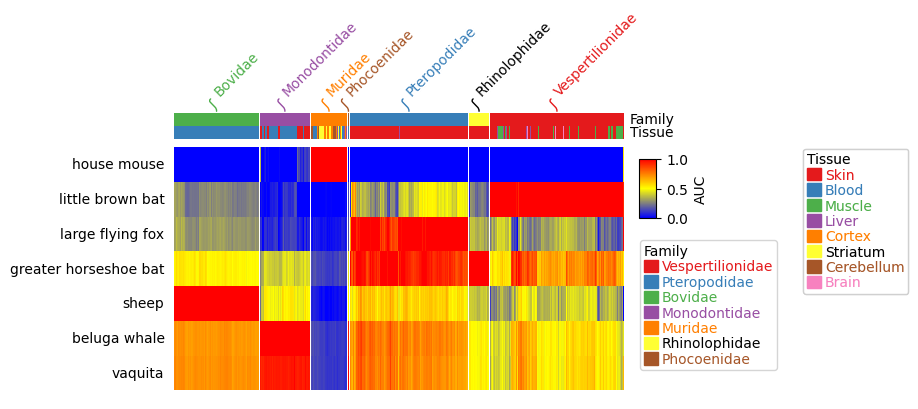
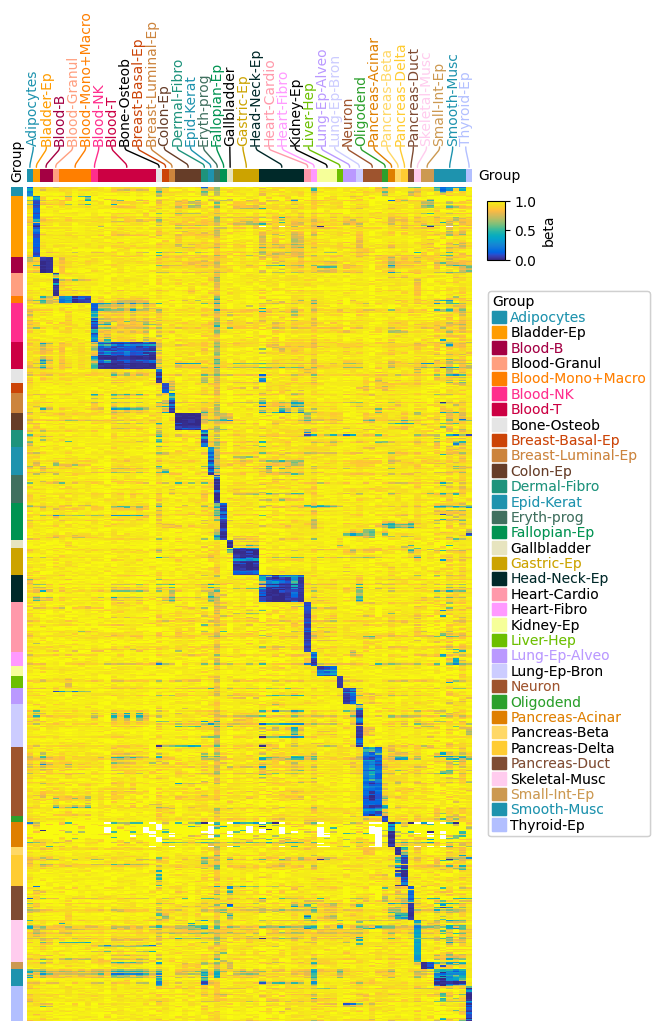
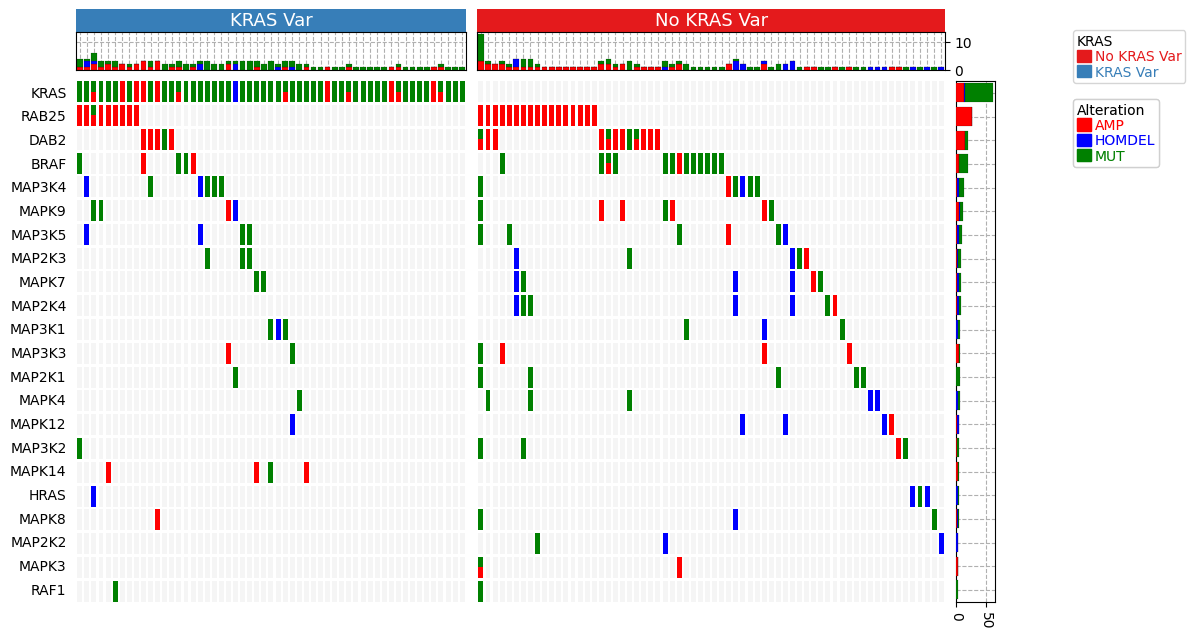
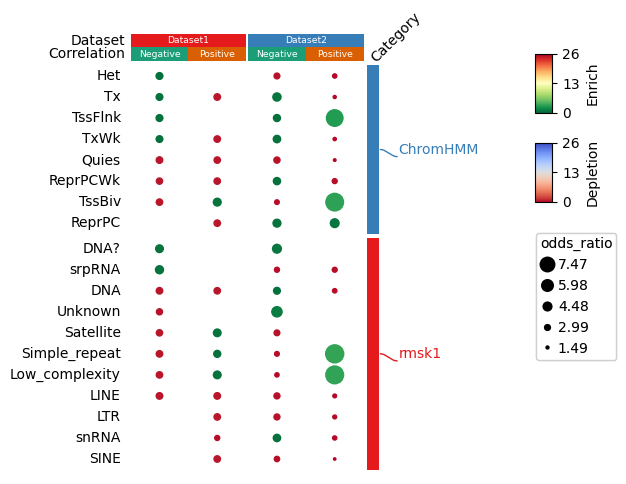
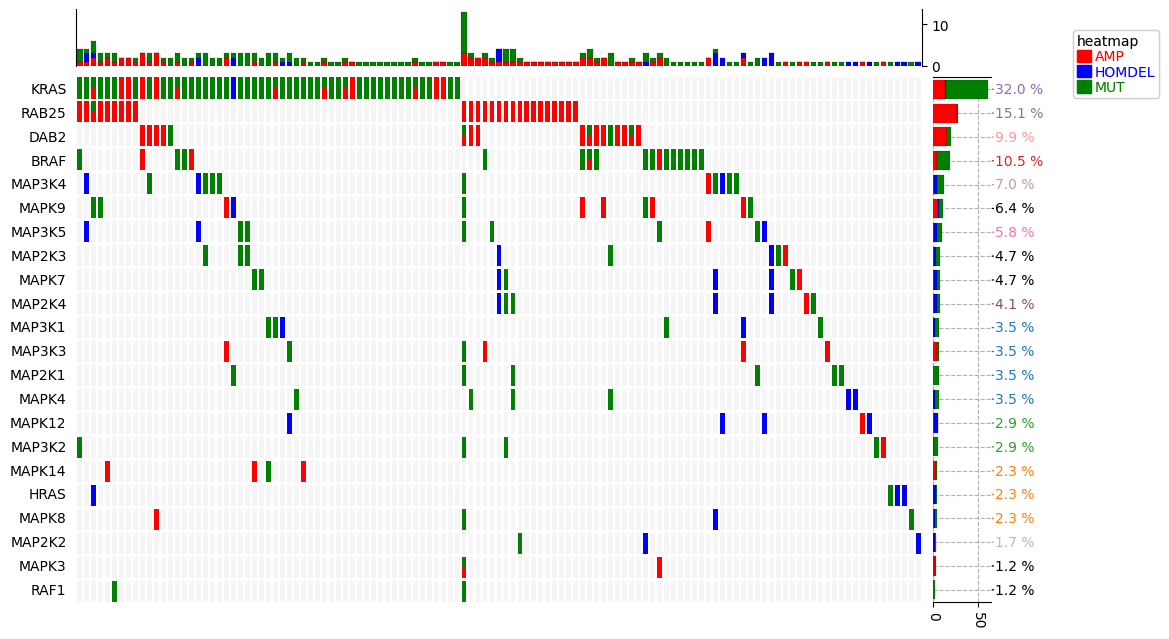
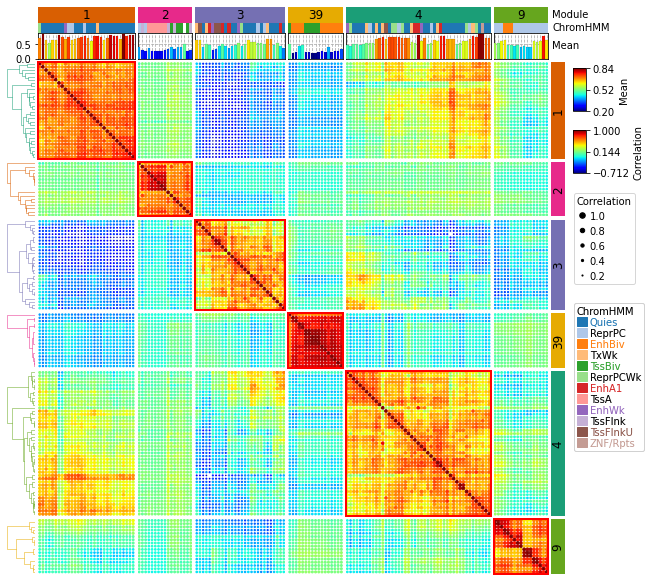
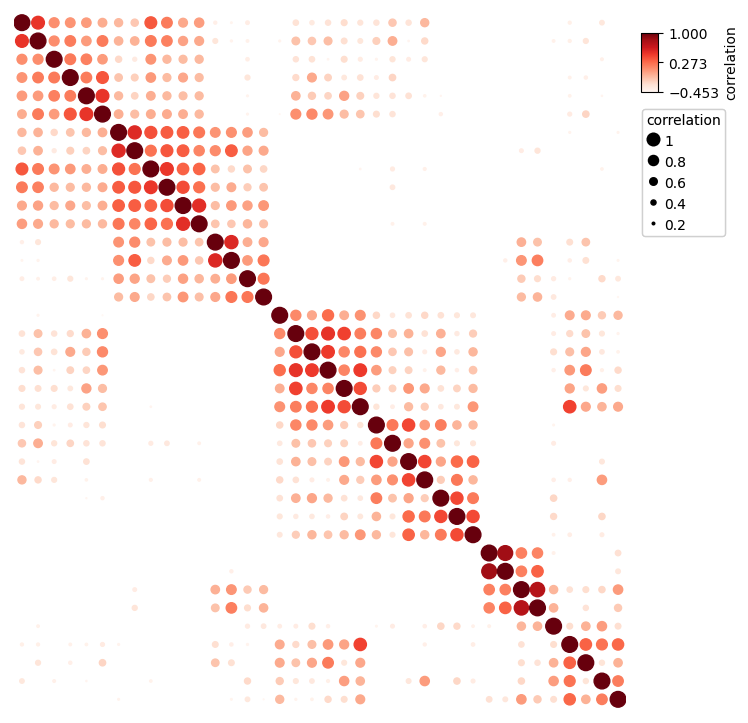
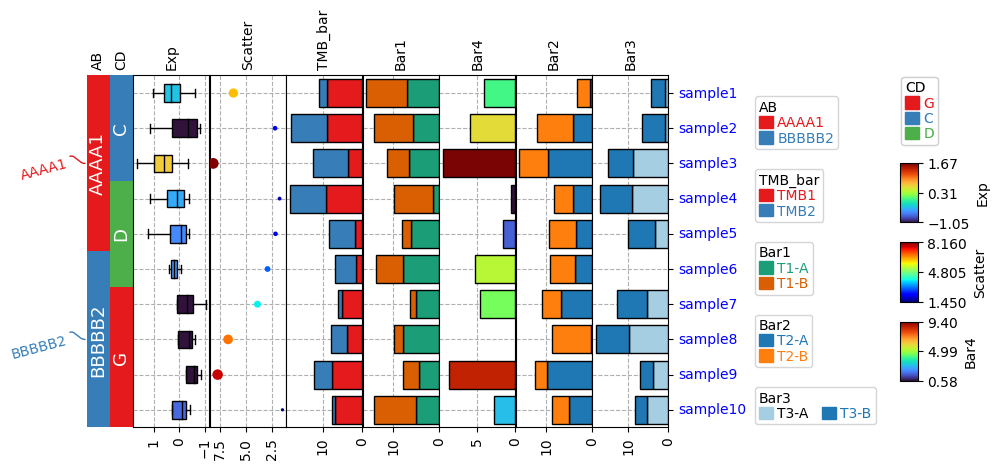
https://dingwb.github.io/PyComplexHeatmap/build/html/more_examples.html
The PyComplexHeatmap project welcomes your expertise and enthusiasm!
Small improvements or fixes are always appreciated. If you are considering larger contributions to the source code, please contact us (ding.wu.bin.gm@gmail.com).
Writing code isn’t the only way to contribute to PyComplexHeatmap. You can also:
- review pull requests
- help us stay on top of new and old issues
- develop tutorials, presentations, and other educational materials
- maintain and improve our website
- develop graphic design for our brand assets and promotional materials
- translate website content
- help with outreach and onboard new contributors
- put forward some new ideas about update.


