This project demonstrates how to monitor Ethereum smart contract transactions in real-time using Etherscan, InfluxDB, and Grafana. It fetches transaction data from the Ethereum blockchain via the Etherscan API, stores it in InfluxDB, and visualizes it in Grafana.
This project provides a comprehensive solution for real-time monitoring of Ethereum smart contract transactions. It's designed to fetch, store, and visualize transaction data, making it invaluable for blockchain analytics, financial tracking, or anomaly detection.
- Etherscan API: Interfaces with the Ethereum blockchain to retrieve detailed transaction data.
- InfluxDB: Handles large influxes of time-series data, perfect for storing transaction details over time.
- Grafana: Visualizes time-series data in an interactive, user-friendly manner, allowing for deep insights into transaction trends and patterns.
- Python: Offers the flexibility and libraries necessary for blockchain data retrieval and processing.
docker-compose up -d
- Obtain an API key from Etherscan.
- Securely store the API key in a
.envfile.
- Install InfluxDB and set up a bucket named
mybucket(or any) for storing transaction data. - Configure retention policies as needed to manage data storage efficiently.
- Install Grafana and integrate it with InfluxDB for real-time data visualization.
- Set up various dashboards to track different aspects of Ethereum transactions.
- Execute the Python script to periodically fetch transaction data from Etherscan.
- Data includes block number, transaction hash, nonce, addresses, value transferred, and gas details.
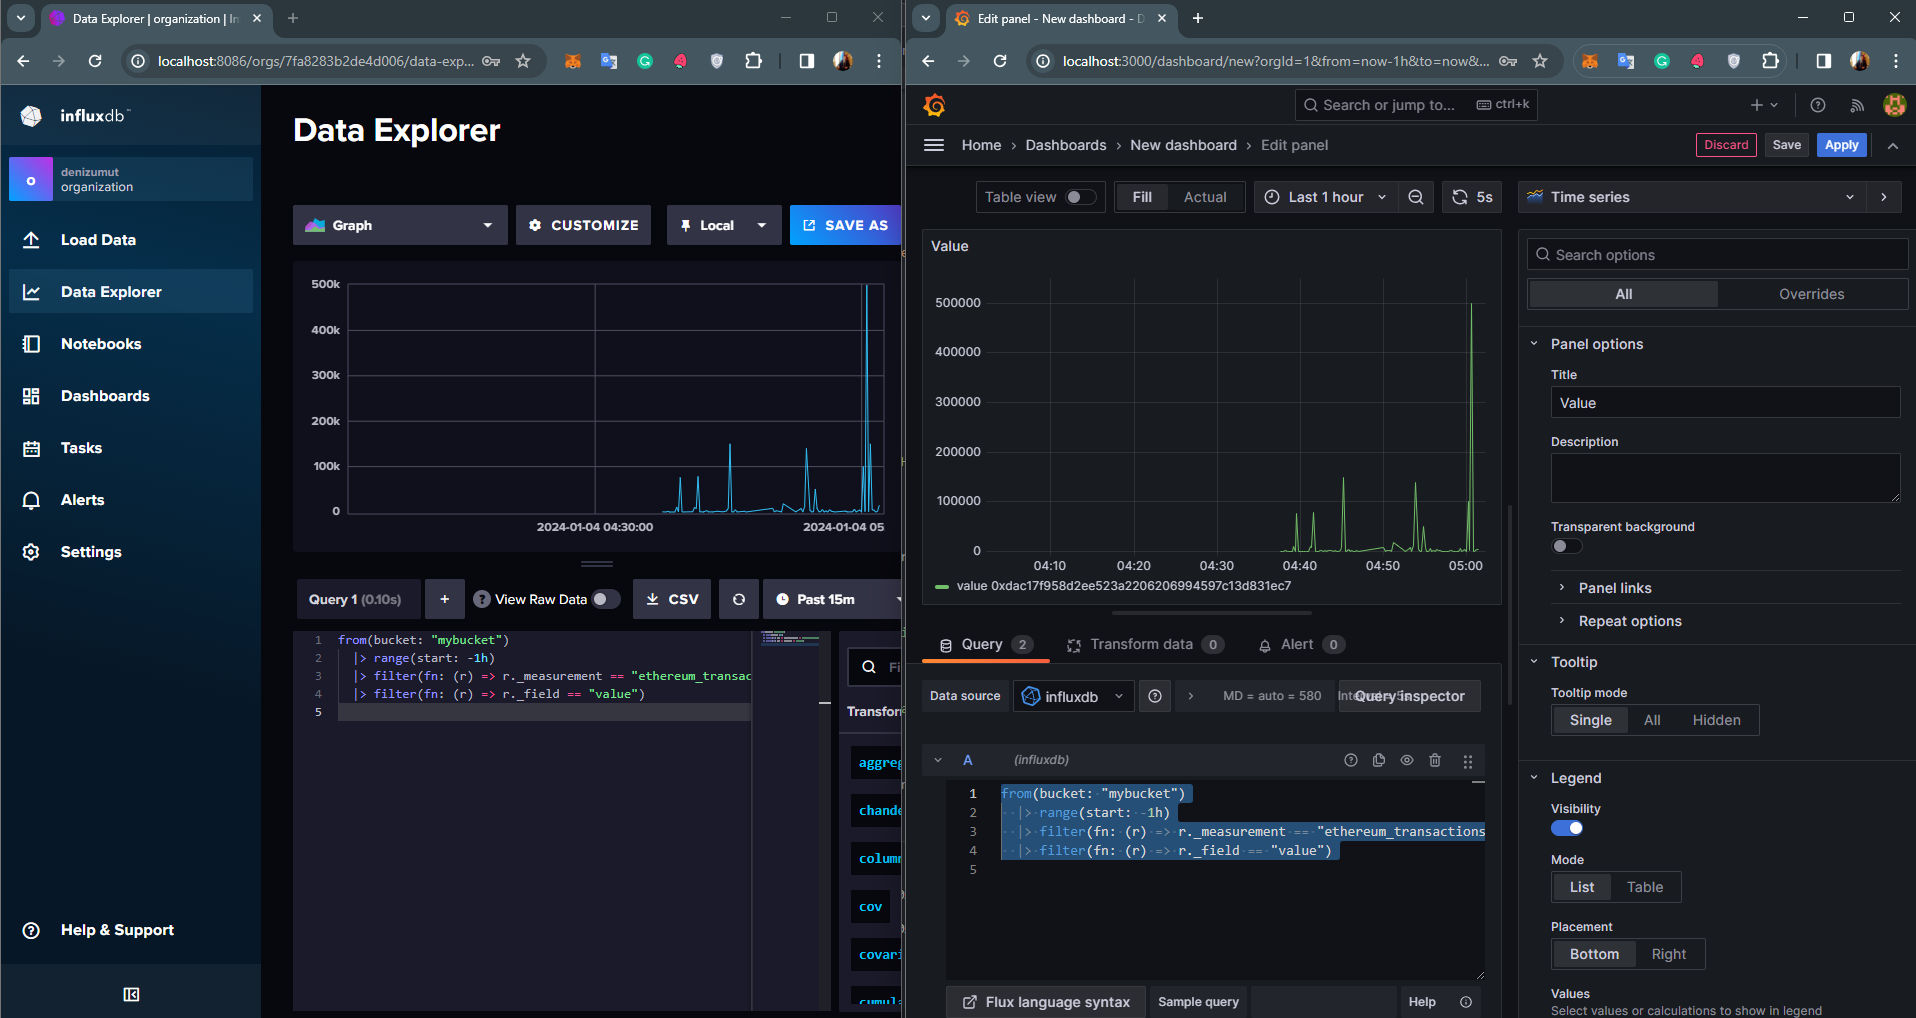
- Value Transaction Query: Visualize the value of transactions over time.
   from(bucket: "mybucket")
|> range(start: -1h)
|> filter(fn: (r) => r._measurement == "ethereum_transactions")
|> filter(fn: (r) => r._field == "value")
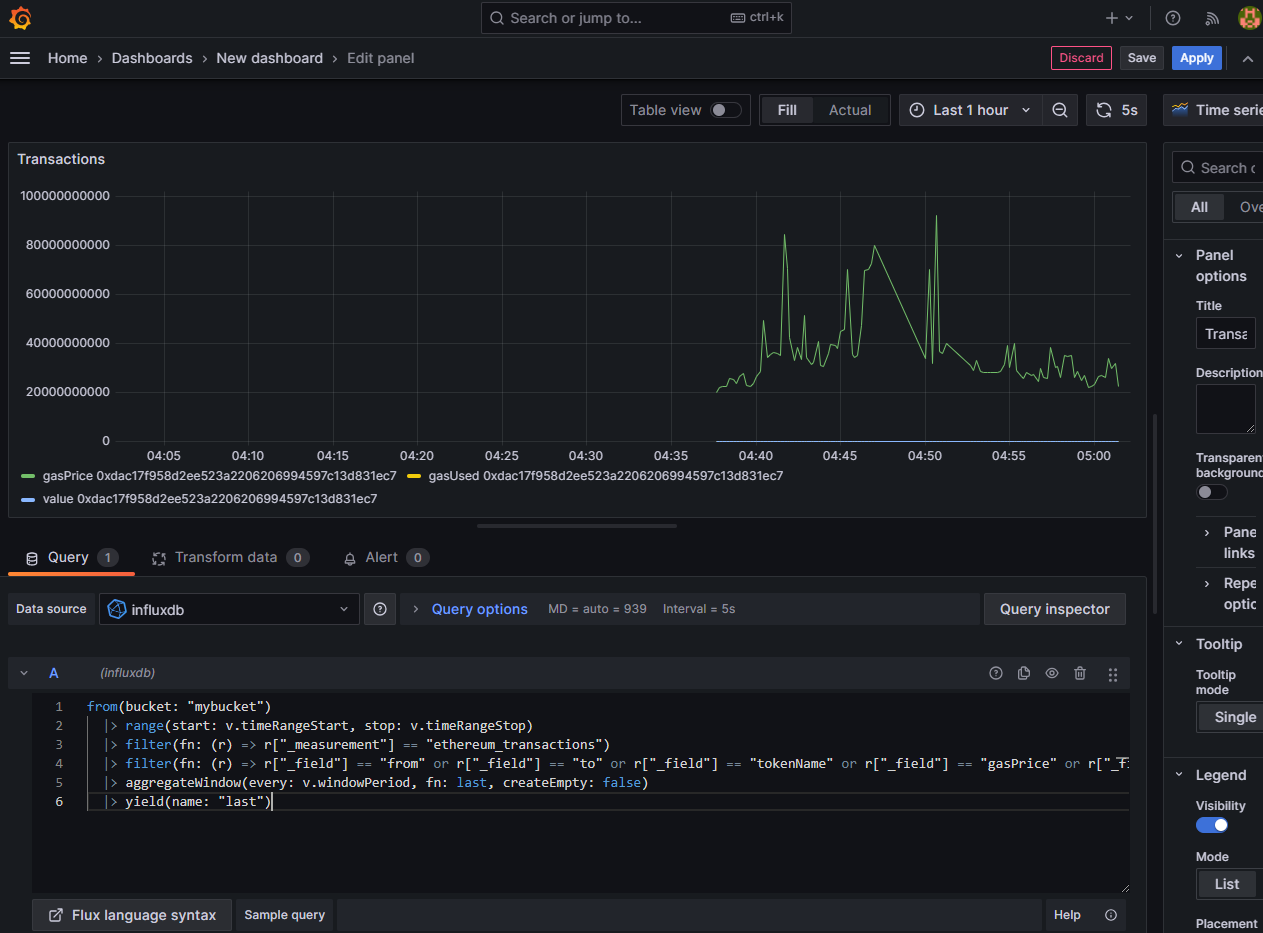
- Gas Consumption Table: Monitor gas usage in transactions.
from(bucket: "mybucket")
|> range(start: v.timeRangeStart, stop: v.timeRangeStop)
|> filter(fn: (r) => r["_measurement"] == "ethereum_transactions")
|> filter(fn: (r) => r["_field"] == "from" or r["_field"] == "to" or r["_field"] == "tokenName" or r["_field"] == "gasPrice" or r["_field"] == "gasUsed" or r["_field" == "value")
|> aggregateWindow(every: v.windowPeriod, fn: last, createEmpty: false)
|> yield(name: "last")
Your contributions are welcome!
This project is released under the MIT License.

