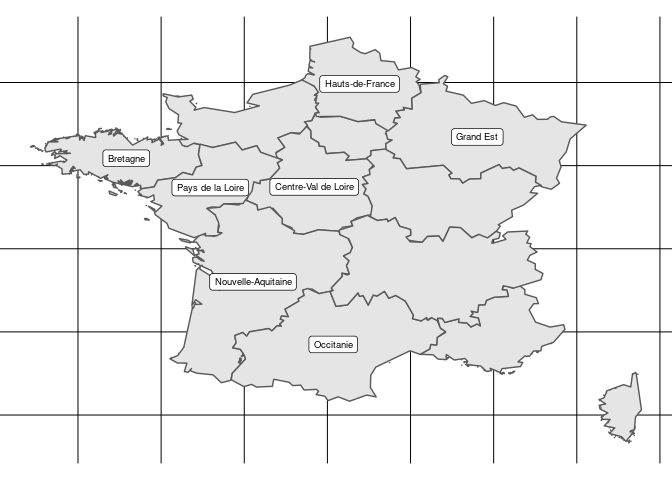
The goal of cartofr is to provides a set of data to plot French administrative system
You can install the released version of cartofr from Github with:
remotes::install_github("denrou", "cartofr")To get data from the package, just use:
data("cartofr")cartofr is a list of 4 datasets in a sf format (links provide the
source of the
dataset):
- country The external border of France.
- region The name and code of French regions.
- dept The name and code of French departments.
- insee The name and code of French towns.
This package doesn’t provide any plot functions, but since objects are
sf, it is pretty straigtforward to plot them either using ggplot2 or
leaflet.
# Using ggplot2
library(ggplot2)
library(sf)
#> Linking to GEOS 3.6.1, GDAL 2.3.2, PROJ 4.9.3
ggplot() +
  geom_sf(data = cartofr[["region"]]) +
  geom_sf_label(aes(label = name_fr), data = suppressWarnings(st_centroid(cartofr[["region"]])), size = 2.5) +
  theme_void()
#> Warning: Removed 6 rows containing missing values (geom_label).
# Using leaflet
library(leaflet)
cartofr[["dept"]] %>%
leaflet() %>%
addProviderTiles("CartoDB.Positron") %>%
addPolygons(label = ~name_fr, color = "gray", opacity = 1, fillOpacity = 0, weight = 2)