This repository implements an online (web-server) data view utility, for presenting the data acquired with the ETHZ TCT Setup. This utility is closely linked to the ETHZ TCT Control framework. It was developed as part of the PhD thesis work of Johannes Wüthrich. The corresponding PhD thesis will be linked here in the future.
- The web-server is implemented in a single python file (
browser.py) as a flask application.- The
SyncCacheclass implements a synchronization between multiple server instance, to automatically re-trigger the loading of the dataset metadata if requested by one of the instances. - The backend interface is implemented REST-like.
- The
- The template views are stored under
templates/(one per page). - The user interface is primarily implemented in Javascript (
stage/js/) making use of JQuery.
The server is implemented using Flask in the browser.py file.
It can thus be run with any common way of launching a Flask server.
A convinent way is to run the server in multiple instances using gunicorn.
To do so, the wsgi.py file is provided.
To run a single instance of the server for testing, the run_dev.sh script can be used.
In the root directory of this repository, a config file named sources.conf needs to be created.
Each line of this file specifies a directory, where scan data can be found (acquired with the TCT Control Framework).
If for example, a scan was acquired with the following command line:
python -m util.scan -D /mnt/storage/tct-data/ [CONFIG-FILE]
the path /mnt/storage/tct-data/ should be placed in the sources.conf file, so that the TCT scan data can be found by the online interface.
An example config file is provided in examples/sources.conf.
The home page links to three different views:
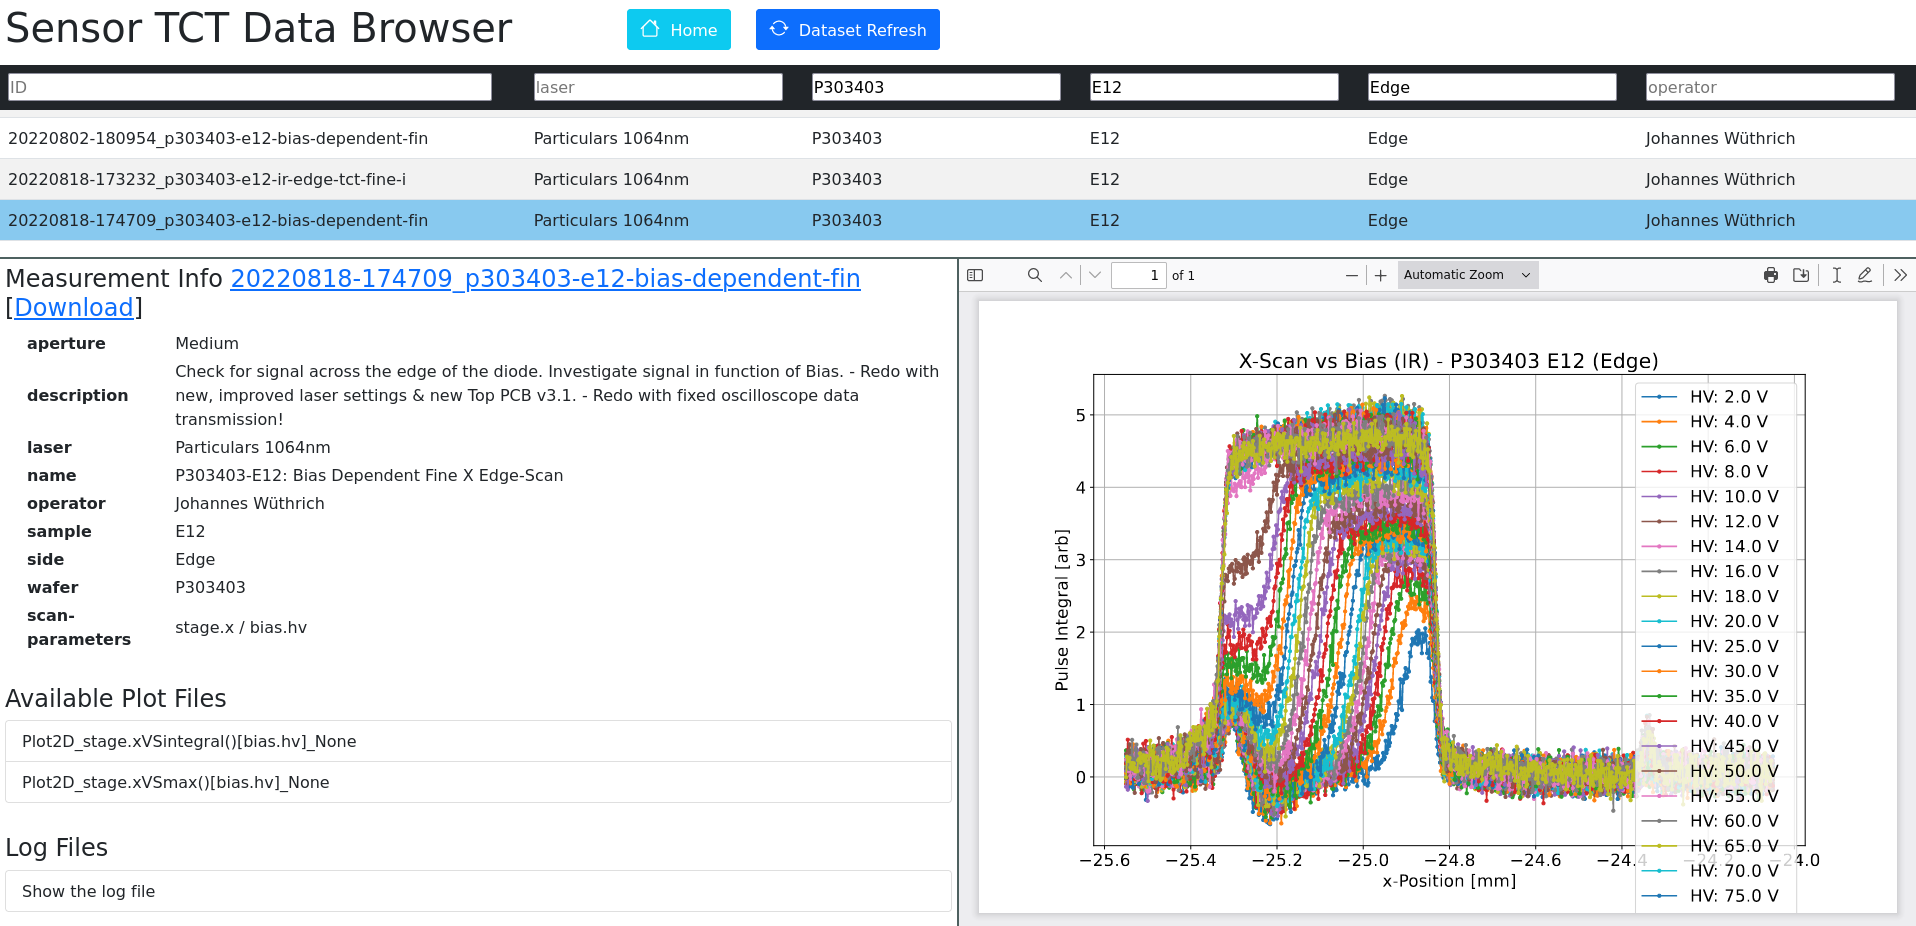
A view of the data overview pages is given here:
On the data overview page, a list of all acquired datasets can be found in a table, allowing to filter for certain meta properties. When selecting a dataset the full metadata, the list of online analysis plots and the config of the selected scan is shown. The online analysis plots can directly be viewed in the browser.
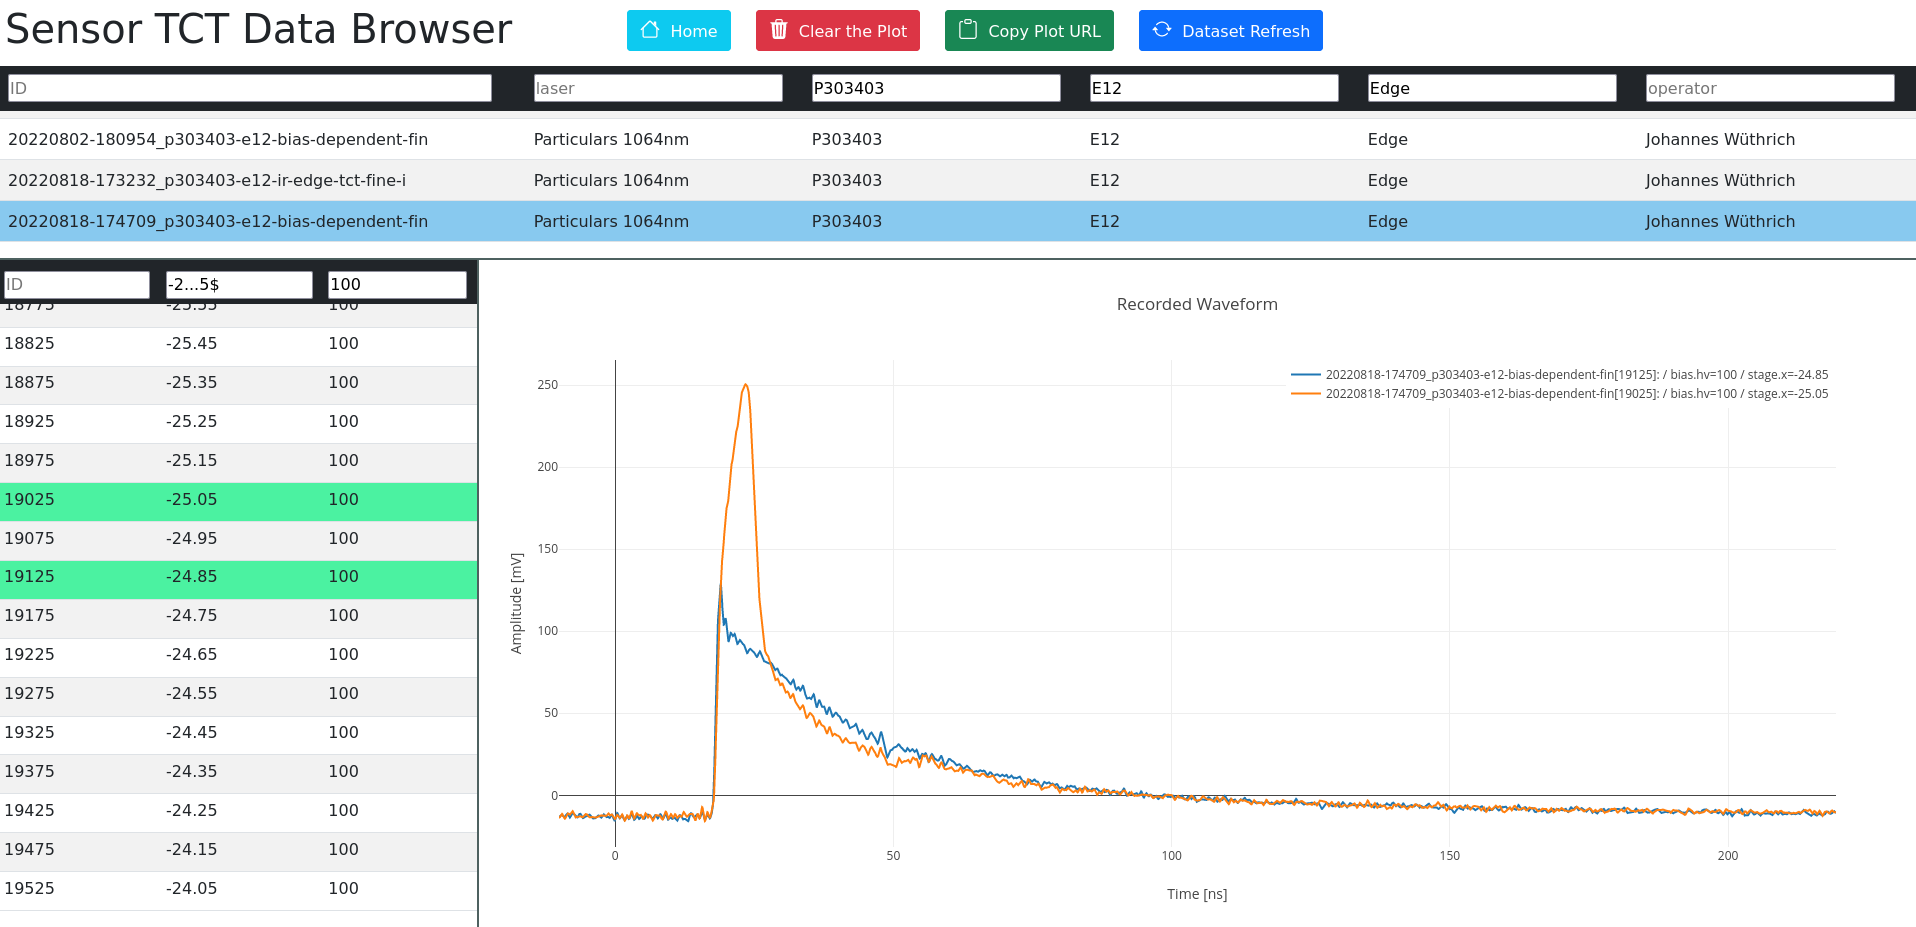
The time domain data browser allows to visualize the acquired time domain data signals. Signal acquired via different scans can be compared. A view of this page is shown below:
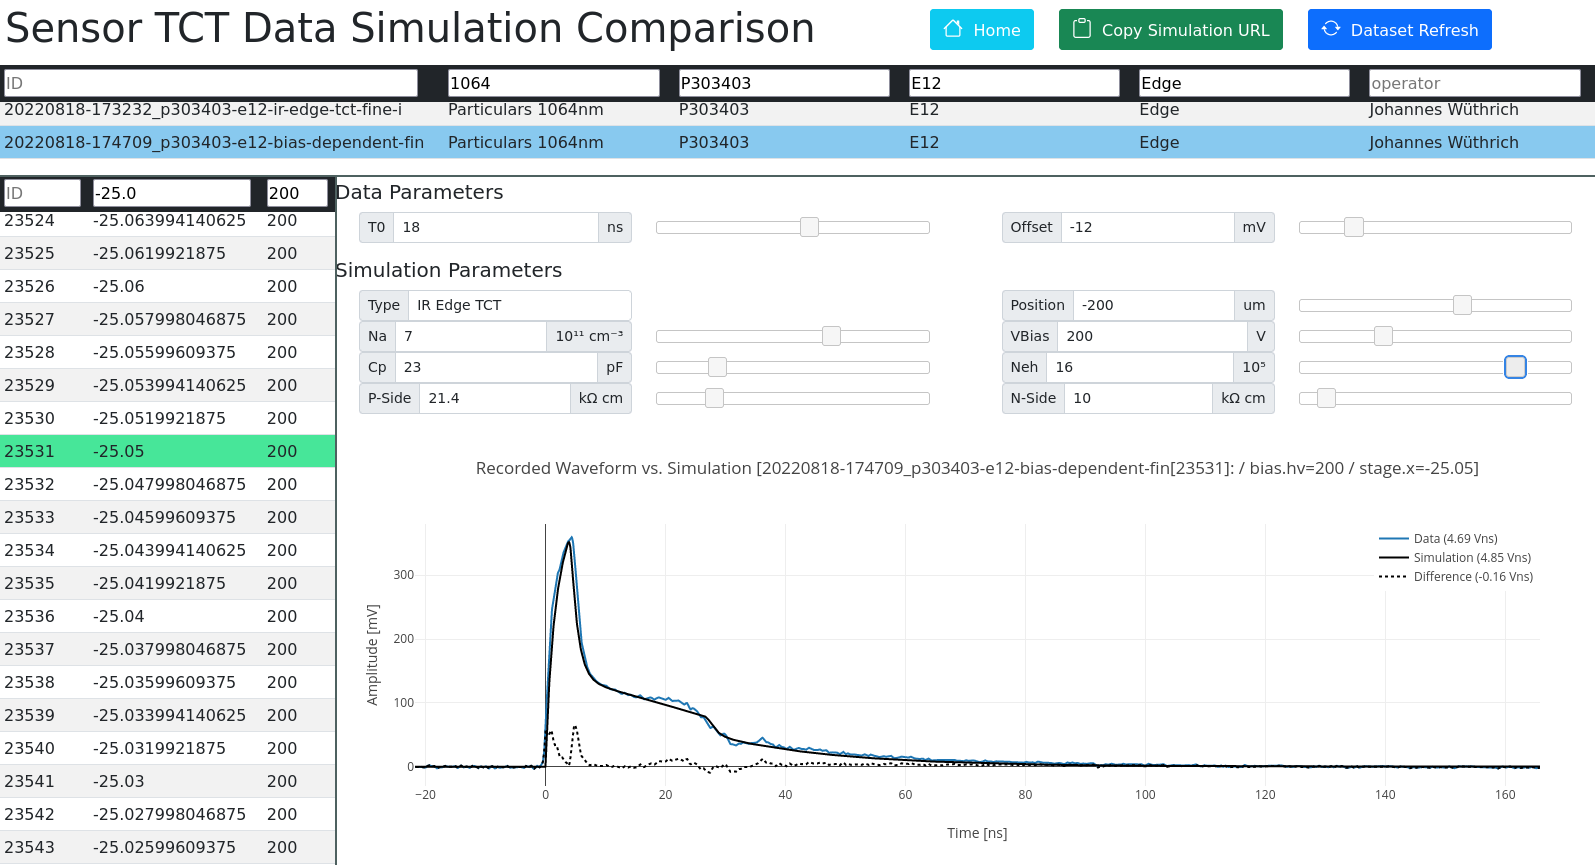
The interface view allows to compare a selected time domain waveform with the predicted waveform based on the simple simulation model incorporating the extended Shockley-Ramo theorem. This view is closely linked to the data acquired with the bonded diode samples, presented in the PhD thesis. The simulation is fully parameteric and the parameters can be changed on the fly. A view of this interface is shown below:
As the online interface is heavily based on the ETHZ TCT Control framework, the requirements for the mentioned framework also apply here. The web-server itself is implemented with Flask.
The following additional python packages are necessary:
- flask
- gunicorn
The online interface makes use of the bootstrap framework and the bootstrap-icons collection.
Both of these are contained within the repository under static/.
The analysis module (folder) of the ETHZ TCT Control framework needs to be made available via a symlink.
In this repository, the included symlink points to analysis -> ../Sensor-TCT/analysis, but the exact source location of the TCT Control Framework is not important.
The symlink can be created via:
ln -sf [PATH-TO-TCT-CONTROL-FRAMEWORK]/analysis ./analysis


