Derek Corcoran 2022-01-07
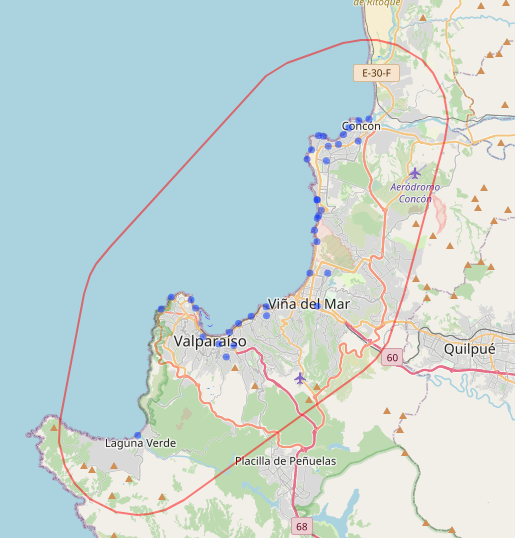
In this repository, the goal is to generate rasters with the proportion of cells of different landuse within a certain distance of each point, for the polygon showed in figure 1.1:

Figure 1.1: Study site with the sampled points and the polygon corresponding to a 5050 meter buffer of all the points
For that we used the databased generated in (Zhao et al. 2016), and used
both the raster and terra packages to create the layers (Hijmans 2021a,
2021b), using the TerrCapasCovertura.R script
From the sampling point,
| Distance | bosque_nativo | cultivos | grava | oceano | pastizales | matorrales | sup_impermeables | suelo_arenoso | plantacion_de_arboles |
|---|---|---|---|---|---|---|---|---|---|
| 600 | 0 | 1 | 1 | 51 | 3 | 8 | 31 | 1 | 3 |
| 2200 | 0 | 1 | 1 | 59 | 3 | 10 | 21 | 1 | 2 |
| 4400 | 0 | 1 | 1 | 59 | 3 | 10 | 21 | 1 | 2 |
Hijmans, Robert J. 2021a. Raster: Geographic Data Analysis and Modeling. https://CRAN.R-project.org/package=raster.
———. 2021b. Terra: Spatial Data Analysis. https://CRAN.R-project.org/package=terra.
Zhao, Yuanyuan, Duole Feng, Le Yu, Xiaoyi Wang, Yanlei Chen, Yuqi Bai, H Jaime Hernández, et al. 2016. “Detailed Dynamic Land Cover Mapping of Chile: Accuracy Improvement by Integrating Multi-Temporal Data.” Remote Sensing of Environment 183: 170–85.
