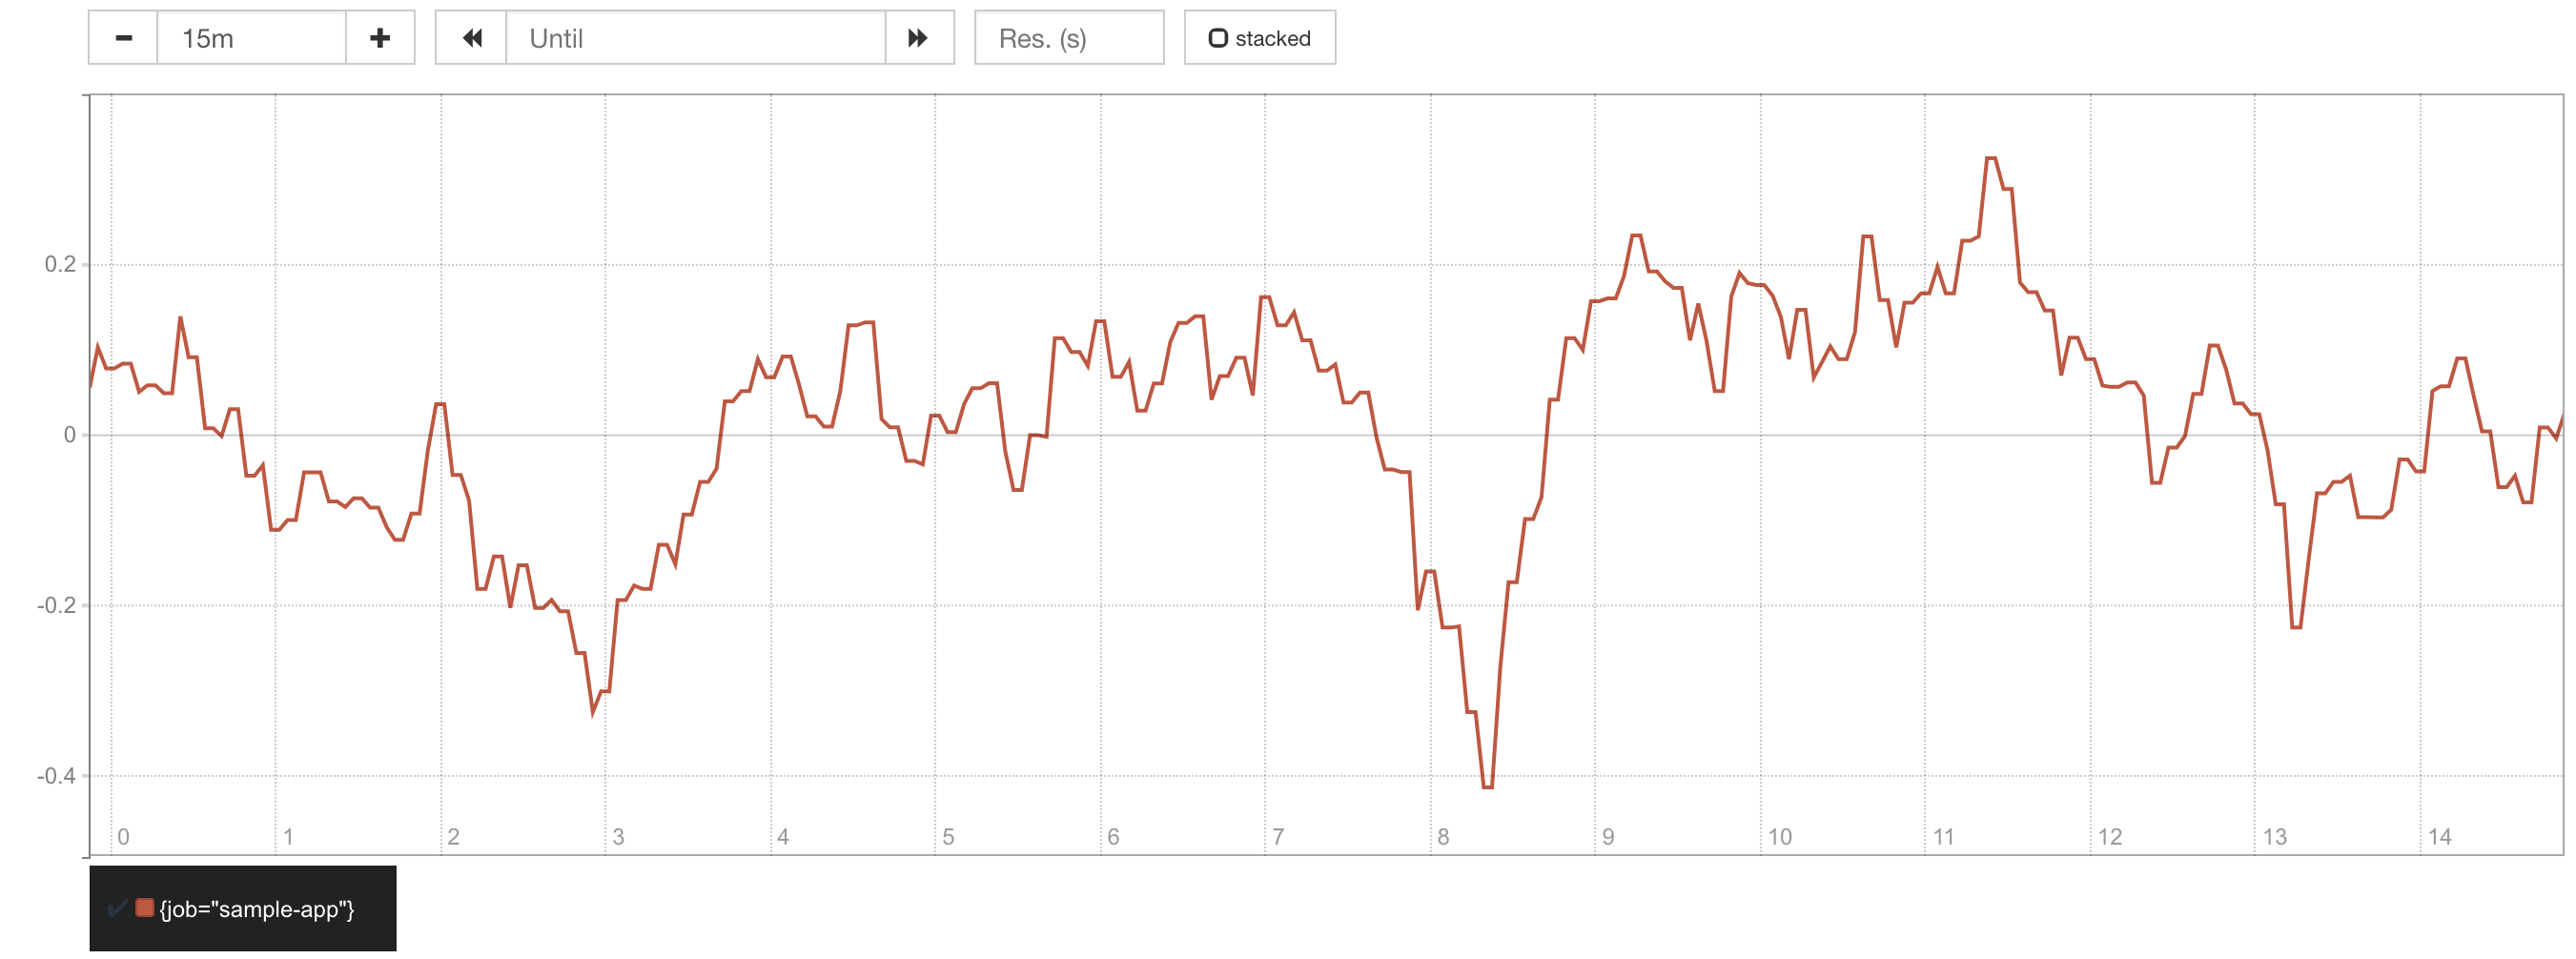
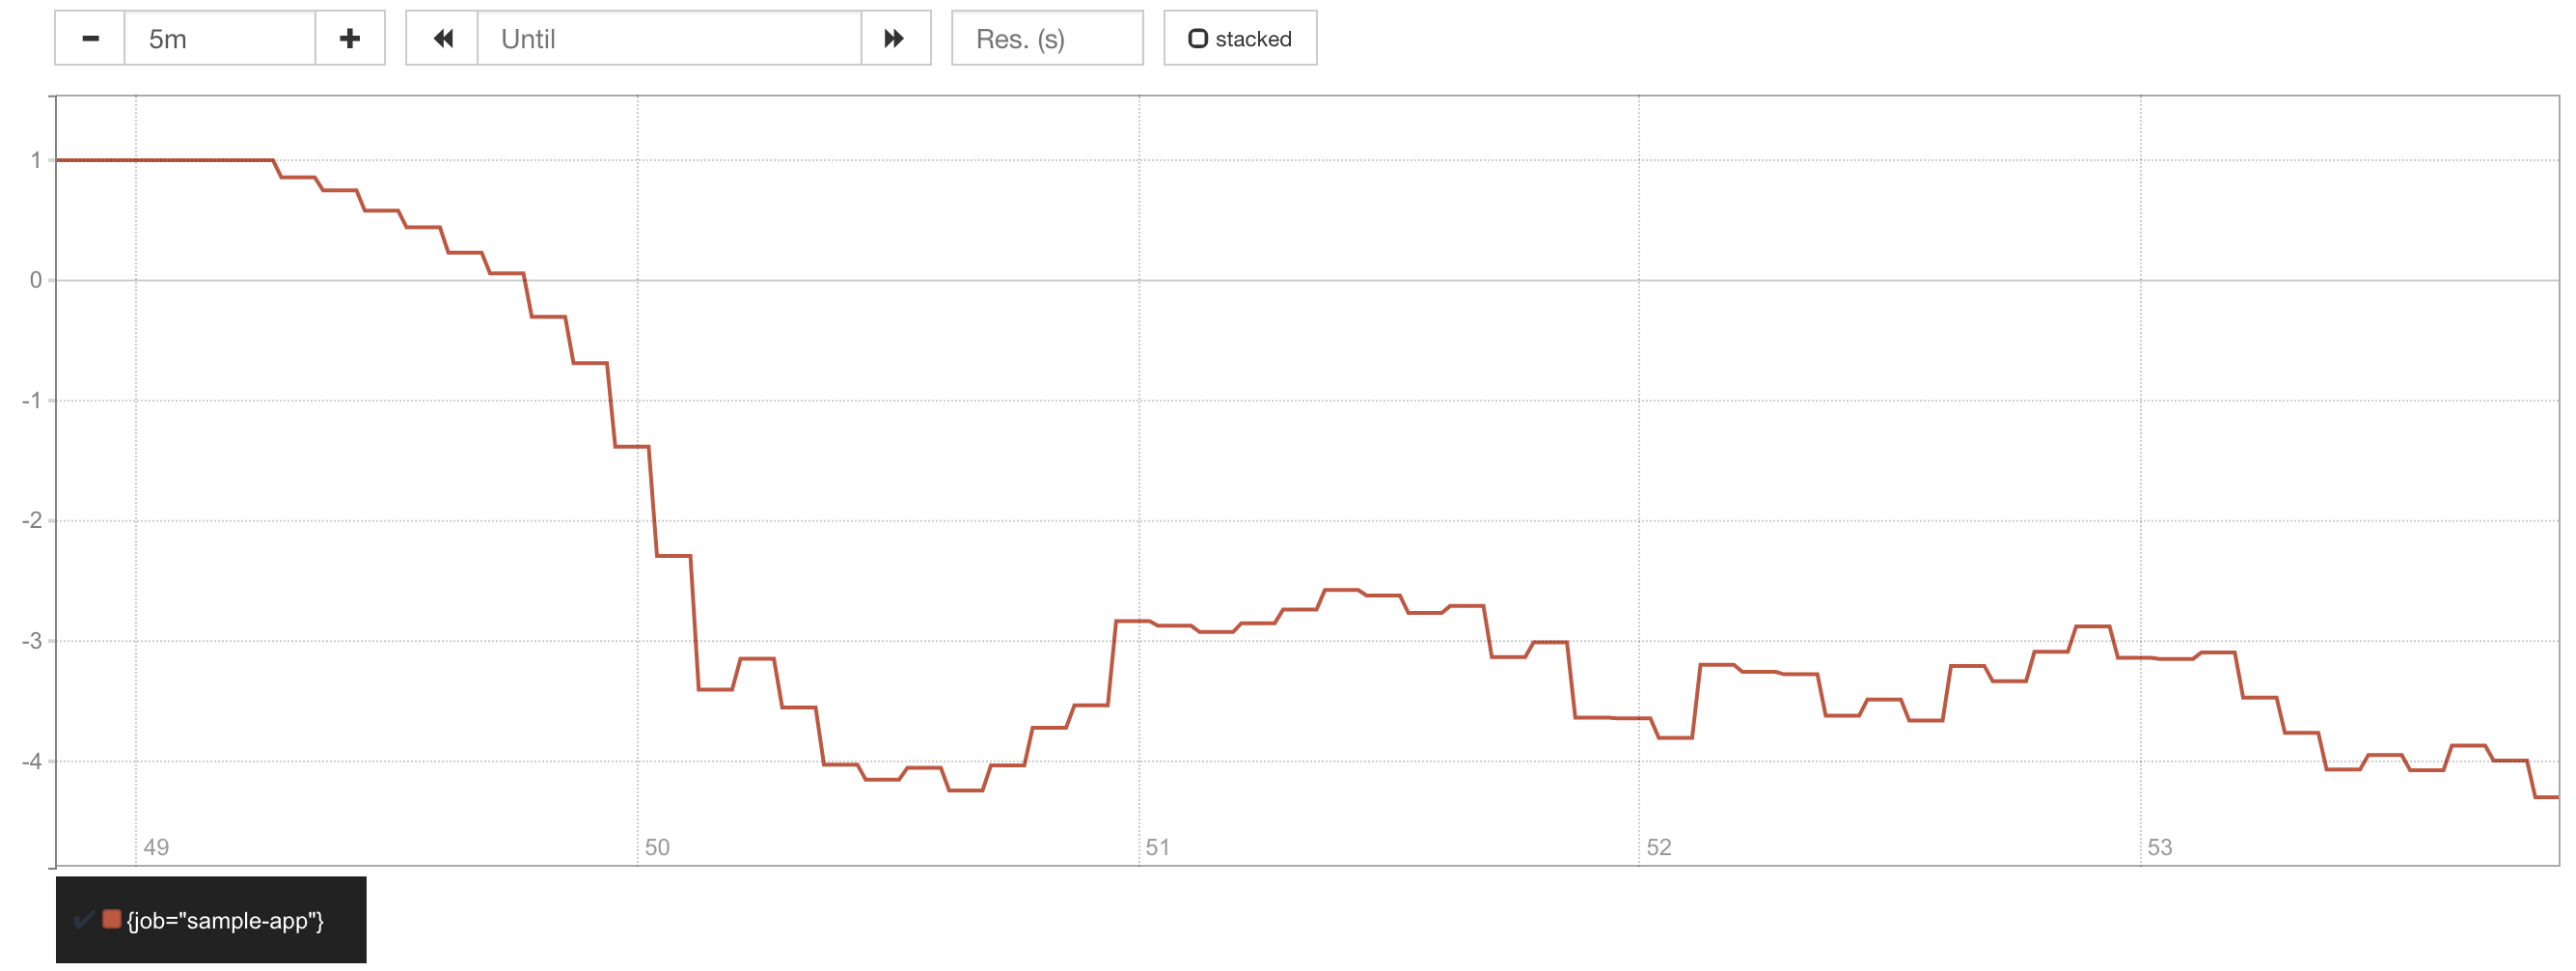
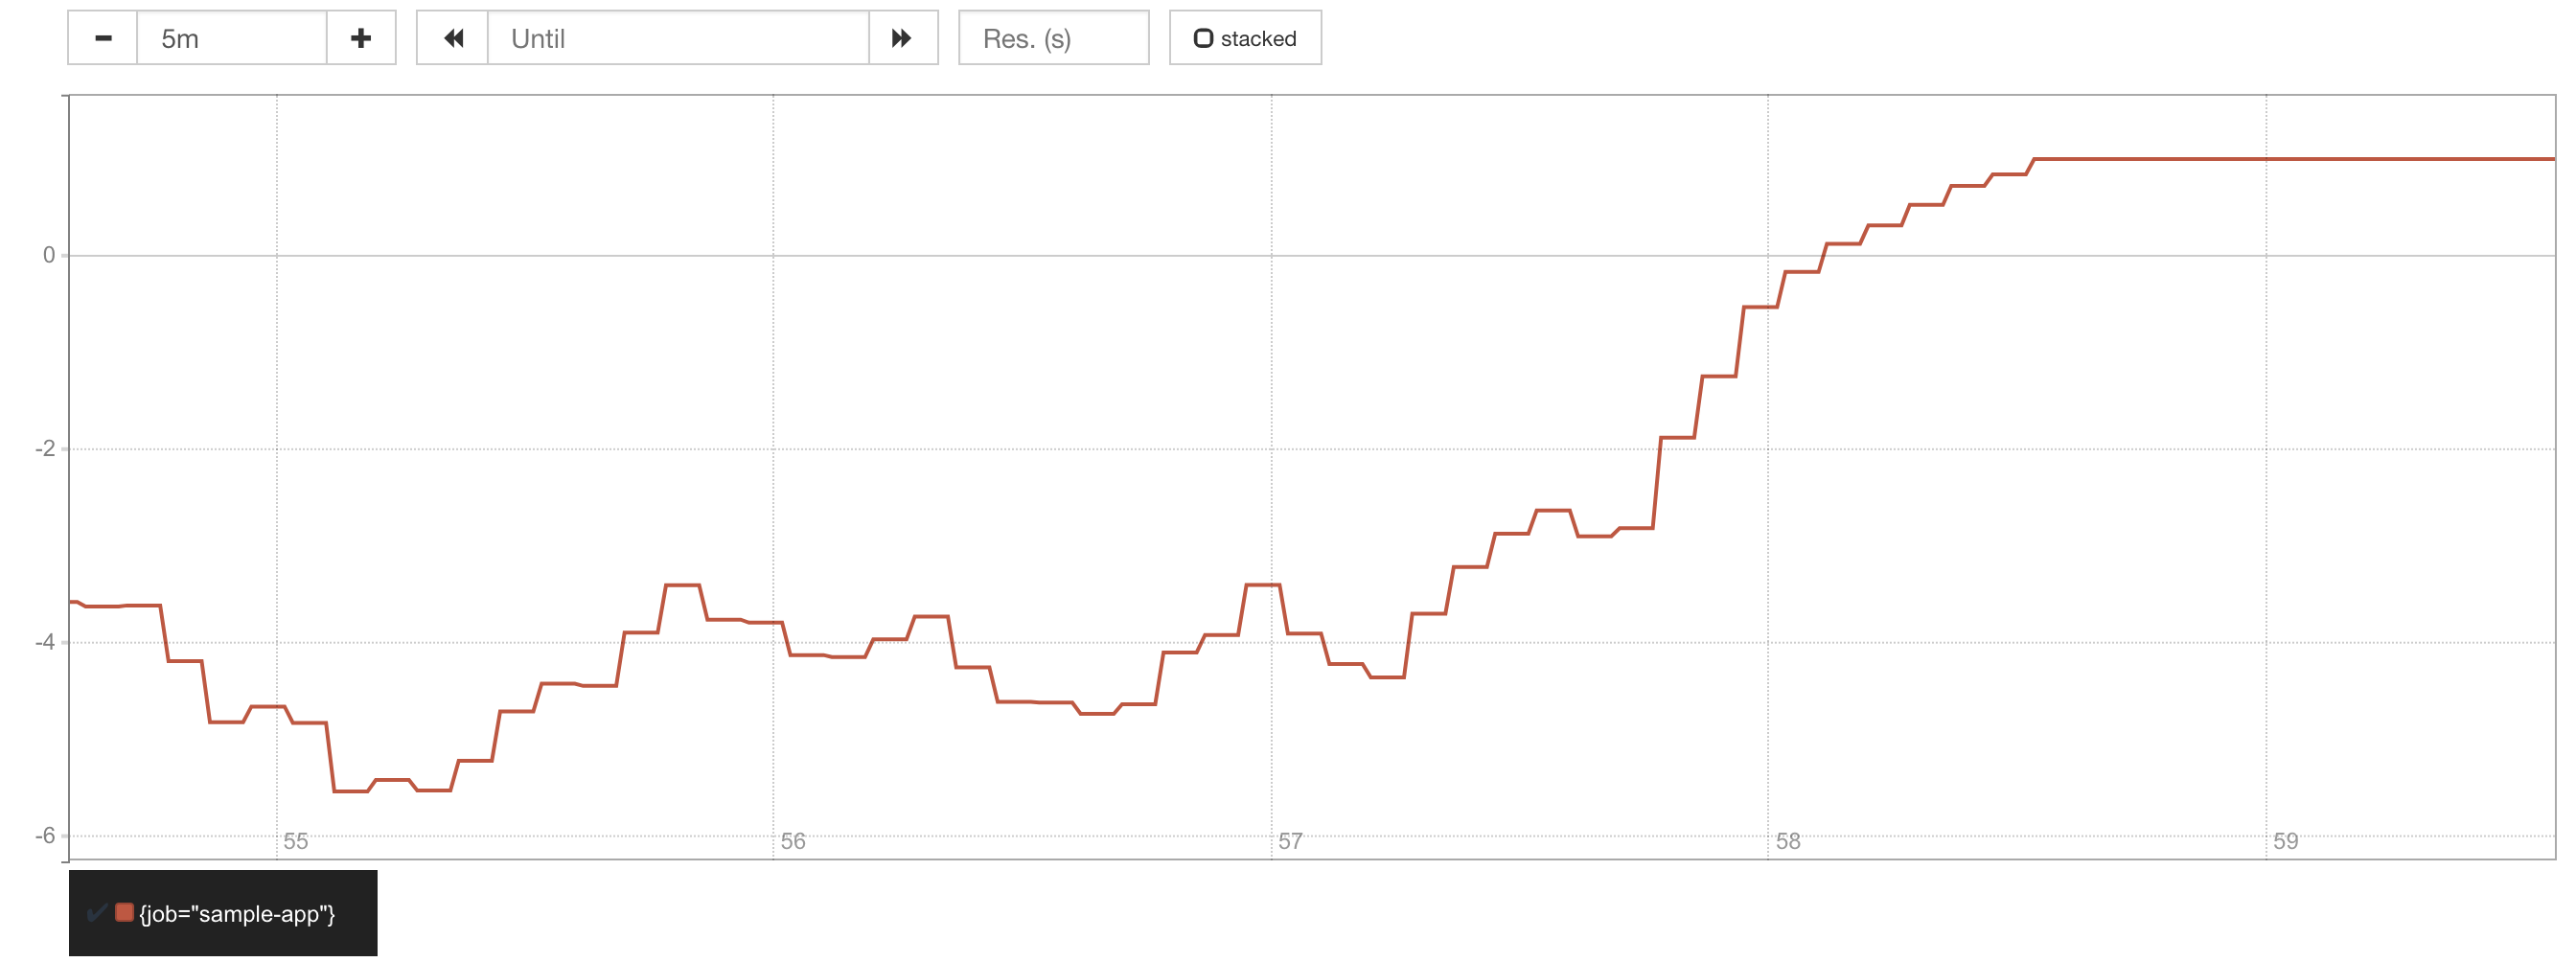
This is an introductory tutorial I created for telling the software developers in my company the basics about Prometheus.
If you have any suggestion to improve this content, don't hesitate to contact me. Pull Requests are welcome!
This tutorial follows a more practical approach (with hopefully just the right amount of theory!), so we provide a simple Docker Compose configuration for simplifying the project bootstrap.
- Docker + Docker Compose
Run the following command to start everything up:
$ docker-compose up -d- Alertmanager: http://localhost:9093
- Grafana: http://localhost:3000 (user/password:
admin) - Prometheus: http://localhost:9090
- Sample Node.js Application: http://localhost:4000
Run the following command to stop all running containers from this project:
$ docker-compose rm -fsPrometheus is an open source monitoring and time-series database (TSDB) designed after Borgmon, the monitoring tool created internally at Google for collecting metrics from jobs running in their cluster orchestration platform, Borg.
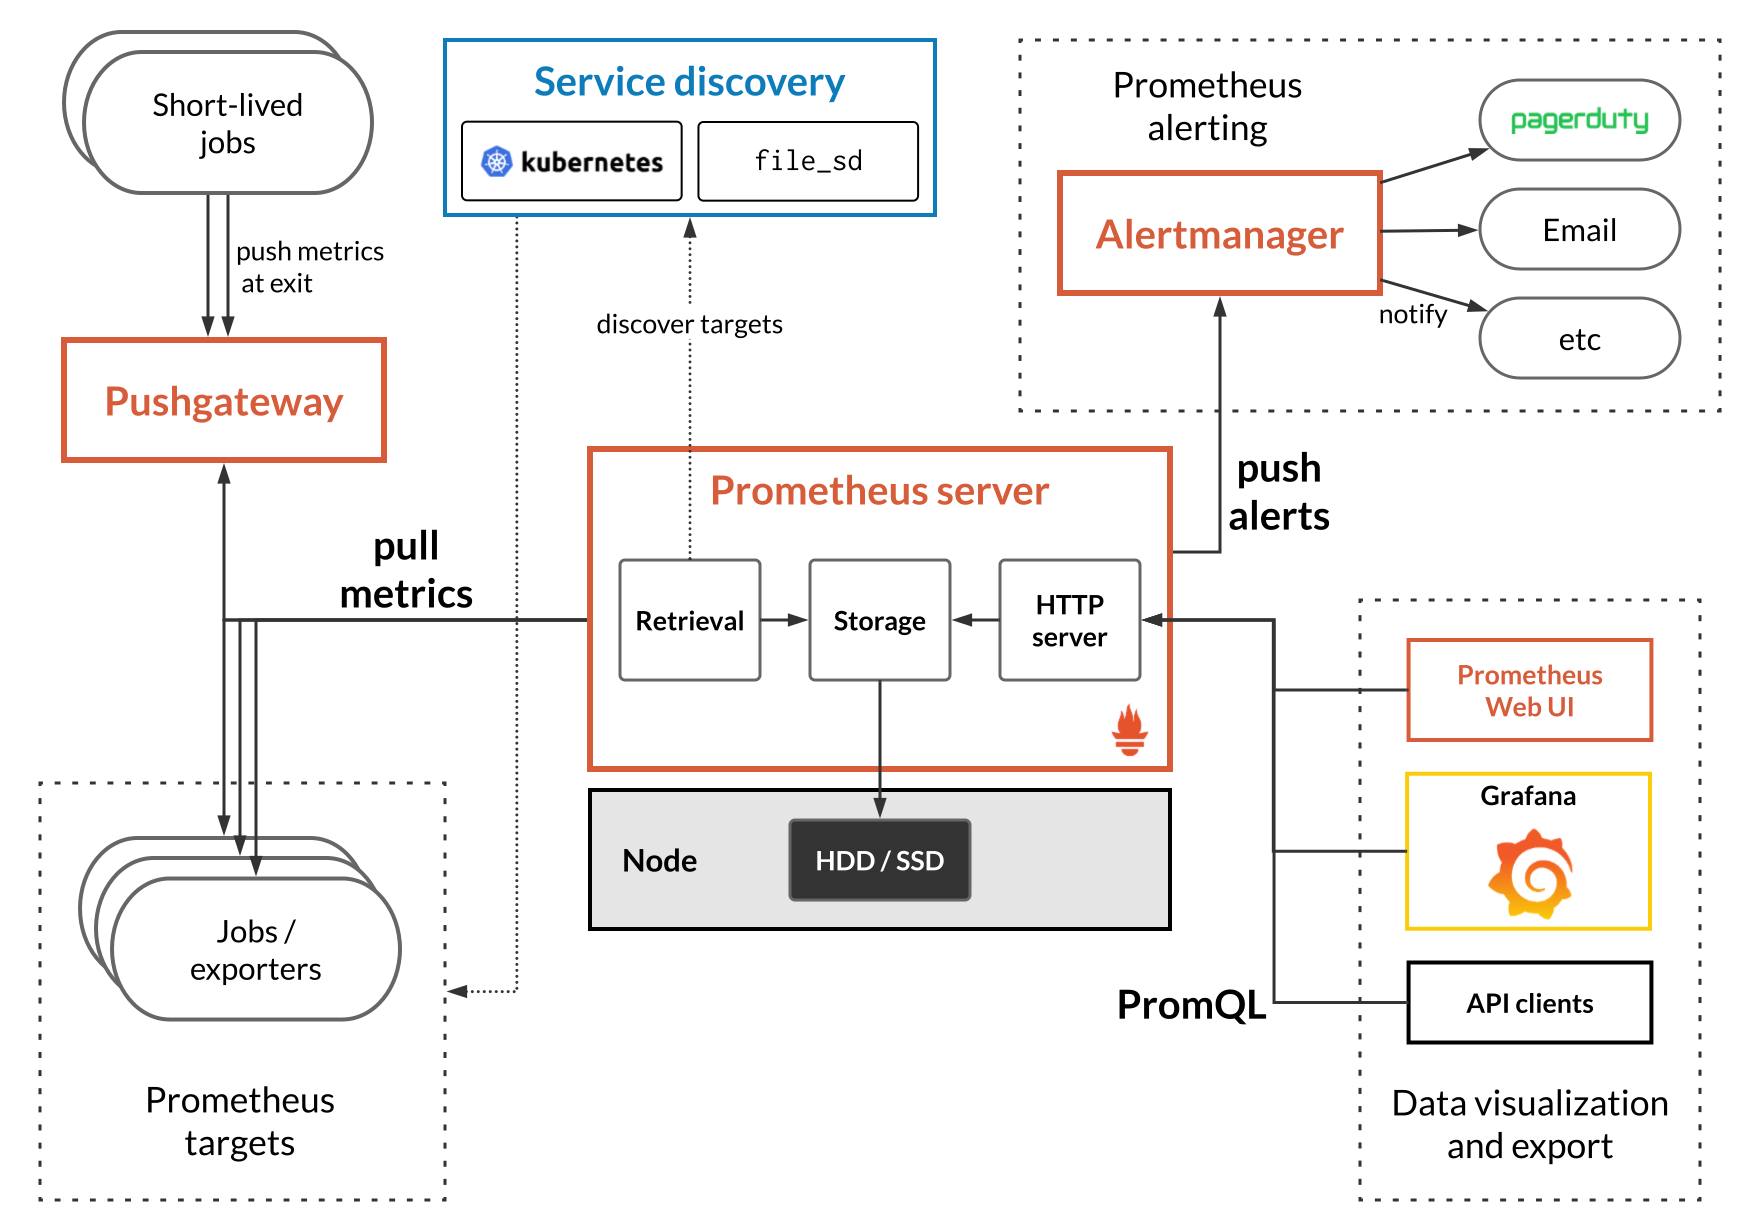
The following image shows an overview of the Prometheus architecture.
In the center we have a Prometheus server, which is the component responsible for periodically collecting and storing metrics from various targets (e.g. the services you want to collect metrics from).
The list of targets can be statically defined in the Prometheus configuration file, or we can use other means to automatically discover those targets via Service discovery. For instance, if you want to monitor a service that's deployed in EC2 instances in AWS, you can configure Prometheus to use the AWS EC2 API to discover which instances are running a particular service and then scrape metrics from those servers; this is preferred over statically listing the IP addresses for our application in the Prometheus configuration file, which will eventually get out of sync, especially in a dynamic environment such as a public cloud provider.
Prometheus also provides a basic Web UI for running queries on the stored data, as well as integrations with popular visualization tools, such as Grafana.
Previously, we mentioned that the Prometheus server scrapes (or pulls) metrics from our target applications.
This means Prometheus took a different approach than other "traditional" monitoring tools, such as StatsD, in which applications push metrics to the metrics server or aggregator, instead of having the metrics server pulling metrics from applications.
The consequence of this design is a better separation of concerns; when the application pushes metrics to a metrics server or aggregator, it has to make decisions like: where to push the metrics to; how often to push the metrics; should the application aggregate/consolidate any metrics before pushing them; among other things.
In pull-based monitoring systems like Prometheus, these decisions go away; for instance, we no longer have to re-deploy our applications if we want to change the metrics resolution (how many data points collected per minute) or the monitoring server endpoint (we can architect the monitoring system in a way completely transparent to application developers).
Want to know more? The Prometheus documentation provides a comparison with other tools in the monitoring space regarding scope, data model, and storage.
Now, if the application doesn't push metrics to the metrics server, how does the applications metrics end up in Prometheus?
Applications expose metrics to Prometheus via a metrics endpoint. To see how
this works, let's start everything by running docker-compose up -d if you
haven't already.
Visit http://localhost:3000 to open Grafana and log in with the default
admin user and password. Then, click on the top link "Home" and select the
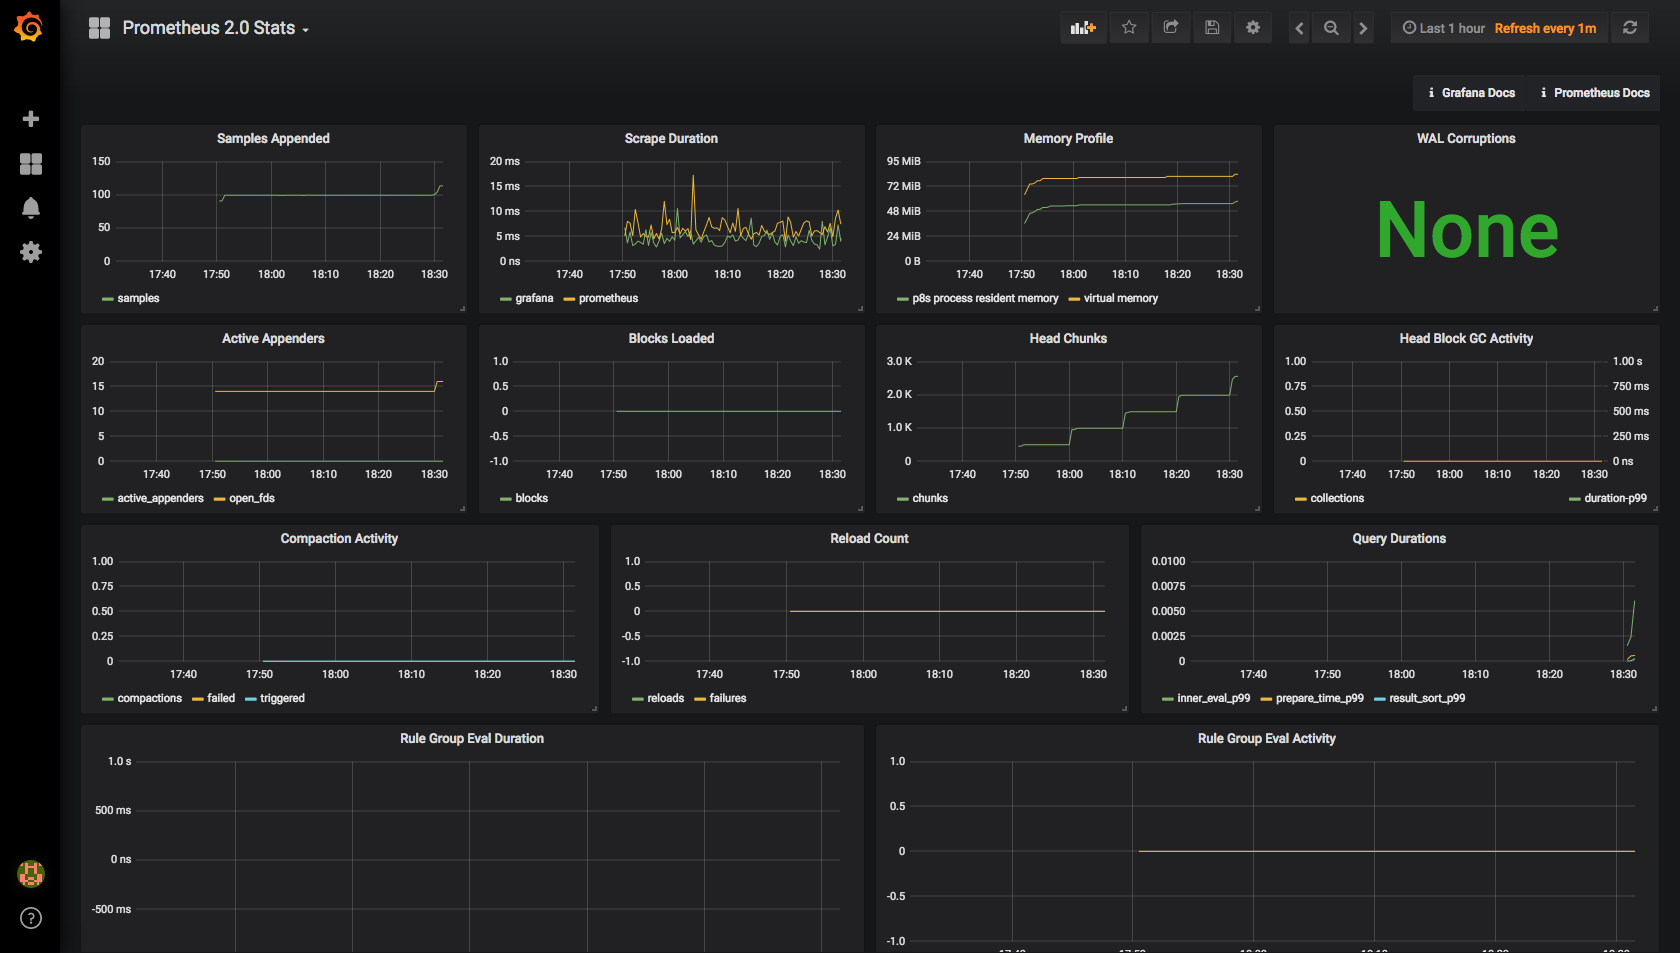
"Prometheus 2.0 Stats" dashboard.
Yes, Prometheus is scraping metrics from itself!
Let's pause for a moment to understand what happened. First, Grafana is already configured with a Prometheus data source that points to the local Prometheus server. This is how Grafana is able to display data from Prometheus. Also, if you look at the Prometheus configuration file, you can see that we listed Prometheus itself as a target.
# config/prometheus/prometheus.yml

# Simple scrape configuration for each service
scrape_configs:
  - job_name: prometheus
    static_configs:
      - targets:
          - localhost:9090
By default, Prometheus gets metrics via the /metrics endpoint in each target,
so if you hit http://localhost:9090/metrics, you should see something like
this:
# HELP go_gc_duration_seconds A summary of the GC invocation durations.
# TYPE go_gc_duration_seconds summary
go_gc_duration_seconds{quantile="0"} 5.95e-05
go_gc_duration_seconds{quantile="0.25"} 0.0001589
go_gc_duration_seconds{quantile="0.5"} 0.0002188
go_gc_duration_seconds{quantile="0.75"} 0.0004158
go_gc_duration_seconds{quantile="1"} 0.0090565
go_gc_duration_seconds_sum 0.0331214
go_gc_duration_seconds_count 47
# HELP go_goroutines Number of goroutines that currently exist.
# TYPE go_goroutines gauge
go_goroutines 39
# HELP go_info Information about the Go environment.
# TYPE go_info gauge
go_info{version="go1.10.3"} 1
# HELP go_memstats_alloc_bytes Number of bytes allocated and still in use.
# TYPE go_memstats_alloc_bytes gauge
go_memstats_alloc_bytes 3.7429992e+07
# HELP go_memstats_alloc_bytes_total Total number of bytes allocated, even if freed.
# TYPE go_memstats_alloc_bytes_total counter
go_memstats_alloc_bytes_total 1.37005104e+08
...
In this snippet alone we can notice a few interesting things:
- Each metric has a user friendly description that explains its purpose
- Each metric may define additional dimensions, also known as labels. For
instance, the metric
go_infohas aversionlabel- Every time series is uniquely identified by its metric name and the set of label-value pairs
- Each metric is defined as a specific type, such as
summary,gauge,counter, andhistogram. More information on each data type can be found here
But how does this text-based response turns into data points in a time series database?
The best way to understand this is by running a few simple queries.
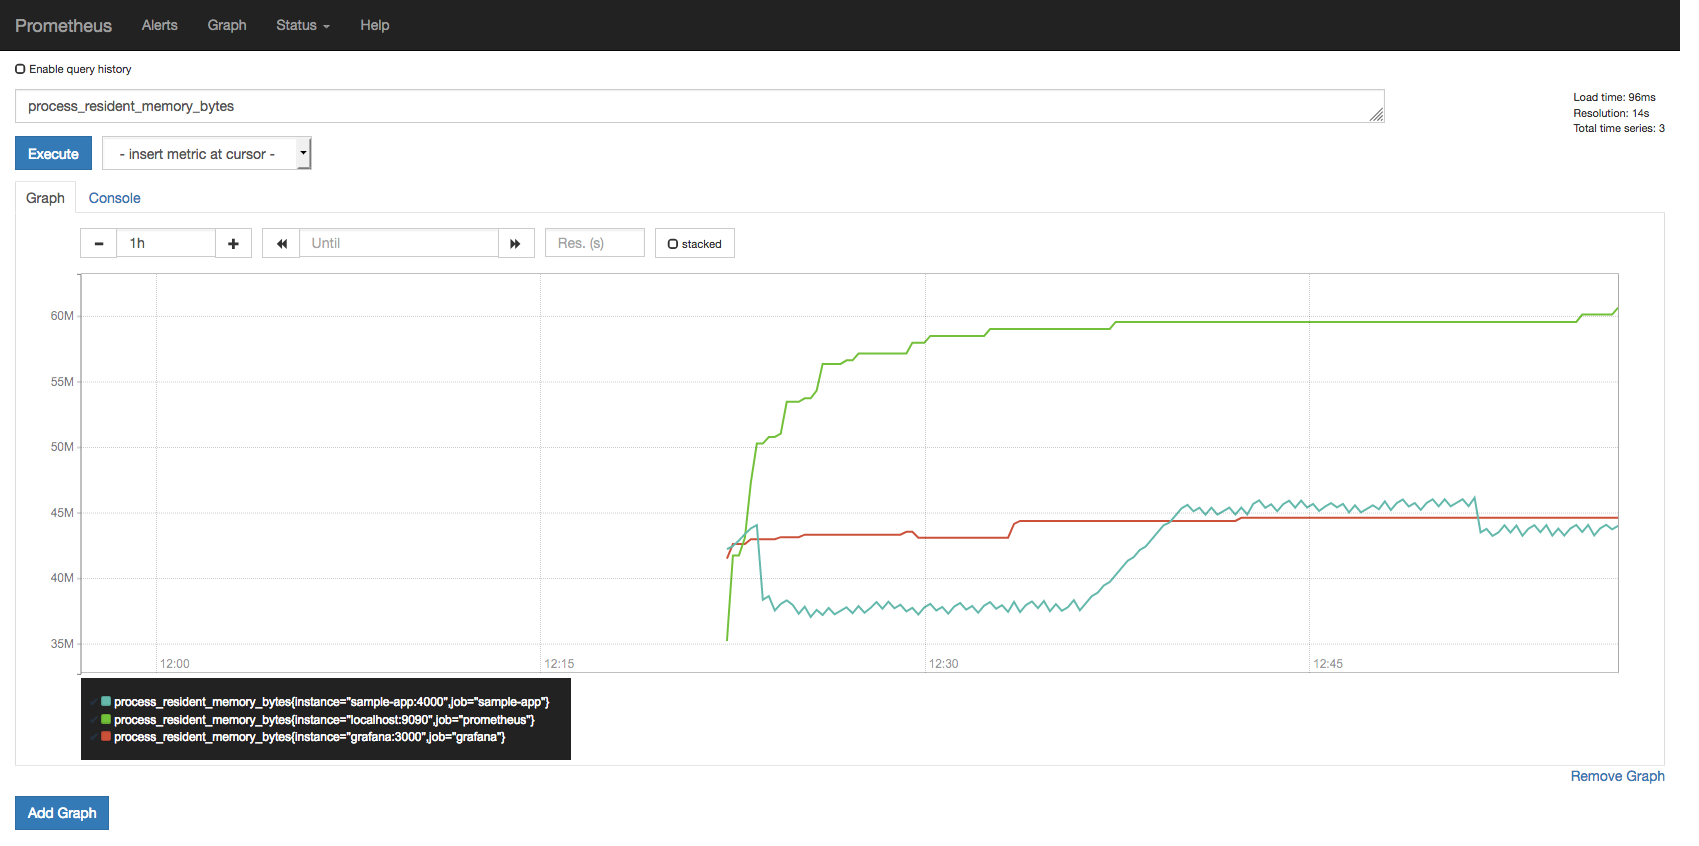
Open the Prometheus UI at http://localhost:9090/graph, type
process_resident_memory_bytes in the text field and hit Execute.
You can use the graph controls to zoom into a specific region.
This first query is very simple as it only plots the value of the
process_resident_memory_bytes gauge as time passes, and as you might
have guessed, that query displays the resident memory usage for each target,
in bytes.
Since our setup uses a 5-second scrape interval, Prometheus will hit the
/metrics endpoint of our targets every 5 seconds to fetch the current
metrics and store those data points sequentially, indexed by timestamp.
# In prometheus.yml
global:
  scrape_interval: 5s
You can see the all samples from that metric in the past minute by querying
process_resident_memory_bytes{job="grafana"}[1m] (select Console in the
Prometheus UI):
| Element | Value |
|---|---|
process_resident_memory_bytes{instance="grafana:3000",job="grafana"} |
40861696@1530461477.44643298816@1530461482.44743778048@1530461487.45144785664@1530461492.44744785664@1530461497.44745043712@1530461502.44845043712@1530461507.4445301760@1530461512.45145301760@1530461517.44845301760@1530461522.44845895680@1530461527.44845895680@1530461532.447 |
Queries that have an appended range duration in square brackets after
the metric name (i.e. <metric>[<duration>]) returns what is called a
range vector, in which <duration> specify how far back in time
values should be fetched for each resulting range vector element.
In this example, the value for the process_resident_memory_bytes
metric at the timestamp 1530461477.446 was 40861696, and so on.
If you inspect the contents of the /metrics endpoint at all our targets,
you'll see that multiple targets export metrics under the same name.
But isn't this a problem? If we are exporting metrics under the same name, how can we be sure we are not mixing metrics between different applications into the same time series data?
Consider the previous metric, process_resident_memory_bytes: Grafana,
Prometheus, and our sample application all export a gauge metric under the
same name. However, did you notice in the previous plot that somehow we were
able to get a separate time series from each application?
Quoting the documentation:
In Prometheus terms, an endpoint you can scrape is called an instance, usually corresponding to a single process. A collection of instances with the same purpose, a process replicated for scalability or reliability for example, is called a job.
When Prometheus scrapes a target, it attaches some labels automatically to the scraped time series which serve to identify the scraped target:
job- The configured job name that the target belongs to.instance- The<host>:<port>part of the target's URL that was scraped.
Since our configuration has three different targets (with one instance each) exposing this metric, we can see three lines in that plot.
For each instance scrape, Prometheus stores a up metric with the value 1
when the instance is healthy, i.e. reachable, or 0 if the scrape failed.
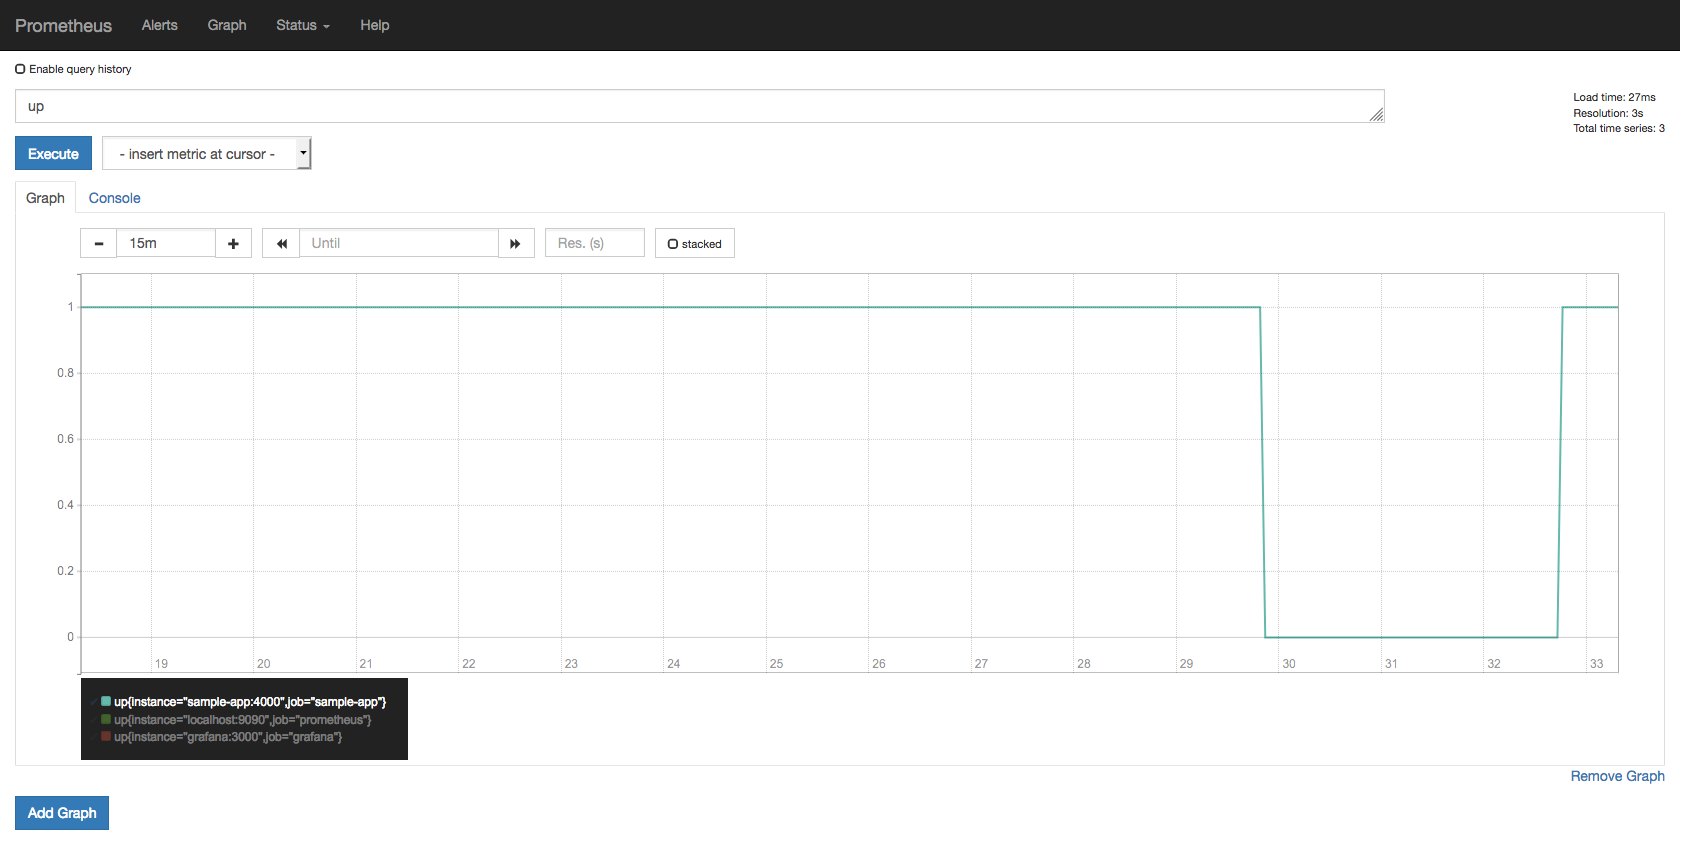
Try plotting the query up in the Prometheus UI.
If you followed every instruction up until this point, you'll notice that so far all targets were reachable at all times.
Let's change that. Run docker-compose stop sample-app and after a few
seconds you should see the up metric reporting our sample application
is down.
Now run docker-compose restart sample-app and the up metric should
report the application is back up again.
Want to know more? The Prometheus query UI provides a combo box with all
available metric names registered in its database. Do some exploring, try
querying different ones. For instance, can you plot the file descriptor
handles usage (in %) for all targets? Tip: the metric names end with
_fds.
We don't want to keep staring at dashboards in a big TV screen all day to be able to quickly detect issues in our applications, after all, we have better things to do with our time, right?
Luckily, Prometheus provides a facility for defining alerting rules that, when triggered, will notify Alertmanager, which is the component that takes care of deduplicating, grouping, and routing them to the correct receiver integration (i.e. email, Slack, PagerDuty, OpsGenie). It also takes care of silencing and inhibition of alerts.
Configuring Alertmanager to send metrics to PagerDuty, or Slack, or whatever, is out of the scope of this tutorial, but we can still play around with alerts.
We already have the following alerting rule defined in
config/prometheus/prometheus.rules.yml:
groups:
  - name: uptime
    rules:
      # Uptime alerting rule
      # Ref: https://prometheus.io/docs/prometheus/latest/configuration/alerting_rules/
      - alert: ServerDown
        expr: up == 0
        for: 1m
        labels:
          severity: page
        annotations:
          summary: One or more targets are down
          description: Instance {{ $labels.instance }} of {{ $labels.job }} is down
Each alerting rule in Prometheus is also a time series, so in this case you can
query ALERTS{alertname="ServerDown"} to see the state of that alert at any
point in time; this metric will not return any data points now because so far
no alerts have been triggered.
Let's change that. Run docker-compose stop grafana to kill Grafana. After a
few seconds you should see the ServerDown alert transition to a yellow state,
or PENDING.
The alert will stay as PENDING for one minute, which is the threshold we
configured in our alerting rule. After that, the alert will transition to a red
state, or FIRING.
After that point, the alert will show up in Alertmanager. Visit http://localhost:9093 to open the Alertmanager UI.
Let's restore Grafana. Run docker-compose restart grafana and the alert
should go back to a green state after a few seconds.
Let's examine a sample Node.js application we created for this tutorial.
Open the ./sample-app/index.js file in your favorite text editor. The
code is fully commented, so you should not have a hard time understanding
it.
We can measure request durations with percentiles or averages. It's not recommended relying on averages to track request durations because averages can be very misleading (see the References for a few posts on the pitfalls of averages and how percentiles can help). A better way for measuring durations is via percentiles as it tracks the user experience more closely:
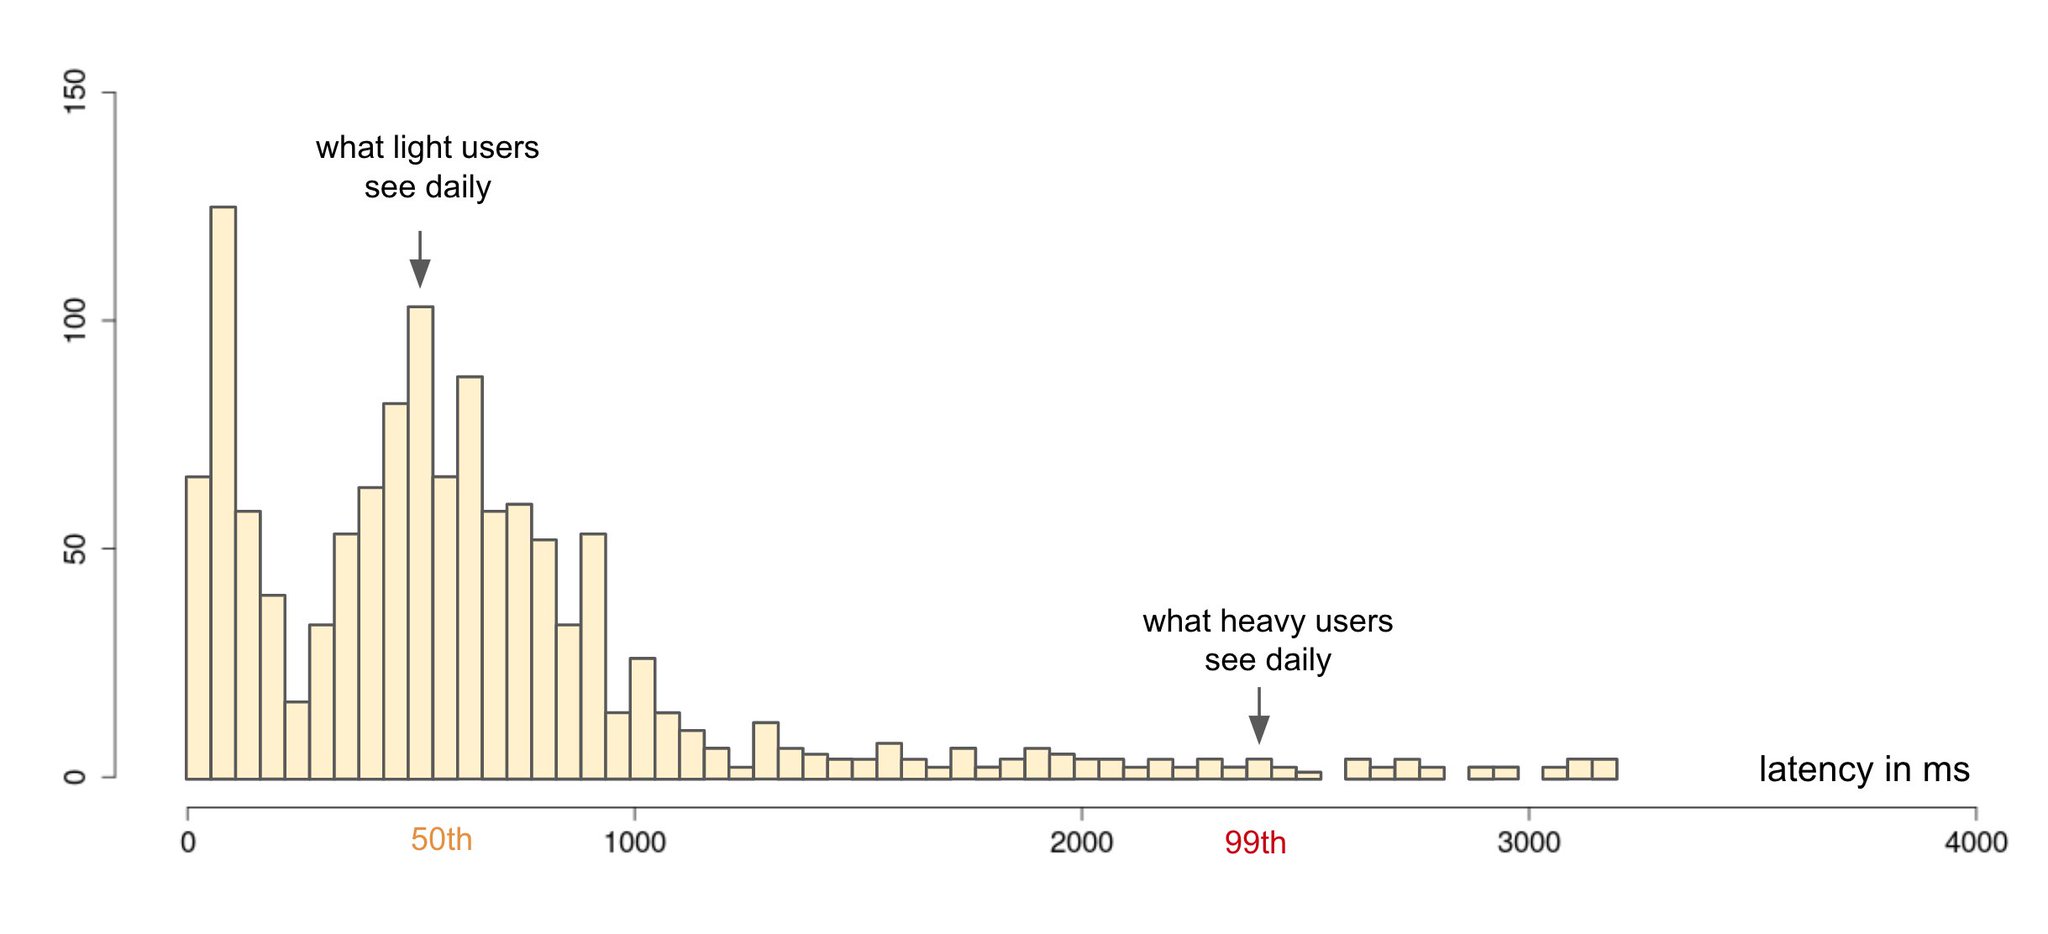 Source: Twitter
In Prometheus, we can generate percentiles with summaries or histograms.
To show the differences between these two, our sample application exposes two custom metrics for measuring request durations with, one via a summary and the other via a histogram:
// Summary metric for measuring request durations
const requestDurationSummary = new prometheusClient.Summary({
  // Metric name
  name: 'sample_app_summary_request_duration_seconds',

  // Metric description
  help: 'Summary of request durations',

  // Extra dimensions, or labels
  // HTTP method (GET, POST, etc), and status code (200, 500, etc)
  labelNames: ['method', 'status'],

  // 50th (median), 75th, 90th, 95th, and 99th percentiles
  percentiles: [0.5, 0.75, 0.9, 0,95, 0.99]
});

// Histogram metric for measuring request durations
const requestDurationHistogram = new prometheusClient.Histogram({
  // Metric name
  name: 'sample_app_histogram_request_duration_seconds',

  // Metric description
  help: 'Histogram of request durations',

  // Extra dimensions, or labels
  // HTTP method (GET, POST, etc), and status code (200, 500, etc)
  labelNames: ['method', 'status'],

  // Duration buckets, in seconds
  // 5ms, 10ms, 25ms, 50ms, 100ms, 250ms, 500ms, 1s, 2.5s, 5s, 10s
  buckets: [0.005, 0.01, 0.025, 0.05, 0.1, 0.25, 0.5, 1, 2.5, 5, 10]
});
As you can see, in a summary we specify the percentiles in which we want the Prometheus client to calculate and report latencies for, while in a histogram we specify the duration buckets in which the observed durations will be stored as a counter (i.e. a 300ms observation will be stored by incrementing the counter corresponding to the 250ms-500ms bucket).
Our sample application introduces a one-second delay in approximately 5% of requests, just so we can compare the average response time with 99th percentiles:
// Main route
app.get('/', async (req, res) => {
  // Simulate a 1s delay in ~5% of all requests
  if (Math.random() <= 0.05) {
    const sleep = (ms) => {
      return new Promise((resolve) => {
        setTimeout(resolve, ms);
      });
    };
    await sleep(1000);
  }
  res.set('Content-Type', 'text/plain');
  res.send('Hello, world!');
});
Let's put some load on this server to generate some metrics for us to play with:
$ docker run --rm -it --net host williamyeh/wrk -c 4 -t 2 -d 900  http://localhost:4000
Running 15m test @ http://localhost:4000
  2 threads and 4 connections
  Thread Stats   Avg      Stdev     Max   +/- Stdev
    Latency   269.03ms  334.46ms   1.20s    78.31%
    Req/Sec    85.61    135.58     1.28k    89.33%
  72170 requests in 15.00m, 14.94MB read
Requests/sec:     80.18
Transfer/sec:     16.99KB
Now run the following queries in the Prometheus UI:
# Average response time
rate(sample_app_summary_request_duration_seconds_sum[15s]) / rate(sample_app_summary_request_duration_seconds_count[15s])

# 99th percentile (via summary)
sample_app_summary_request_duration_seconds{quantile="0.99"}

# 99th percentile (via histogram)
histogram_quantile(0.99, sum(rate(sample_app_histogram_request_duration_seconds_bucket[15s])) by (le, method, status))
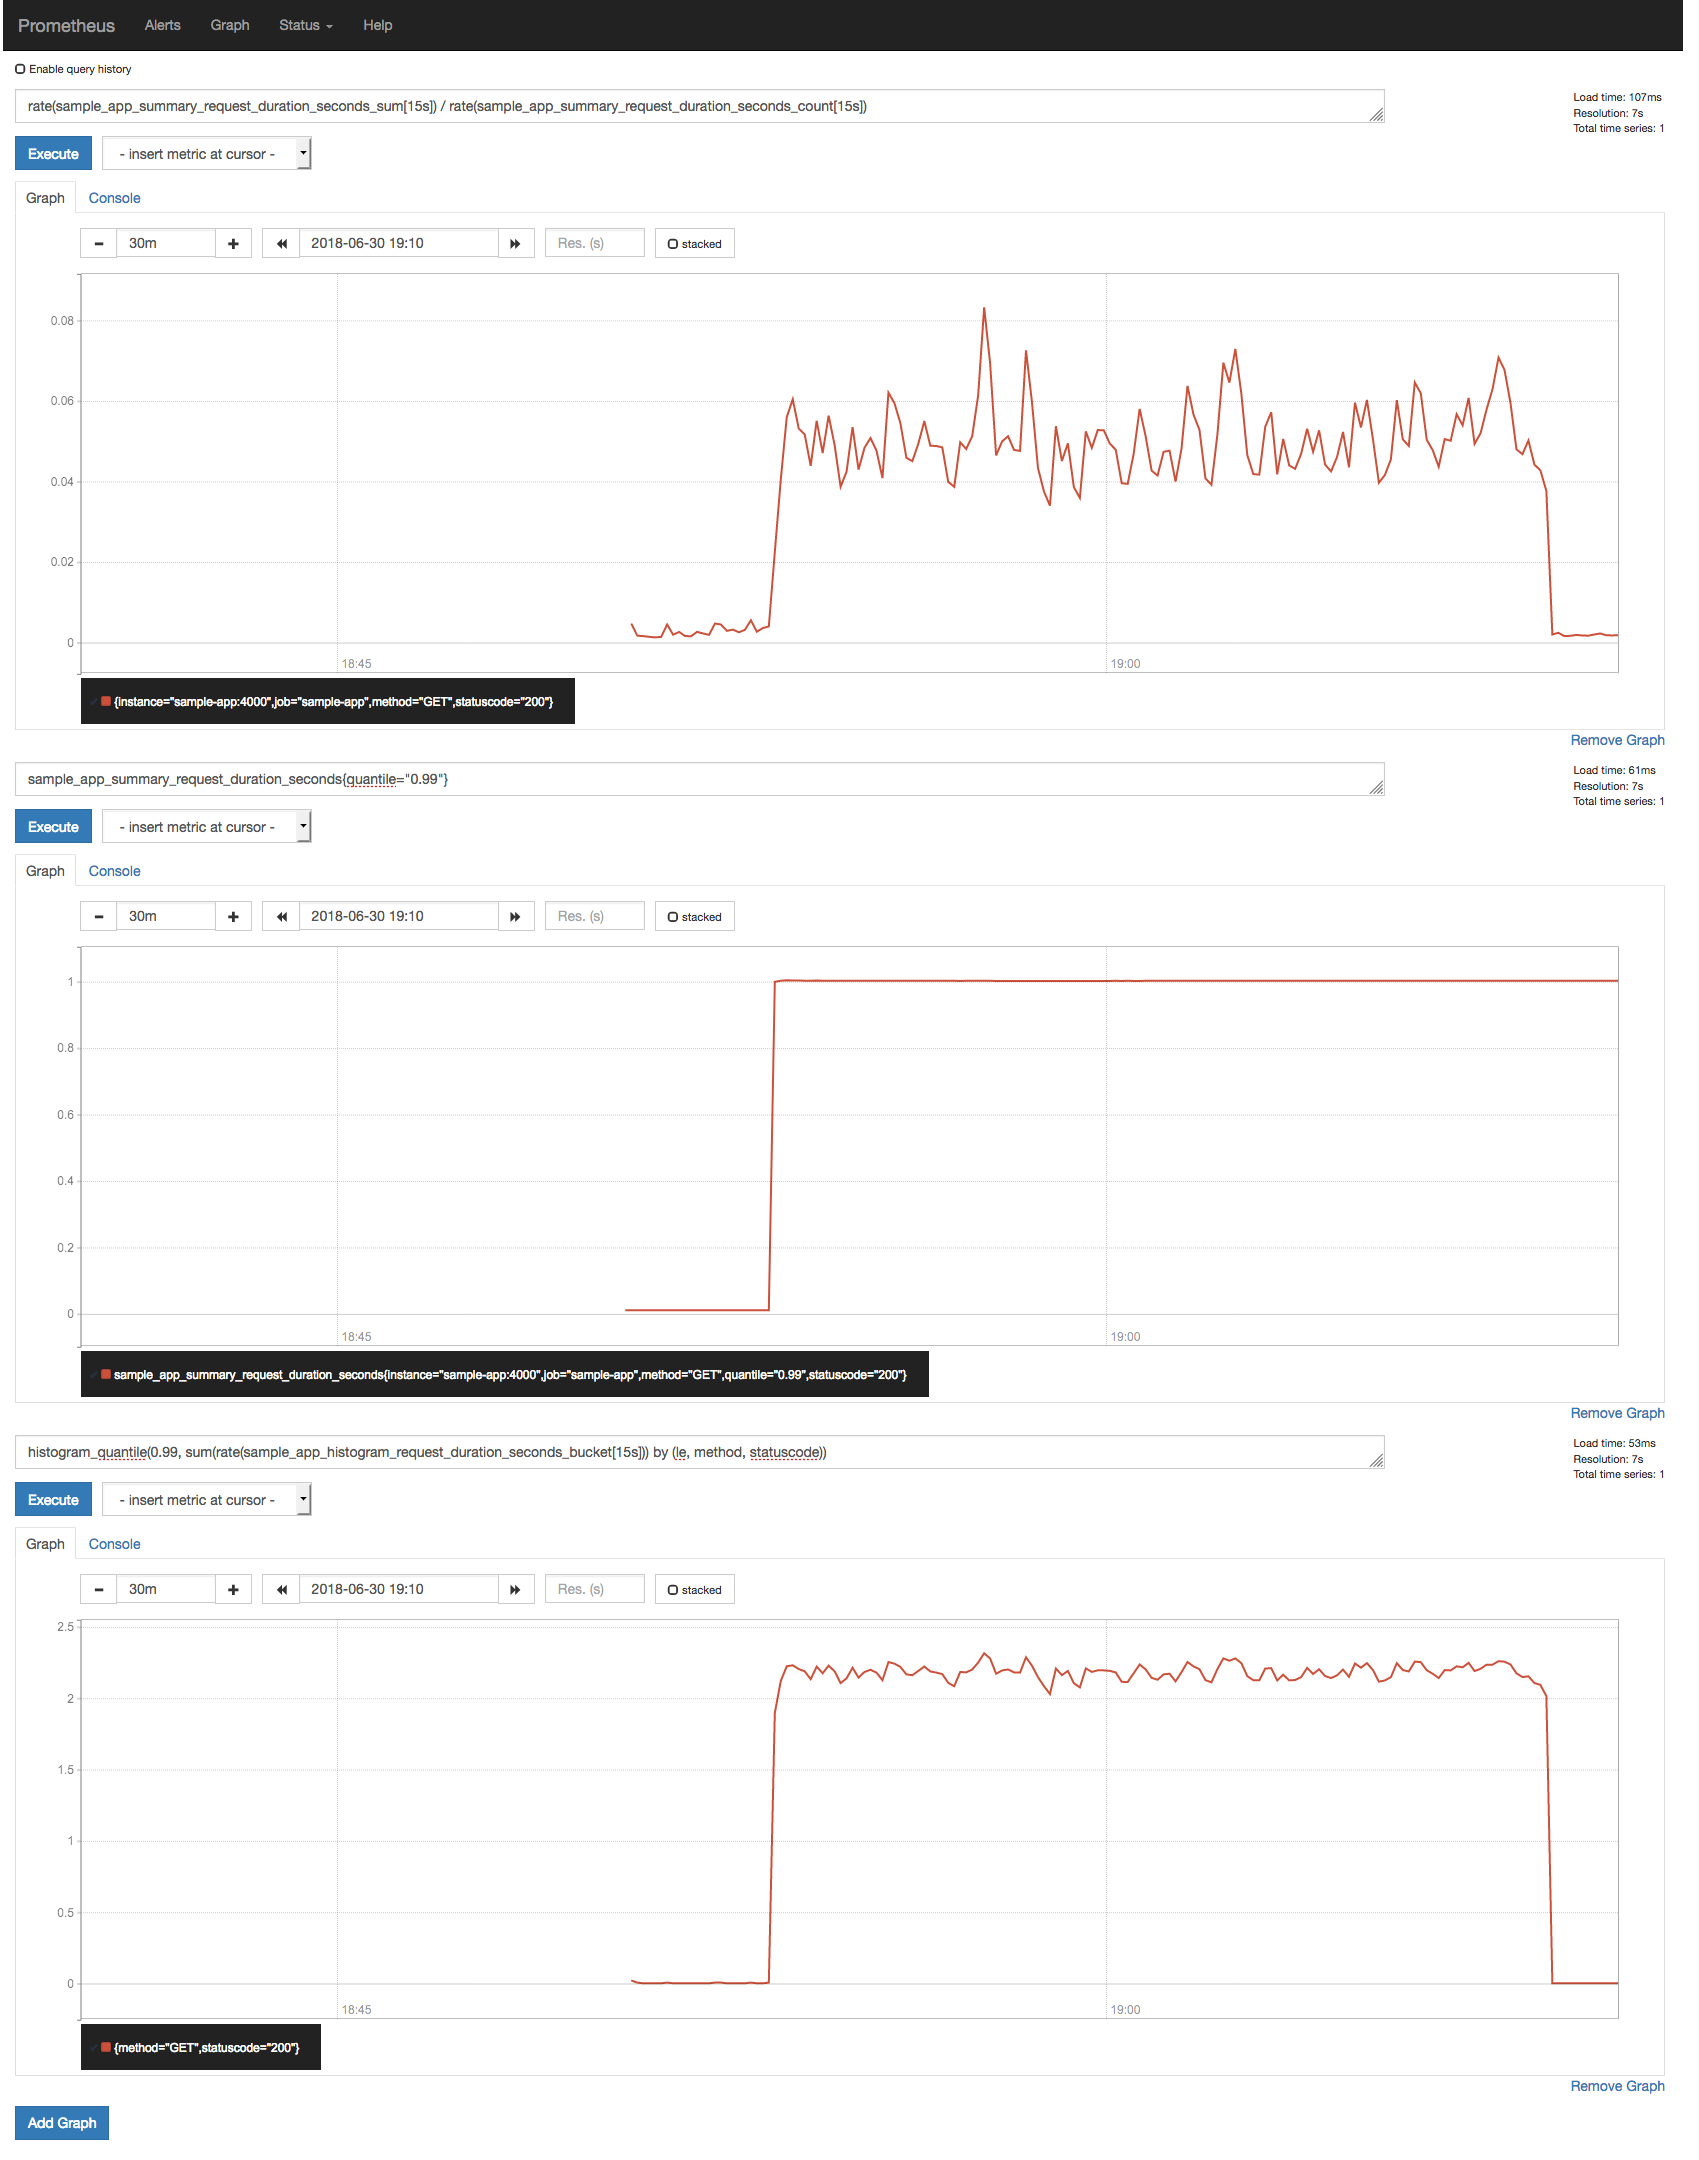
The result of these queries may seem surprising.
The first thing to notice is how the average response time fails to
communicate the actual behavior of the response duration distribution
(avg: 50ms; p99: 1s); the second is how the 99th percentile reported by the
the summary (1s) is quite different than the one estimated by the
histogram_quantile() function (~2.2s). How can this be?
Quoting the documentation:
You can use both summaries and histograms to calculate so-called φ-quantiles, where 0 ≤ φ ≤ 1. The φ-quantile is the observation value that ranks at number φ*N among the N observations. Examples for φ-quantiles: The 0.5-quantile is known as the median. The 0.95-quantile is the 95th percentile.
The essential difference between summaries and histograms is that summaries calculate streaming φ-quantiles on the client side and expose them directly, while histograms expose bucketed observation counts and the calculation of quantiles from the buckets of a histogram happens on the server side using the
histogram_quantile()function.
In other words, for the quantile estimation from the buckets of a histogram to be accurate, we need to be careful when choosing the bucket layout; if it doesn't match the range and distribution of the actual observed durations, you will get inaccurate quantiles as a result.
Remembering our current histogram configuration:
// Histogram metric for measuring request durations
const requestDurationHistogram = new prometheusClient.Histogram({
  // Metric name
  name: 'sample_app_histogram_request_duration_seconds',

  // Metric description
  help: 'Histogram of request durations',

  // Extra dimensions, or labels
  // HTTP method (GET, POST, etc), and status code (200, 500, etc)
  labelNames: ['method', 'status'],

  // Duration buckets, in seconds
  // 5ms, 10ms, 25ms, 50ms, 100ms, 250ms, 500ms, 1s, 2.5s, 5s, 10s
  buckets: [0.005, 0.01, 0.025, 0.05, 0.1, 0.25, 0.5, 1, 2.5, 5, 10]
});
Here we are using a exponential bucket configuration in which the buckets double in size at every step. This is a widely used pattern; since we always expect our services to respond quickly (i.e. with response time between 0 and 300ms), we specify more buckets for that range, and fewer buckets for request durations we think are less likely to occur.
According to the previous plot, all slow requests from our application are falling into the 1s-2.5s bucket, resulting in this loss of precision when calculating the 99th percentile.
Since we know our application will take at most ~1s to respond, we can choose a more appropriate bucket layout:
// Histogram metric for measuring request durations
const requestDurationHistogram = new prometheusClient.Histogram({
  // ...

  // Experimenting a different bucket layout
  buckets: [0.005, 0.01, 0.02, 0.05, 0.1, 0.25, 0.5, 0.8, 1, 1.2, 1.5]
});
Let's start a clean Prometheus server with the modified bucket configuration to see if the quantile estimation improves:
$ docker-compose rm -fs
$ docker-compose up -d
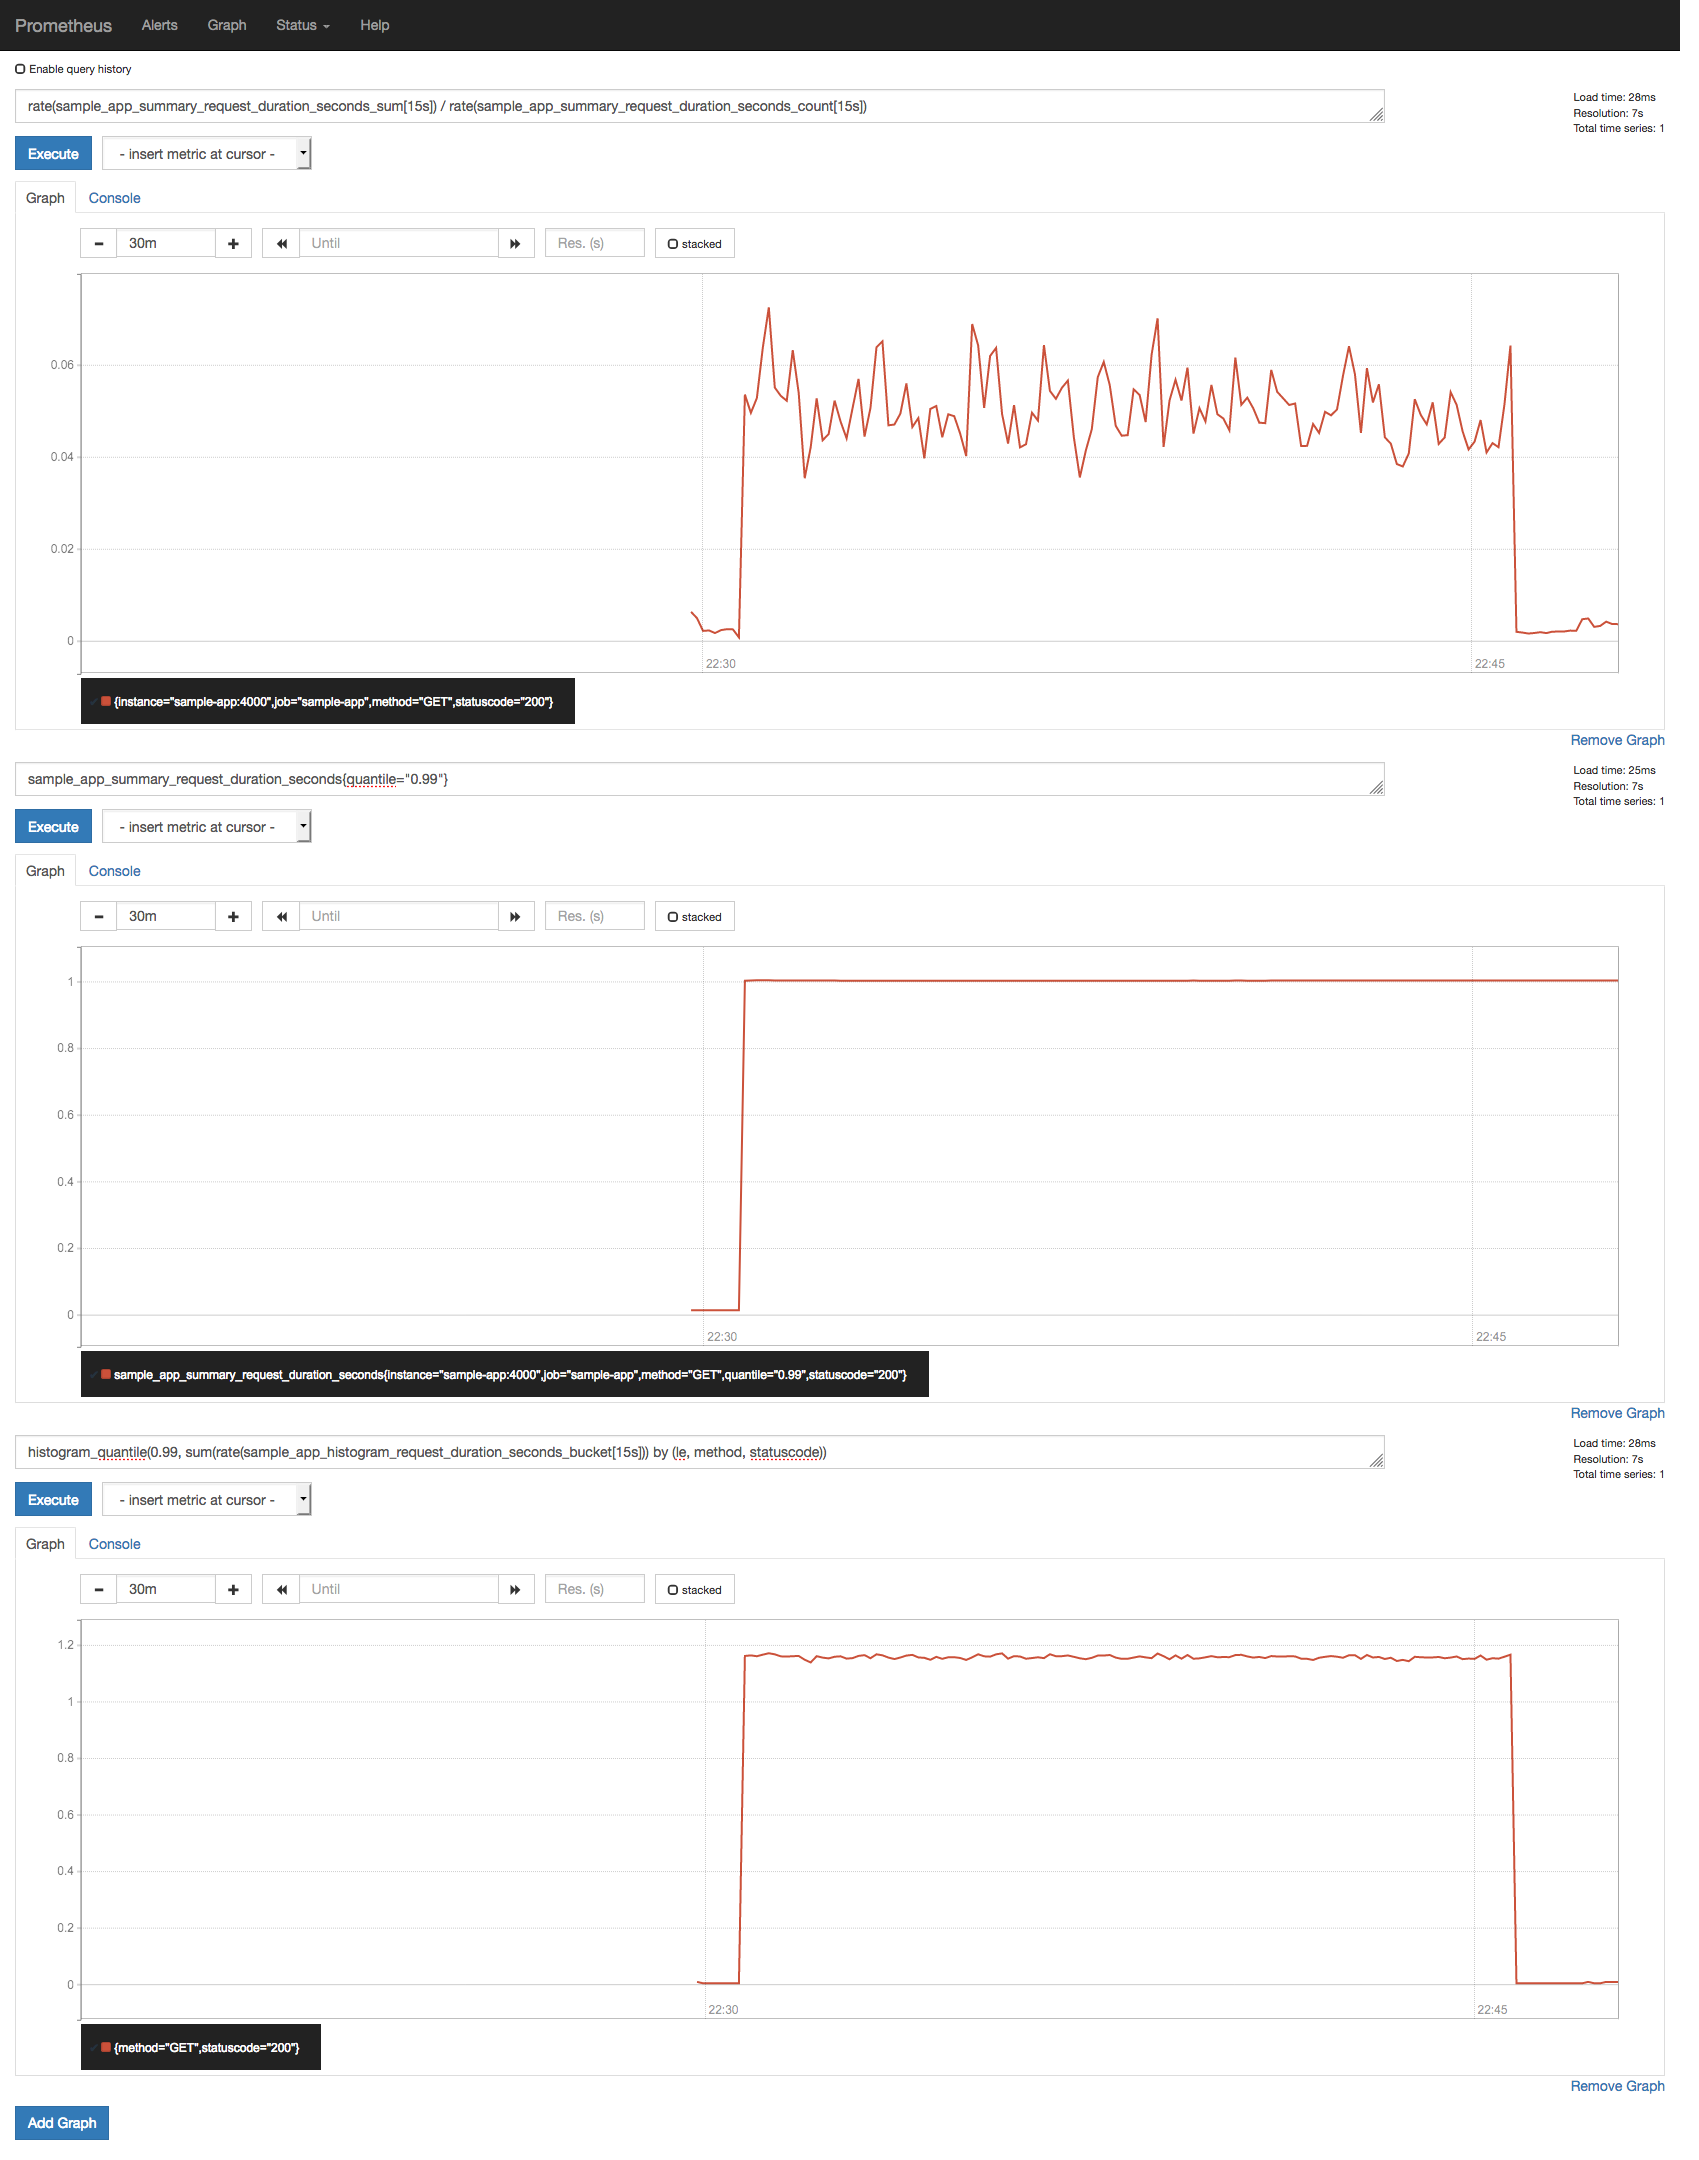
If you re-run the load test, now you should get something like this:
Not quite there, but it's an improvement!
Want to know more? If all it takes for us to achieve high accuracy histogram data is to use more buckets, why not use a large number of small buckets?
The reason is efficiency. Remember:
more buckets == more time series == more space == slower queries
Let's say you have an SLO (more details on SLOs later) to serve 99% of requests within 300ms. If all you want to know is whether you are honoring your SLO or not, it doesn't really matter if the quantile estimation is not accurate for requests slower than 300ms.
You might also be wondering: if summaries are more precise, why not use summaries instead of histograms?
Quoting the documentation:
A summary would have had no problem calculating the correct percentile value in most cases. Unfortunately, we cannot use a summary if we need to aggregate the observations from a number of instances.
Histograms are more versatile in this regard. If you have an application
with multiple replicas, you can safely use the histogram_quantile()
function to calculate the 99th percentile across all requests to all
replicas. You cannot do this with summaries. I mean, you can avg() the
99th percentiles of all replicas, or take the max(), but the value you
get will be statistically incorrect and could not be used as a proxy to the
99th percentile.
If you are using a histogram to measure request duration, you can use
the <basename>_count timeseries to measure throughput without having to
introduce another metric.
For instance, if your histogram metric name is
sample_app_histogram_request_duration_seconds, then you can use the
sample_app_histogram_request_duration_seconds_count metric to measure
throughput:
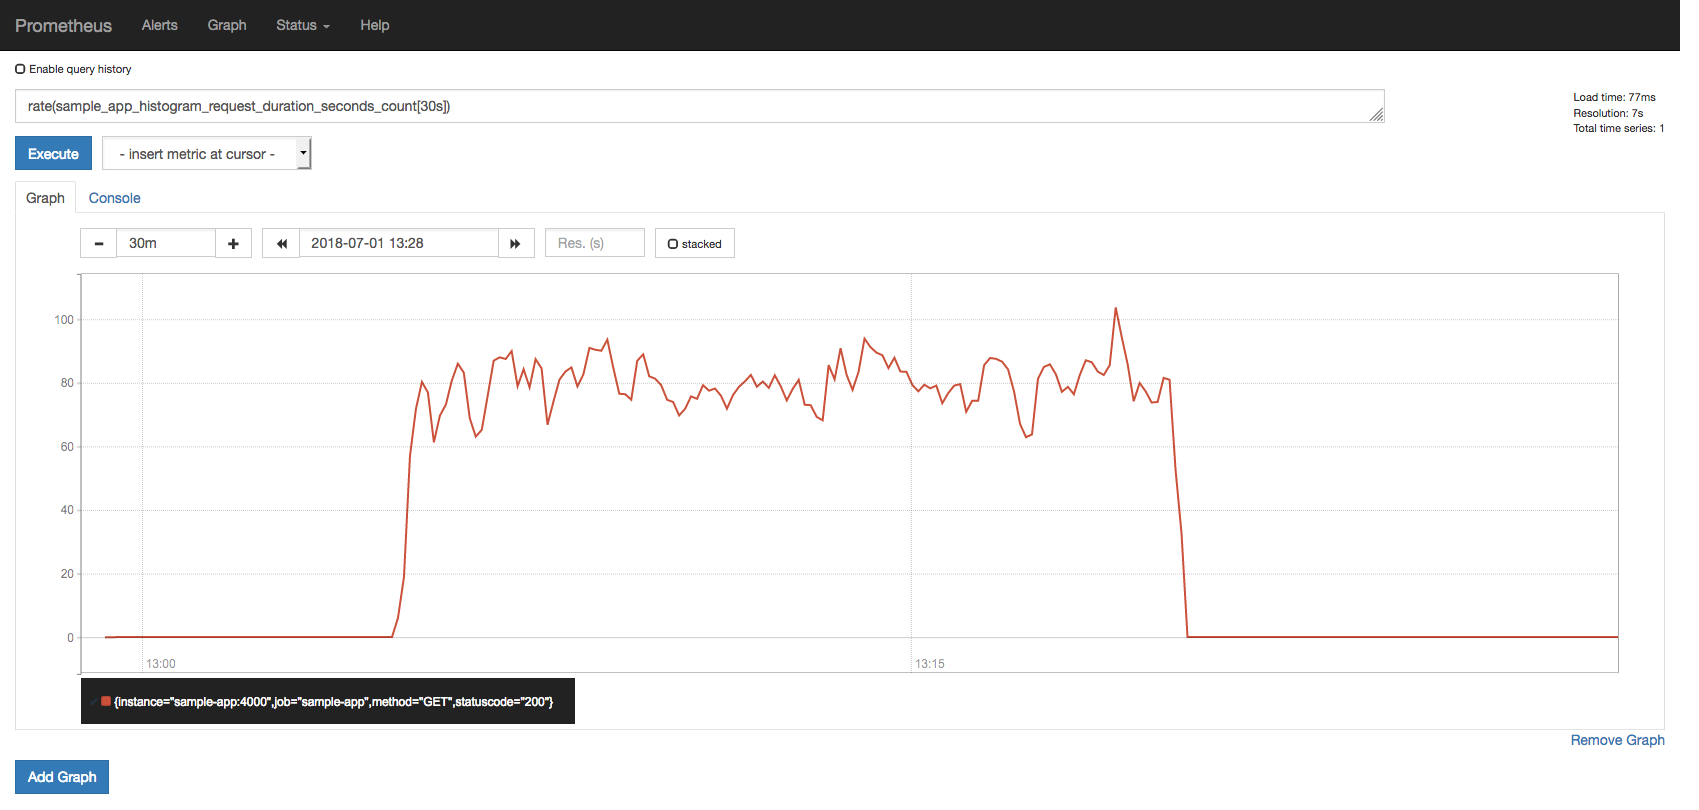
# Number of requests per second (data from the past 30s)
rate(sample_app_histogram_request_duration_seconds_count[30s])Most Prometheus clients already provide a default set of metrics; prom-client, the Prometheus client for Node.js, does this as well.
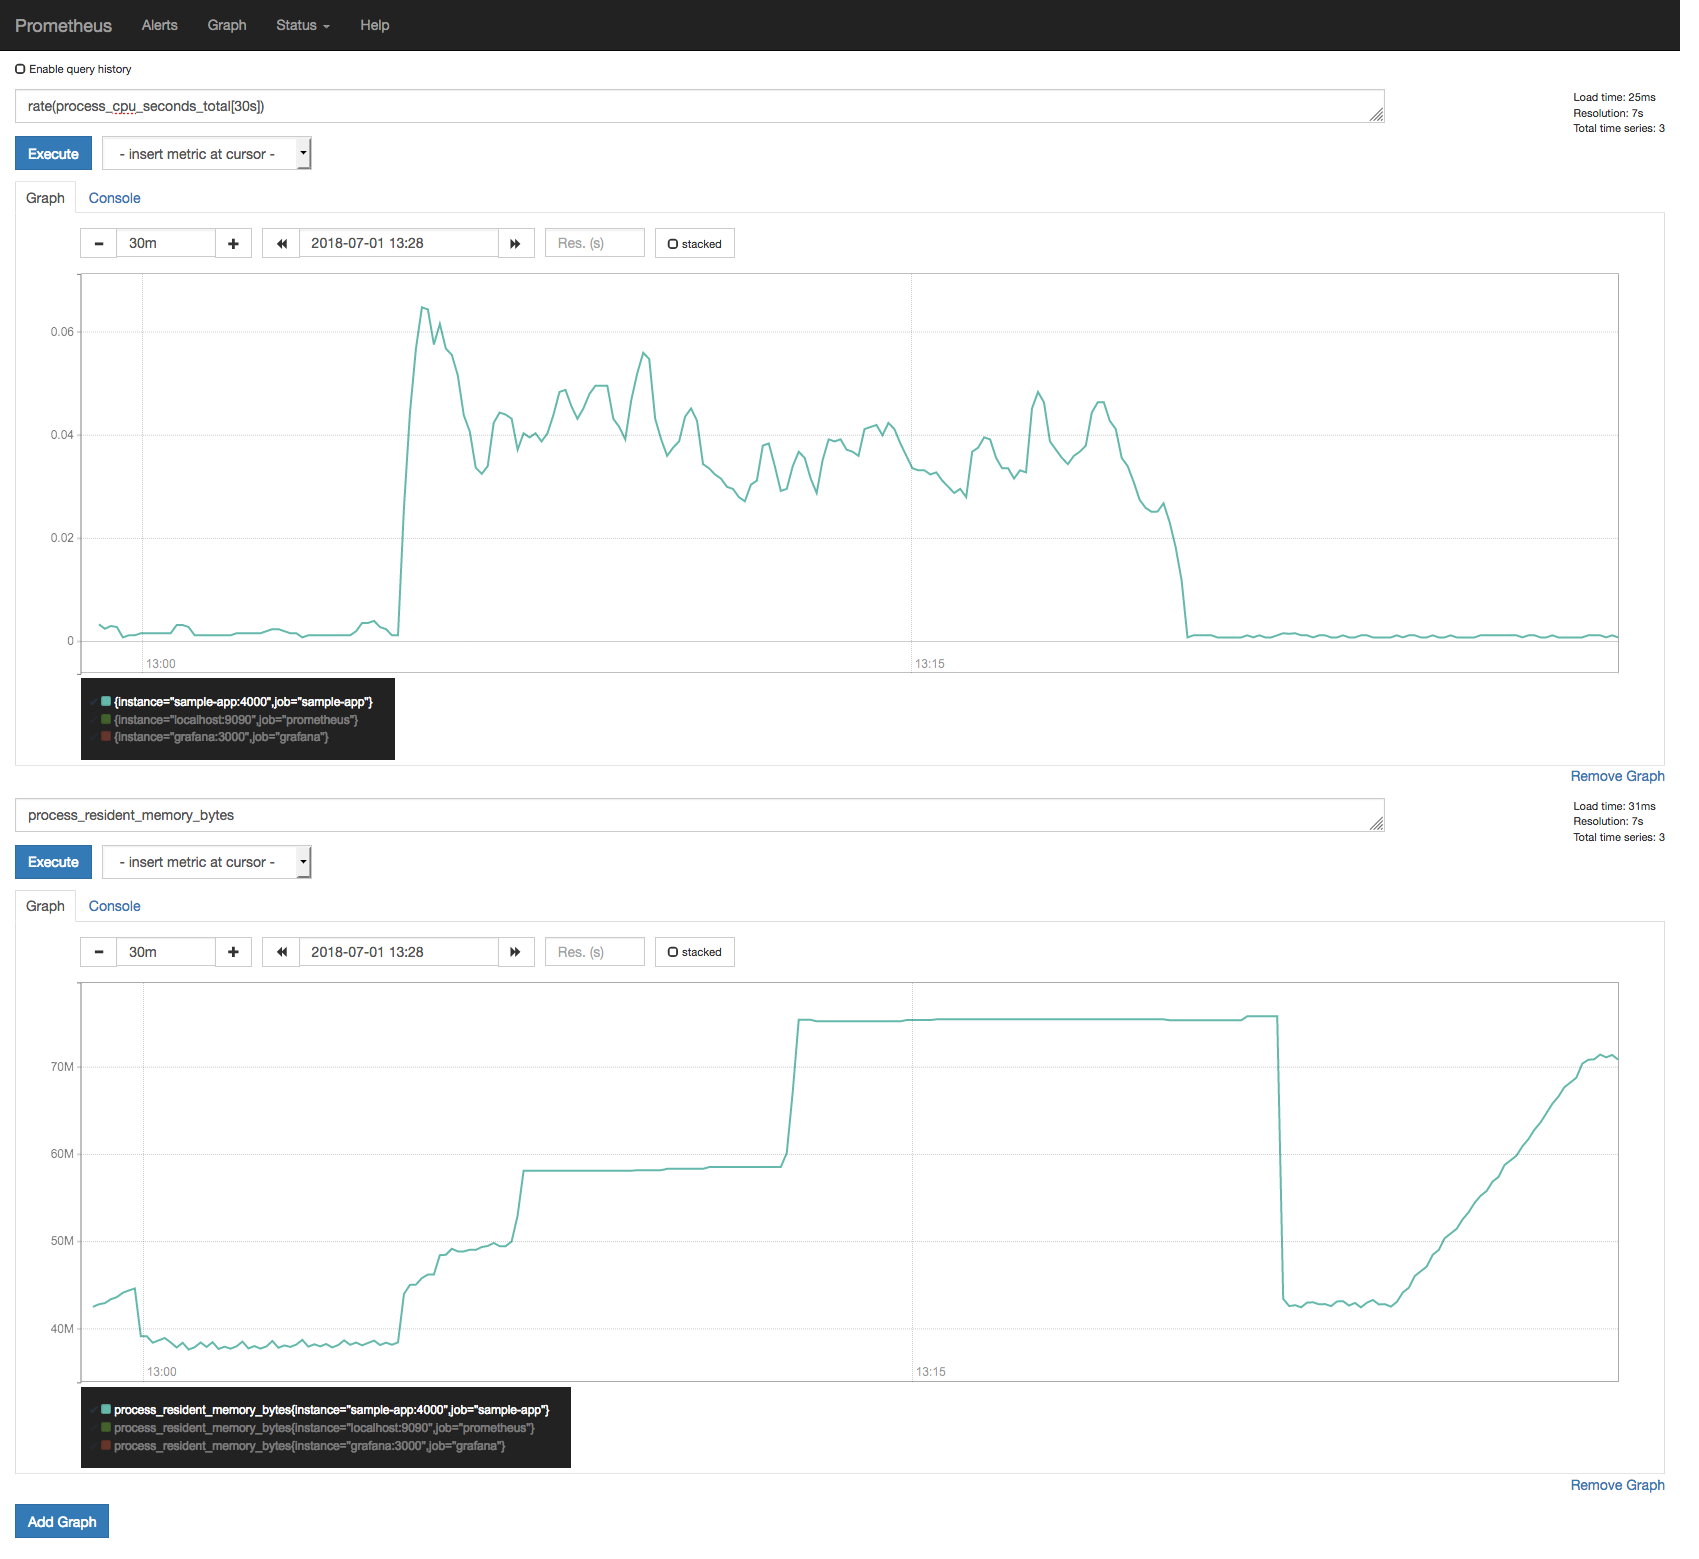
Try these queries in the Prometheus UI:
# Gauge that provides the current memory usage, in bytes
process_resident_memory_bytes

# Gauge that provides the usage in CPU seconds per second
rate(process_cpu_seconds_total[30s])
If you use wrk to put some load into our sample application you might see
something like this:
You can compare these metrics with the data given by docker stats to see if
they agree with each other.
Want to know more? Our sample application exports different metrics to expose some internal Node.js information, such as GC runs, heap usage by type, event loop lag, and current active handles/requests. Plot those metrics in the Prometheus UI, and see how they behave when you put some load to the application.
A sample dashboard containing all those metrics is also available in our Grafana server at http://localhost:3000.
Managing service reliability is largely about managing risk, and managing risk can be costly.
100% is probably never the right reliability target: not only is it impossible to achieve, it's typically more reliability than a service's users want or notice.
SLOs, or Service Level Objectives, is one of the main tools employed by Site Reliability Engineers (SREs) for making data-driven decisions about reliability.
SLOs are based on SLIs, or Service Level Indicators, which are the key metrics that define how well (or how poorly) a given service is operating. Common SLIs would be the number of failed requests, the number of requests slower than some threshold, etc. Although different types of SLOs can be useful for different types of systems, most HTTP-based services will have SLOs that can be classified into two categories: availability and latency.
For instance, let's say these are the SLOs for our sample application:
| Category | SLI | SLO |
|---|---|---|
| Availability | The proportion of successful requests; any HTTP status other than 500-599 is considered successful | 95% successful requests |
| Latency | The proportion of requests with duration less than or equal to 100ms | 95% requests under 100ms |
The difference between 100% and the SLO is what we call the Error Budget. In this example, the error budget for both SLOs is 5%; if the application receives 1,000 requests during the SLO window (let's say one minute for the purposes of this tutorial), it means that 50 requests can fail and we'll still meet our SLO.
But do we need additional metrics for keeping track of these SLOs? Probably not. If you are tracking request durations with a histogram (as we are here), chances are you don't need to do anything else. You already got all the metrics you need!
Let's send a few requests to the server so we can play around with the metrics:
$ while true; do curl -s http://localhost:4000 > /dev/null ; done# Number of requests served in the SLO window
sum(increase(sample_app_histogram_request_duration_seconds_count[1m])) by (job)
# Number of requests that violated the latency SLO (all requests that took more than 100ms to be served)
sum(increase(sample_app_histogram_request_duration_seconds_count[1m])) by (job) - sum(increase(sample_app_histogram_request_duration_seconds_bucket{le="0.1"}[1m])) by (job)
# Number of requests in the error budget: (100% - [slo threshold]) * [number of requests served]
(1 - 0.95) * sum(increase(sample_app_histogram_request_duration_seconds_count[1m])) by (job)
# Remaining requests in the error budget: [number of requests in the error budget] - [number of requests that violated the latency SLO]
(1 - 0.95) * sum(increase(sample_app_histogram_request_duration_seconds_count[1m])) by (job) - (sum(increase(sample_app_histogram_request_duration_seconds_count[1m])) by (job) - sum(increase(sample_app_histogram_request_duration_seconds_bucket{le="0.1"}[1m])) by (job))
# Remaining requests in the error budget as a ratio: ([number of requests in the error budget] - [number of requests that violated the SLO]) / [number of requests in the error budget]
((1 - 0.95) * sum(increase(sample_app_histogram_request_duration_seconds_count[1m])) by (job) - (sum(increase(sample_app_histogram_request_duration_seconds_count[1m])) by (job) - sum(increase(sample_app_histogram_request_duration_seconds_bucket{le="0.1"}[1m])) by (job))) / ((1 - 0.95) * sum(increase(sample_app_histogram_request_duration_seconds_count[1m])) by (job))Due to the simulated scenario in which ~5% of requests takes 1s to complete, if you try the last query you should see that the average budget available is around 0%, that is, we have no more budget to spend and will inevitably break the latency SLO if more requests start to take more time to be served. This is not a good place to be.
But what if we had a more strict SLO, say, 99% instead of 95%? What would be the impact of these slow requests on the error budget?
Just replace all 0.95 by 0.99 in that query to see what would happen:
In the previous scenario with the 95% SLO, the SLO burn rate was ~1x, which means the whole error budget was being consumed during the SLO window, that is, in 60 seconds. Now, with the 99% SLO, the burn rate was ~3x, which means that instead of taking one minute for the error budget to exhaust, it now takes only ~20 seconds!
Now change the curl to point to the /metrics endpoint, which do not have
the simulated long latency for 5% of the requests, and you should see the error
budget go back to 100% again:
$ while true; do curl -s http://localhost:4000/metrics > /dev/null ; doneWant to know more? These queries are for calculating the error budget for
the latency SLO by measuring the number of requests slower than 100ms. Now
try to modify those queries to calculate the error budget for the
availability SLO (requests with status=~"5.."), and modify the sample
application to return a HTTP 5xx error for some requests so you can validate
the queries.
The Site Reliability Workbook is a great resource on this topic and includes more advanced concepts such as how to alert based on SLO burn rate as a way to improve alert precision/recall and detection/reset times.
We learned that Prometheus needs all applications to expose a /metrics
HTTP endpoint for it to scrape metrics. But what if you want to monitor
a MySQL instance, which does not provide a Prometheus metrics endpoint?
What can we do?
That's where exporters come in. The documentation lists a comprehensive list of official and third-party exporters for a variety of systems, such as databases, messaging systems, cloud providers, and so forth.
For a very simplistic example, check out the aws-limits-exporter project, which is about 200 lines of Go code.
The Prometheus documentation page on instrumentation does a pretty good job in laying out some of the things to watch out for when instrumenting your applications.
Also, beware that there are conventions on what makes a good metric name; poorly (or wrongly) named metrics will cause you a hard time when creating queries later.
- Prometheus documentation
- Prometheus client for Node.js
- Keynote: Monitoring, the Prometheus Way (DockerCon 2017)
- Blog Post: Understanding Machine CPU usage
- Blog Post: #LatencyTipOfTheDay: You can't average percentiles. Period.
- Blog Post: Why Averages Suck and Percentiles are Great
- Site Reliability Engineering books
