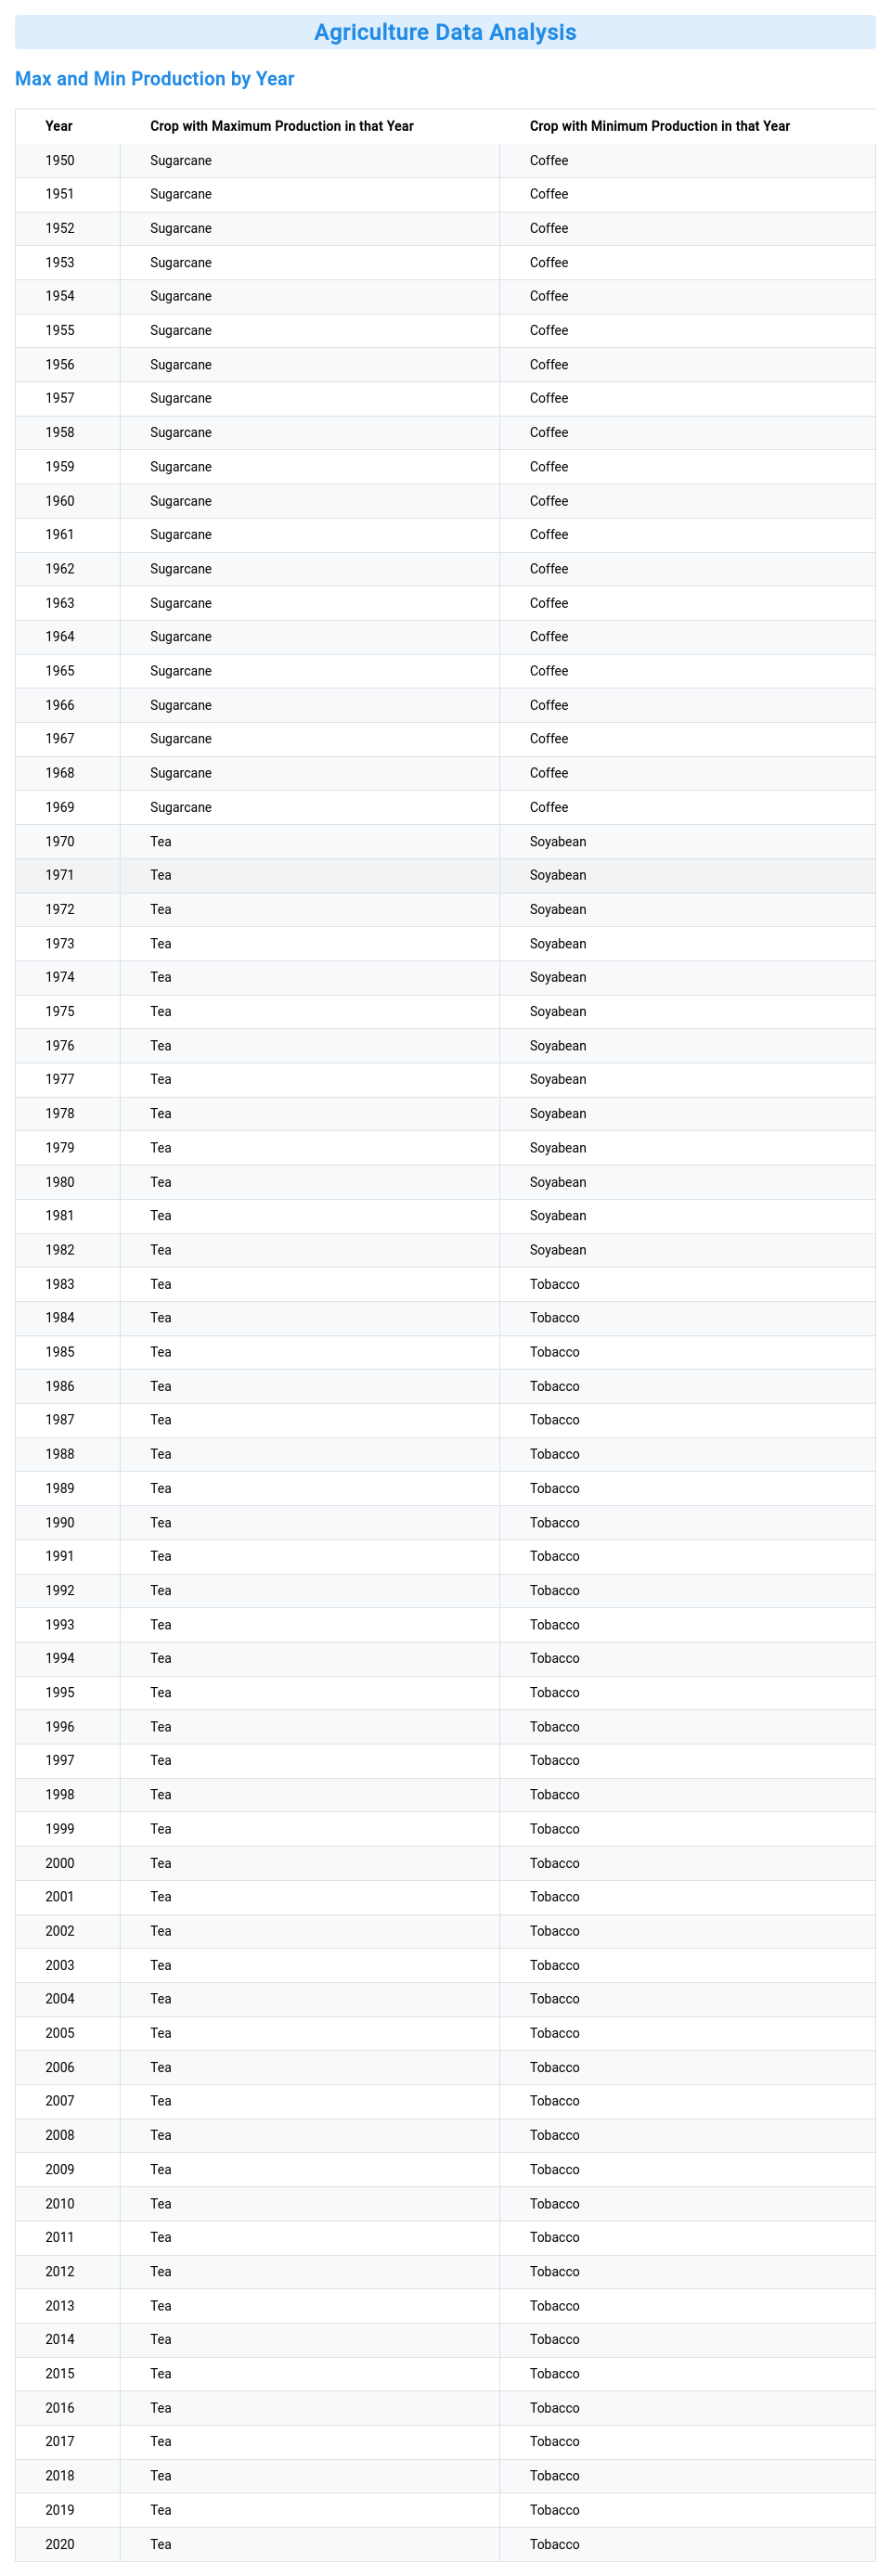
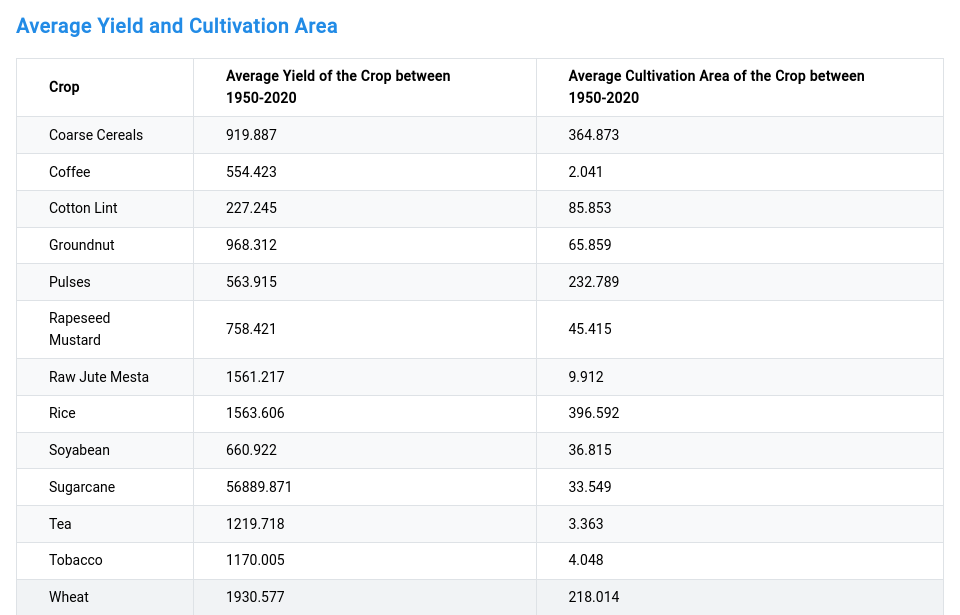
This project analyzes Indian agriculture data from 1950 to 2020 and displays two tables:
- Crop with maximum and minimum production each year.
- Average yield and cultivation area of each crop over the period.
my-project/
├── node*modules/
├── public/
├── src/
│ ├── components/
│ │ ├── AverageTable.tsx
│ │ ├── MaxMinTable.tsx
│ ├── data/
│ │ ├── Manufac * India Agro Dataset.json
│ ├── hooks/
│ │ ├── useWindowWidth.ts
│ ├── utils/
│ │ ├── dataLoader.ts
│ │ ├── aggregations.ts
│ │ ├── aggregateAverageYieldAndArea.ts
│ ├── App.tsx
│ ├── main.tsx
│ ├── theme.ts
├── index.html
├── package.json
├── tsconfig.json
├── vite.config.ts
└── README.md
- Node.js (v14 or higher)
- npm or yarn
-
Clone the repository:
git clone https://github.com/yourusername/agriculture-data-analysis.git cd agriculture-data-analysis -
Install dependencies:
npm install
# or
yarn
-
Run the development server:
npm run dev # or yarn dev -
Open the browser and navigate to
http://localhost:5173to see the application.
-
To build the project, run:
 npm run build
 # or
 yarn build
The build files will be generated in the
distdirectory.
-
To run the production server, run:
npm run preview # or yarn preview -
Open the browser and navigate to
http://localhost:4174to see the application.
The data is loaded from a JSON file located in the src/data directory. It is parsed and any missing values are treated as 0. The following aggregations are performed:
- Maximum and Minimum Production per Year: Displays the crop with the highest and lowest production for each year.
- Average Yield and Cultivation Area: Displays the average yield and cultivation area for each crop between 1950-2020.
- MaxMinTable: Displays the maximum and minimum production data.
- AverageTable: Displays the average yield and cultivation area data.
- useWindowWidth: Custom hook to handle window resize events and provide the current window width.
The project follows a typical React project structure with separate folders for components, hooks, utils, and data.
The project uses Mantine for styling and theming. The theme is defined in the src/theme.ts file.
This project is licensed under the MIT License.
- Mantine for providing a great UI library.
- Vite for the build tool.
- Cuvette for the assignment details.
Feel free to contact me at design.devanshu@gmail.com if you have any questions or need further assistance.

