This code corresponds to our MICCAI 2018 paper on retinal hemodynamics simulation. If you use this code, please cite: Orlando, JI, Barbosa Breda, J, van Keer, K, Blaschko, MB, Blanco, PJ and Bulant, C. "Towards a glaucoma risk index based on simulated hemodynamics from fundus images". MICCAI 2018. You can find the PDF here.
@incollection{Orlando2018a,
year={2018},
booktitle={Medical Image Computing and Computer-Assisted Intervention -- MICCAI},
series={Lecture Notes in Computer Science},
editor={Frangi, A. F. and Schnabel, J. A. and Davatzikos, C. and Alberola-Lopez, C. and Fichtinger, G.},
title={Towards a glaucoma risk index based on simulated hemodynamics from fundus images},
publisher={Springer},
author={Orlando, Jos\'{e} Ignacio and
    van Keer, Karel and
    Barbosa Breda, Jo\~{a}o and
    Blaschko, Matthew B. and
    Blanco, Pablo and
    Bulant, Carlos Alberto},
}
- Clone the repository doing
git clone https://github.com/ignaciorlando/retinal-hemodynamics.git. - Run
git submodule update --recursive - Open MATLAB and move to the root folder of the repository.
- Run
setupin the MATLAB console to add the folder to the path.
--- Note --- Once the project is setup, you just need to call the script
setup_add_foldersto automatically add the project folders to the MATLAB path.
LES-AV is a new data set introduced by our team, comprising 22 fundus pictures with vessel annotations and labels for arteries and veins. You can download the database from this link. If you use such this database, please cite our paper.
script_setup_les_av: organizes the data of the LES-AV for our experiments.
The folder ./precomputed-data contains precomputed data such as manual optic disc segmentations.
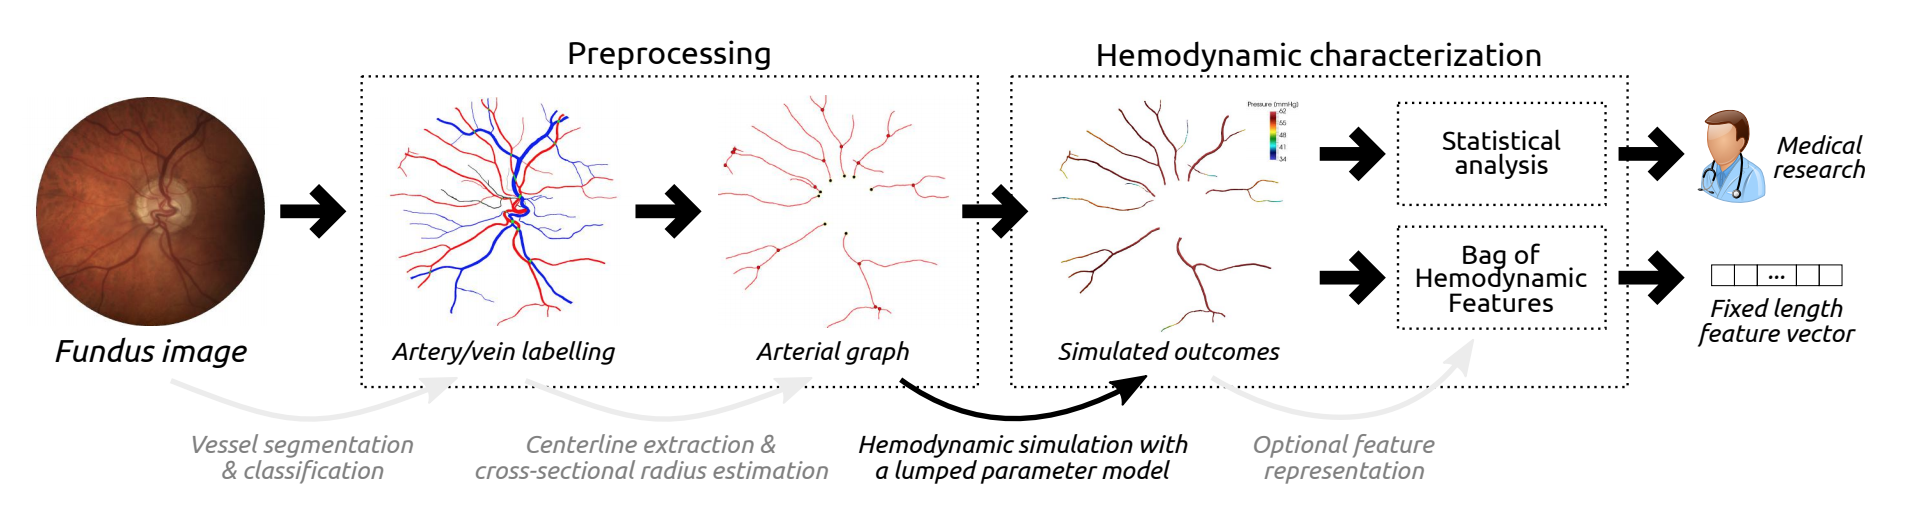
Arterial branches are mapped to an intermediate graph representation, which is obtained from the centerline of the arterial segmentation. This graph structure is a MATLAB struct with the following fields:
-
node: is a cell array of nodes. Each node has the following fields:node.idx: array of indices of pixels in the branching/root node.node.links: array with the ids of the links spanning from the node.node.conn: array with the ids of the nodes connected with the current node through a link. The order of the ids coincides with the order of the links innode.links.node.numLinks: length of the array of links.node.is_root: a logical value indicating if the node is a root.node.tree_id: id of the tree where the node is located.node.comx: mean x coordinate of the node.node.comy: mean y coordinate of the node.
-
link: is a cell array of links.link.n1: one of the nodes connected by the link.link.n2: the other node connected by the link. If the link is a terminal link,n2is equal to -1.link.point: list of points in the centerline that are part of the link.link.tree_id: id of the tree where the link is located.
-
w: is the width of the associated image. -
h: is the hight of the associated image. -
roots: is an array with the ids of the root nodes for each subtree. The position in the array is associated with thetree_id, while the content of the position is the id of the node which is root of that tree.
script_delineate_od
The root nodes of the computation graph are determined by analyzing the intersection between the arterial trees and the optic disc. To this end, it is essential to count with a (corse) segmentation of the optic disc. This script allows you to manually delineate an ellipse around the optic disc, and saves the output segmentations in a separate folder.
script_generate_input_data
This script allows you to compute the input data needed to perform the hemodynamic simulation and saves it as a .MAT file. In particular, it computes the arterial trees centerlines (trees_ids), their radius at each point (trees_radius) and the graph structure (graph).
--- Important! --- The data set that you will process will require to count with the arterial segmentations (in an
arteriesfolder) and the optic disc segmentations (in anod-masks).
display_graph(graph, [image])
Display a given graph. If image is given, the graph is display over the input image.
script_generate_input_data_vtk
This script allows you to export the skeletonizations generated with the script_generate_input_data script to VTK files.
Such files are the imput to the code that computes hemodynamics. The pixel spacing is hardcoded in this script.
script_run_simulation
This script allows you to run a set of scenarios defined by a total blood flow and ophthalmic pressures.
It is mandatory to generate the VTK files before running this script.
The pixel spacing is hardcoded in this script, and should match the one used to generate the VTK files.
The scripts reads data folders from config_generate_input_data.
The output is stored in the folder RITE-<test|training>/hemodynamic-simulation/.
For each scenario, a .VTK and a .mat files contaning the simulation results are generated.
The file name follows the encoding: <ImageID>_<test|training>_SC<scenarioID>_sol.<mat|vtk>.
The .mat file contains a variable named sol, which is a 3D matrix of dimensions [width,height,8].
Matrix dimensions represents (1) the radius (in [cm]), (2) the flow (in [ml/s]), (3) the pressure (in [mmHg]), (4) the velocity (in [cm/s]), (5) resistance, (6) Reynolds number, (7) wall shear stress, and (8)
a mask indicating if the centerline pixel is arterial segment (0), a root (1), a terminal (2) or a bifurcation (3). All the files have NaN values on non-centerline pixels.
script_export_vtksimsol_matlab
Use this script to export the results of the simulations to a MATLAB-friendly format. This will also prepare the data for running the experiments using the BoHF.
script_bohf_cross_validation
This script runs the classification experiment using the BoHF. You need to modify the configuration file config_bohf_cross_validation accordingly.
script_hemodynamics_sensitivity_analysis
This script allows you to exploratory data analysis and statistics on the hemodynamics simulations results. UNDER DEVELOPMENT!