You can start your local kubernetes cluster via KinD or minikube
$ minikube startYou can deploy OPA Gatekeeper via plain YAML or Helm chart, in this guide we are going to use Helm to deploy OPA Gatekeeper
$ helm repo add gatekeeper https://open-policy-agent.github.io/gatekeeper/charts
$ helm install gatekeeper gatekeeper/gatekeeper$ kubectl create namespace monitoring
$ helm repo add prometheus-community https://prometheus-community.github.io/helm-charts
$ helm install kube-prometheus-stack prometheus-community/kube-prometheus-stack --namespace monitoringYou need to scrape gatekeeper metrics, in order to do that you need a resource which is kind ServiceMonitor and you need a new port which is "metrics" in this case to the gatekeeper service like the following:
ports:
- name: https
  port: 443
  targetPort: 8443
- name: metrics
  port: 8888
After you edit the service , create the ServiceMonitor resource
$ kubectl apply -f monitoring/servicemonitor.yaml$ kubectl apply -f policies/privileged-containers-contraints-template.yaml
$ kubectl apply -f policies/privileged-containers-constraint.yaml$ kubectl apply -f samples/$ kubectl port-forward -n monitoring svc/kube-prometheus-stack-grafana 3000:80
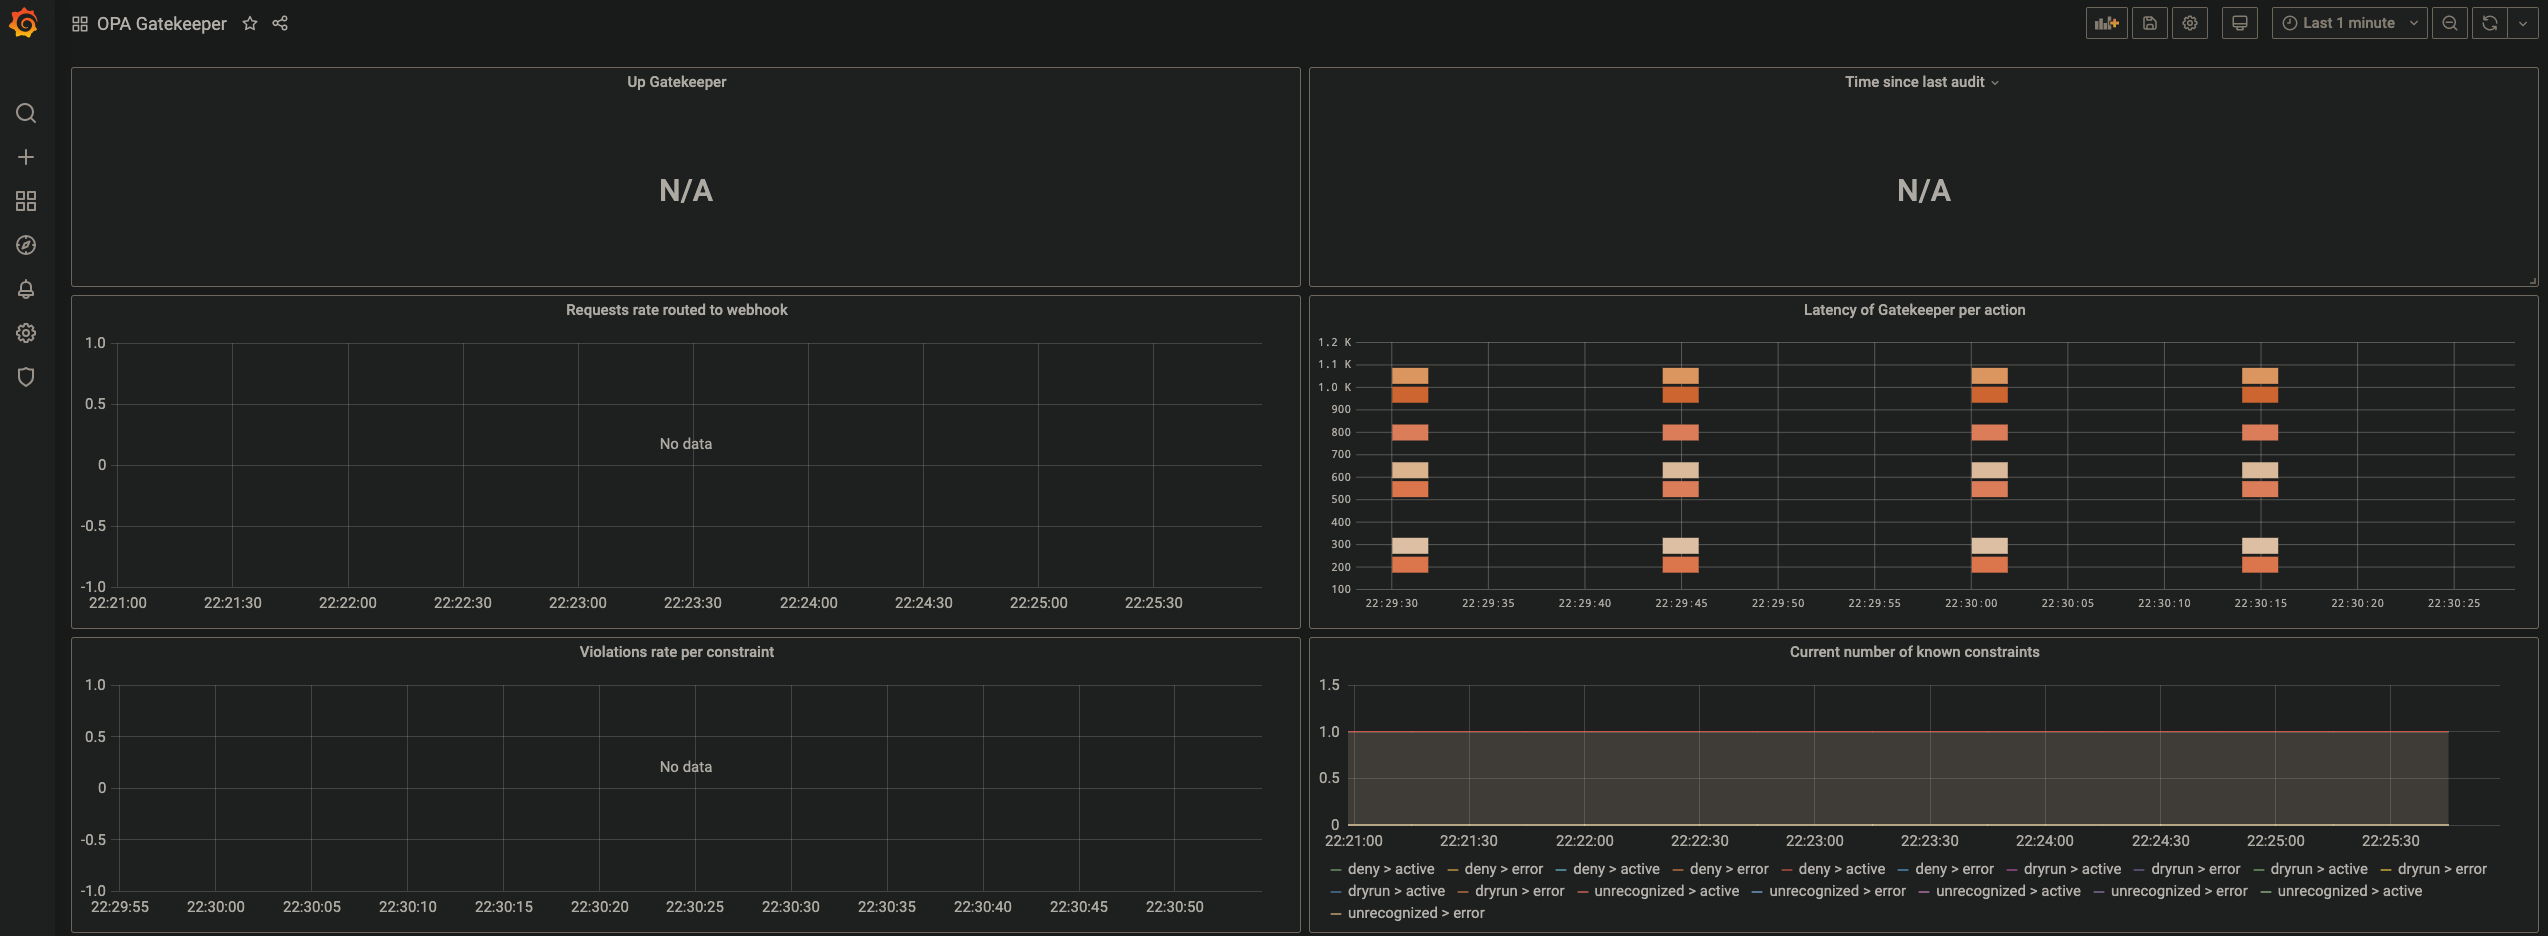
$ open localhost:3000 # username: admin password: prom-operatorAfter you opened the Grafana in the browser, you need to import the your json file, in order to do that copy your dashoard.json add paste to the import section of the grafana dashboard, then vola !
