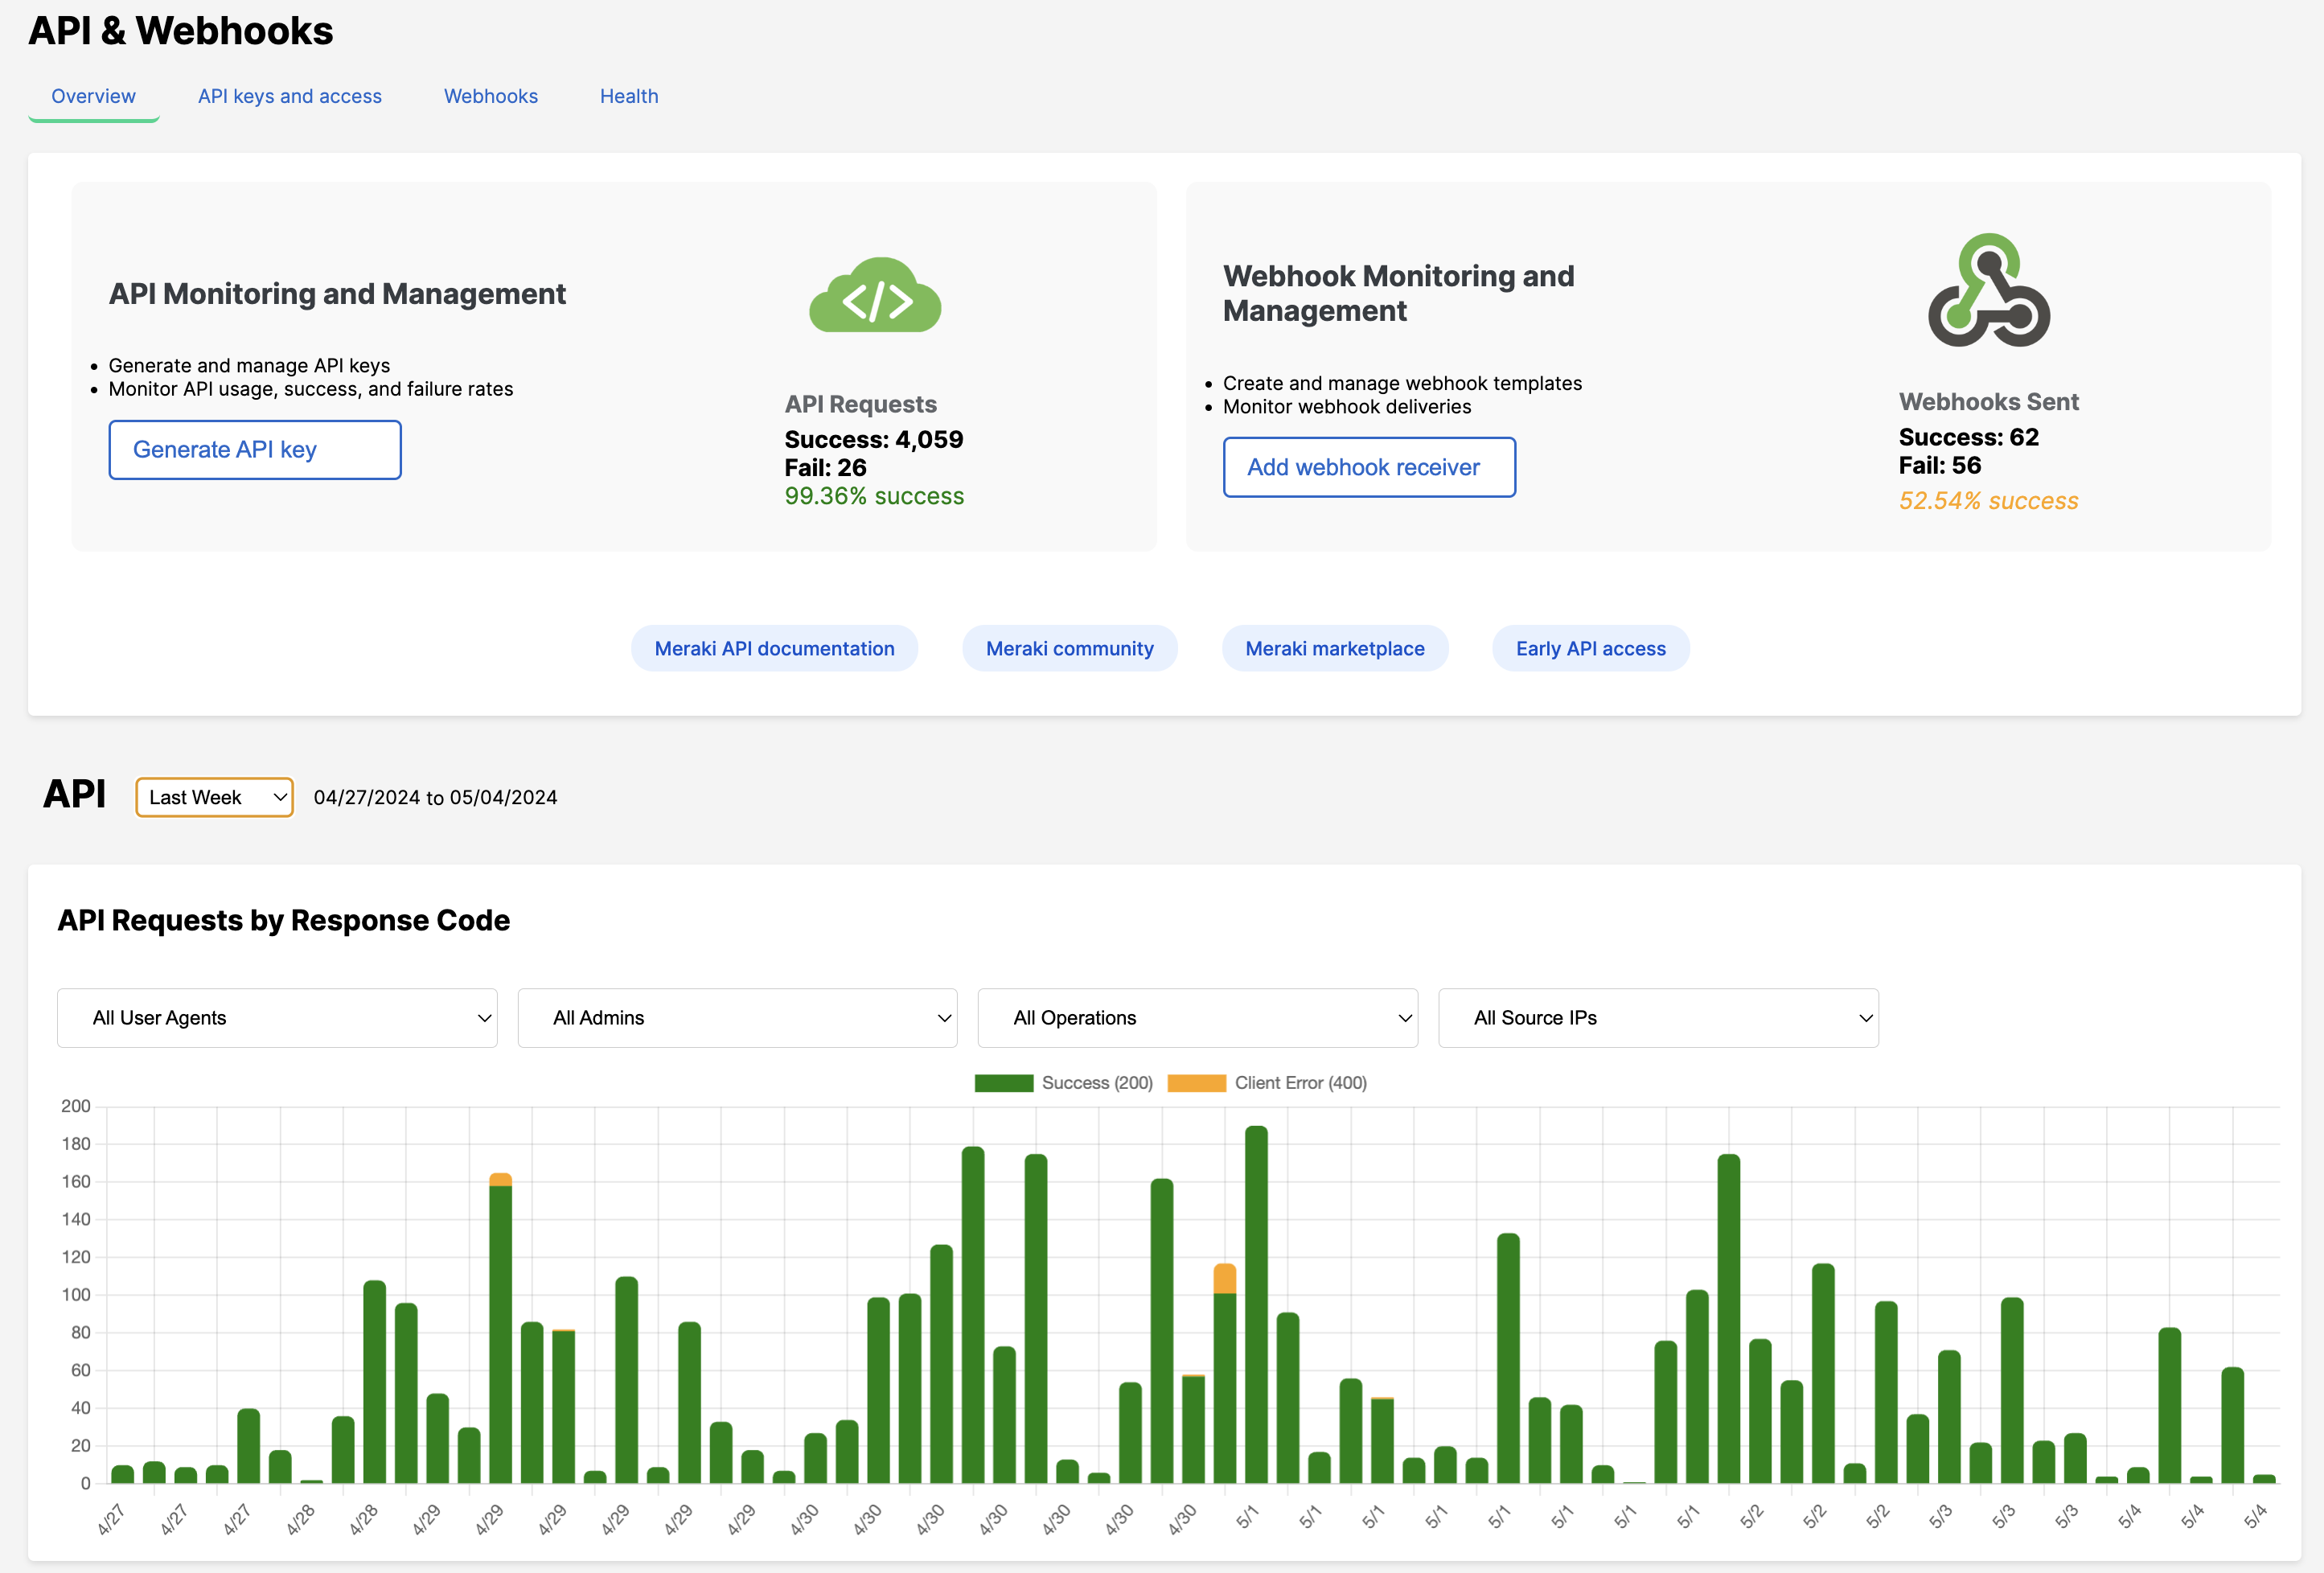
The Meraki API & Webhook Dashboard is a comprehensive web application designed to help network administrators and developers monitor, analyze, and manage their interactions with the Cisco Meraki Dashboard API and webhook system. This application provides a user-friendly interface for visualizing API usage, tracking webhook events, and managing API keys and webhook receivers.
-
API Usage Monitoring
- Visualize API requests and error trends
- Track deprecated and beta API operations
- Analyze user agent and application-specific metrics
-
Webhook Management
- Monitor webhook delivery success rates
- Analyze webhook activity by alert type and network
- Manage webhook receivers and payload templates
-
API Key Management
- View, generate, and revoke API keys
- Track API key usage and permissions
-
Data Visualization
- Interactive charts for API requests and webhook activities
- Sortable tables for detailed data exploration
- Summary cards for quick insights
-
Data Export
- Export API request logs and webhook data to Excel
The application is built using a client-side architecture with a lightweight server acting as a proxy for API requests. Here's an overview of the main components:
server.js: Express.js server that handles static file serving and API proxying
index.html: Main application structure and layoutscript.js: Core application logic and initializationapiHandlers.js: Centralized API request handlingapiRequestsMetrics.js: API request data processing and analysisapiRequestsMetricsViz.js: Visualization of API metricswebhookMetrics.js: Webhook log data processing and analysiswebhookMetricsViz.js: Visualization of webhook metrics- Various chart modules (e.g.,
apiRequestsByIntervalChart.js,webhookHistoryChart.js) - Utility modules (e.g.,
exportToExcel.js,tableSorter.js)
The application leverages several Meraki Dashboard API endpoints, including:
getOrganizations: List accessible organizationsgetOrganizationAdmins: Retrieve organization adminsgetAdministeredIdentitiesMe: Get current user's identitygetOrganizationApiRequests: Fetch API request logsgetOrganizationApiRequestsOverviewResponseCodesByInterval: Get API request response code overviewgetOrganizationWebhooksLogs: Obtain webhook logs
- Clone the repository
- Run
npm installto install dependencies - Start the server with
npm start - Open
http://localhost:3000in a web browser - Enter your Meraki API key in the Credentials modal
- Select an organization to begin exploring data
The application provides detailed insights into API usage through several modules:
-
apiRequestsMetrics.js: Processes raw API request data to generate comprehensive metrics, including:- Success rates for various operations
- User agent analysis
- Identification of deprecated and beta operations
- Hourly and daily usage statistics
-
apiRequestsMetricsViz.js: Visualizes the processed metrics using:- Summary cards for quick overview
- Detailed metric cards for various data categories
- Interactive and sortable tables
- Pie charts for data distribution
-
apiRequestsByIntervalChart.jsandapiRequestsByIntervalSuccessFailChart.js: Generate time-series charts showing API request trends and success/failure rates.
Webhook activity is monitored and analyzed through:
-
webhookMetrics.js: Processes webhook log data to generate metrics on:- URL performance
- Network-specific activity
- Alert type distribution
- Temporal patterns (busiest hours/days)
-
webhookMetricsViz.js: Creates visualizations for webhook metrics, including:- Metric cards for different data categories
- Formatted, sortable tables
- Color-coded success rates
-
webhookHistoryChart.jsandwebhookHistoryByAlertTypeChart.js: Generate time-series charts showing webhook activity trends and distribution by alert type. -
webhookReceivers.jsandwebhookTemplates.js: Manage webhook receivers and payload templates at both organization and network levels.
API key management is handled by:
apiKeyMgmt.js: Provides functionality to view, generate, and revoke API keys, with a limit of two active keys per user.
Several utility modules enhance the application's functionality:
exportToExcel.js: Enables exporting data to Excel formattableSorter.js: Provides sorting functionality for tablesmeraki-openapi-parser.js: Fetches and parses the Meraki OpenAPI specification for up-to-date API operation information
The Meraki API & Webhook Dashboard provides a powerful set of tools for monitoring and managing interactions with the Meraki Dashboard API and webhook system. By offering detailed visualizations, comprehensive metrics, and intuitive management interfaces, it enables network administrators and developers to optimize their use of Meraki's powerful API and webhook capabilities.
