This package contains a collection of simple javascript, jython and python scripts for processing image and flow-cytometry data. These modules were designed to collect parameters about cells in culture, such as confluency via brightfield images, or proportion of cells in each phase of the cell cycle.
Please note that these are short scripts that I use routinely in my own work, and I do not guarantee their useability or compatibility with other applications. Lastly, these scripts are designed for interactive variable management and running (not for command-line use) - see example notebooks here.
This package assumes the standard installation of Python 3.7 or later. For specific package requirements, see the requirements.txt file.
In addition, jython scripts and ImageJ macros require installation of an ImageJ distribution, FiJi. The code provided here has been tested using ImageJ v 1.52i.
You can install the python scripts included in this repo using pip:
python -m pip install git+https://github.com/dezeraecox/GEN_cell_culture#egg=GEN_cell_culture
- Confluency from brightfield images
- This technique should work on any folder of brightfield
.tifimages of cells in culture - FiJi Functionality:
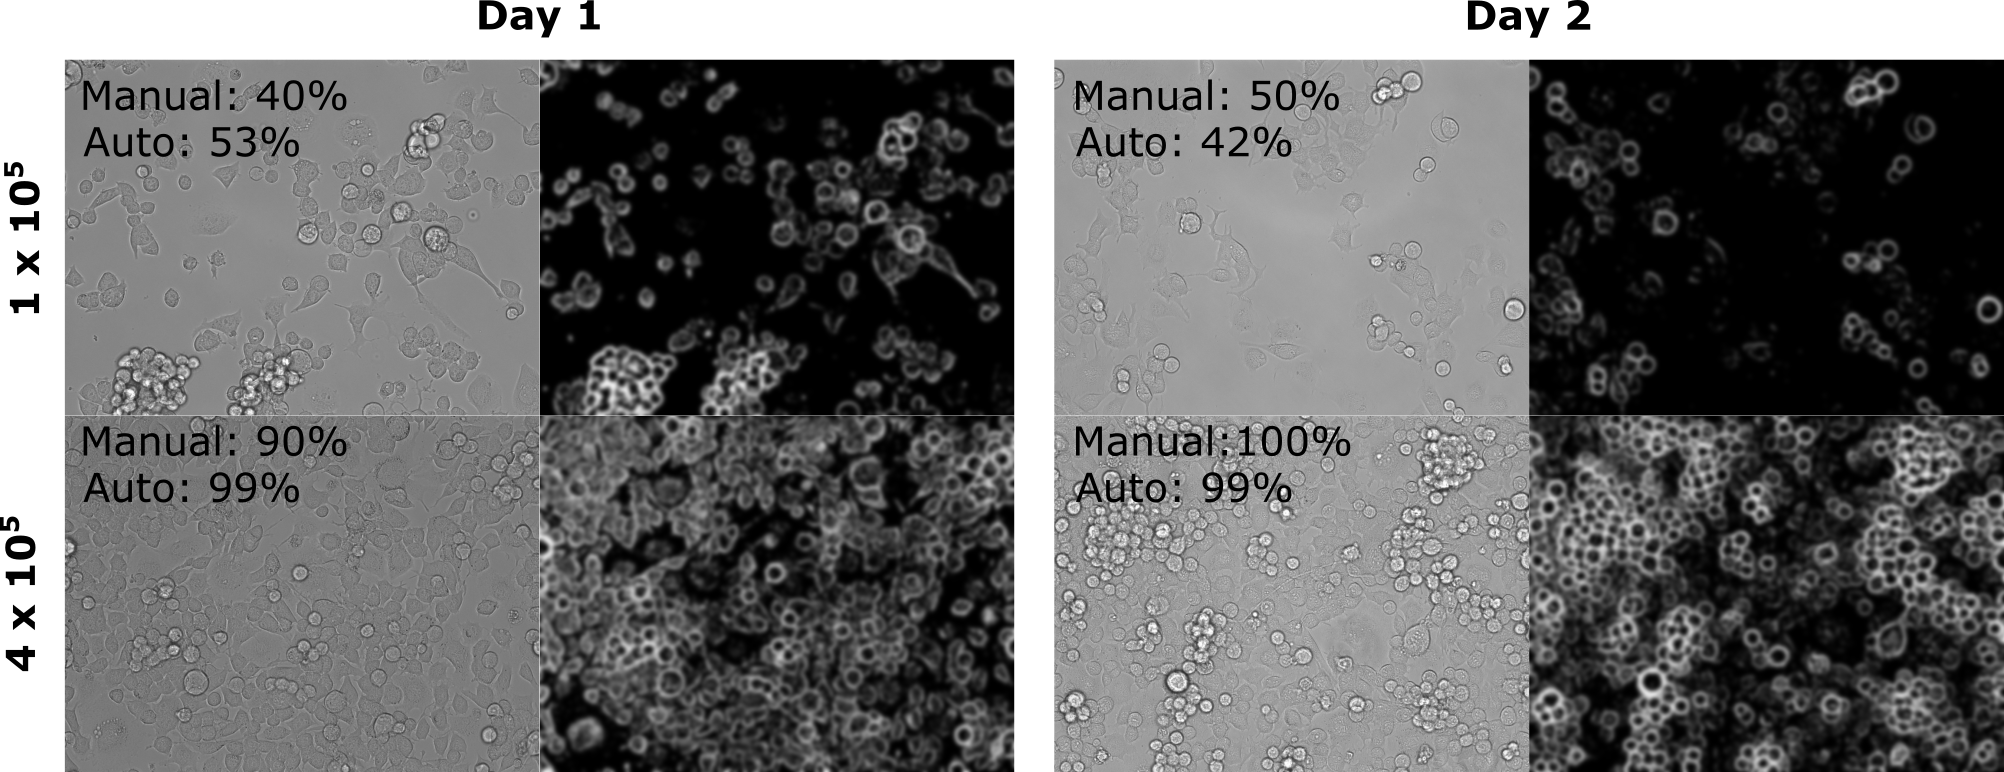
- Each image is transformed using combination of gaussian blur and thresholding
- The proportion of pixels occupied by cell structure is determined as an estimate of confluency
- data is outputted to .csv for processing in python
- Python functionality
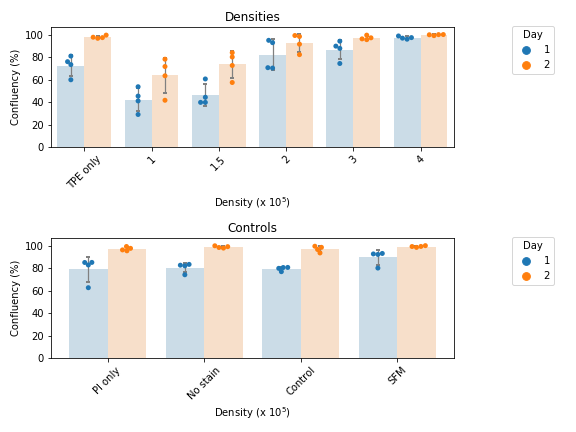
- Takes import of measurements from FiJi and groups replicates according to provided sample identifiers
- Produces scattbar plot grouped according to sample identifiers
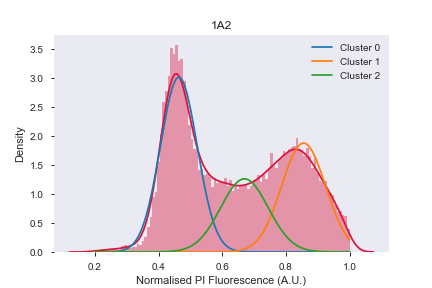
- Proportion of cells in each phase of cell cycle
- Cells stained with propidium iodide (PI; see example protocols here) are analysed via flow cytometry
- Flow cytometry files can then pre-processed using a suitable analysis program (e.g. FlowJo, FlowCytometryTools)
- PI fluorescence is then exported for individual cells to
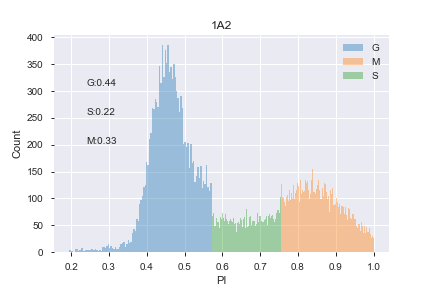
.csv - This module then plots PI histogram, fits distribution with 3-phase gaussian fits to assign cell cycle stage (G0/1, S, G2/M)
| Model | Prediction |
|---|---|
 |
 |
- Using fits, cells are then binned into each phase to allow other parameters to be calculated (e.g. median of other fluorescent channels) for each phase
- Dezerae Cox - Initial work - dezeraecox
This project is licensed under the MIT License - see the LICENSE.md file for details
- Templates for this package were adapted from PurpleBooth
- Kudos to the 2018 Asia-Pacific Advanced Scientific Programming in Python (#ASPP) Summer School for giving me the condfidence and tools to tackle my first python package!

