Lighthouse plugin that adds field data to your report. It uses real-user data from Chrome UX Report and Core Web Vitals logic to estimate the score.
An example report for developers.google.com:

This plugin adds Core Web Vitals values to your Lighthouse report. The Field Performance category includes real-user data provided by Chrome UX Report. It's similar to the field section in PageSpeed Insights.
The scoring algorithm weighs values for Largest Contentful Paint (LCP), First Input Delay (FID), and Cumulative Layout Shift (CLS). It uses the Core Web Vitals assessment logic that sets 1 if metric is good, 0 if metric is poor, and a value from 0 to 1 if it's between. (Note: FCP and the origin values do not affect the score, see the source)
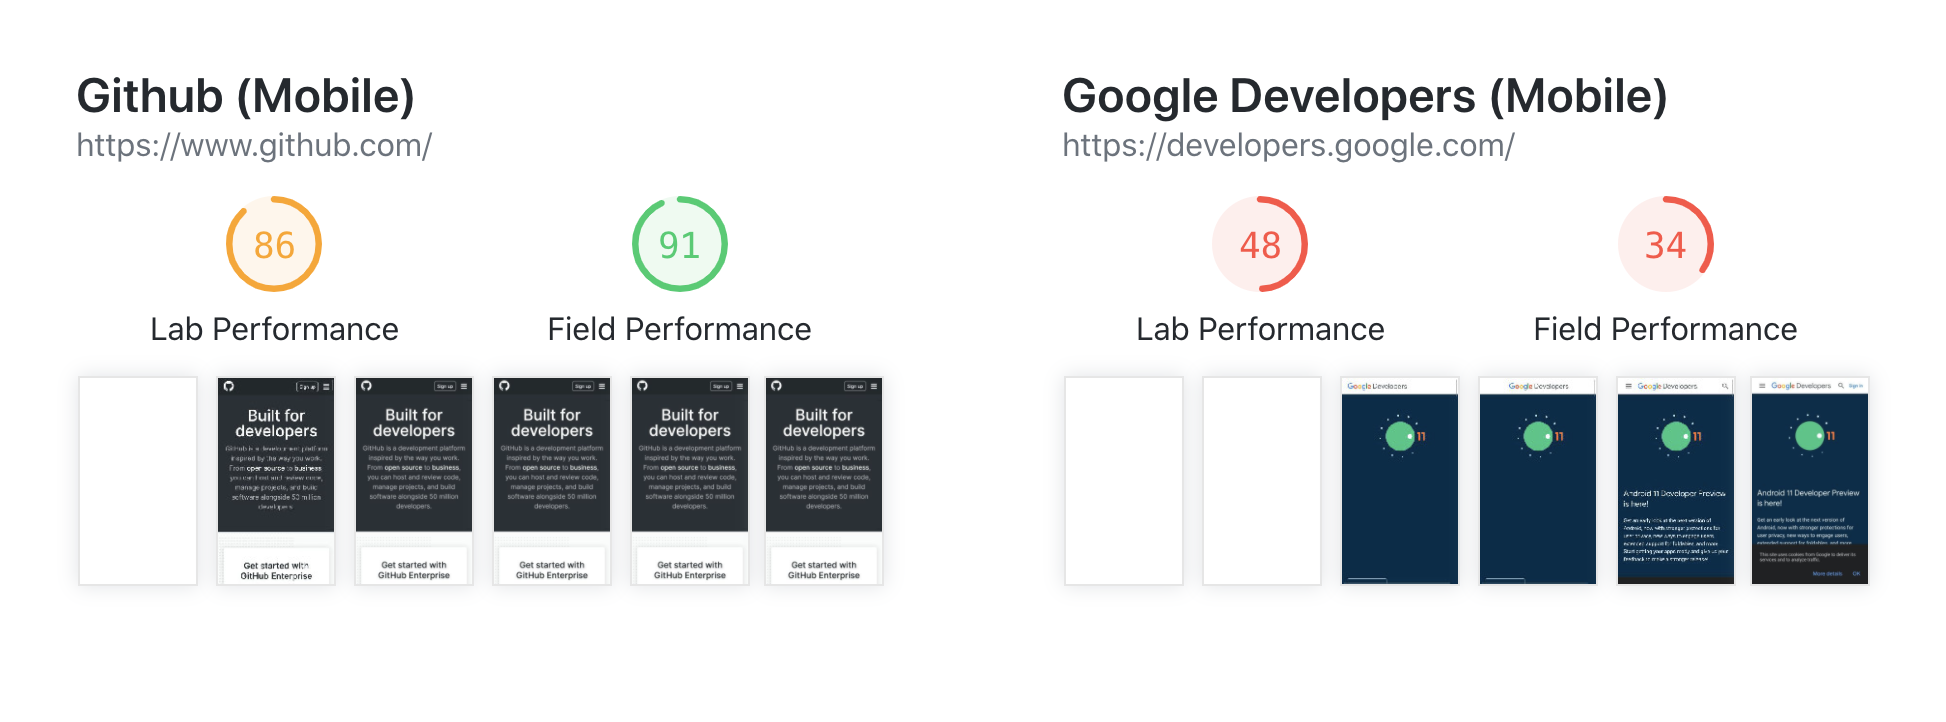
Check out the parity between Field & Lab performance on mobile:
And on desktop:
Sometimes field data is missing because a URL doesn't have enough anonymous traffic. In this case, the lab data is the only available measurement.
Requires Node.js 12+ and Lighthouse 8+.
$ npm install lighthouse lighthouse-plugin-field-performanceUse the plugin with Lighthouse CLI:
$ npx lighthouse https://www.apple.com/ --plugins=lighthouse-plugin-field-performanceTo run more requests, provide your PageSpeed Insights token using a custom config:
$ npx lighthouse https://www.apple.com/ --config-path=./config.jsconfig.js
module.exports = {
  extends: 'lighthouse:default',
  plugins: ['lighthouse-plugin-field-performance'],
  settings: {
    psiToken: 'YOUR_REAL_TOKEN',
  },
}Sponsored by Treo.sh - Page speed monitoring made simple.


