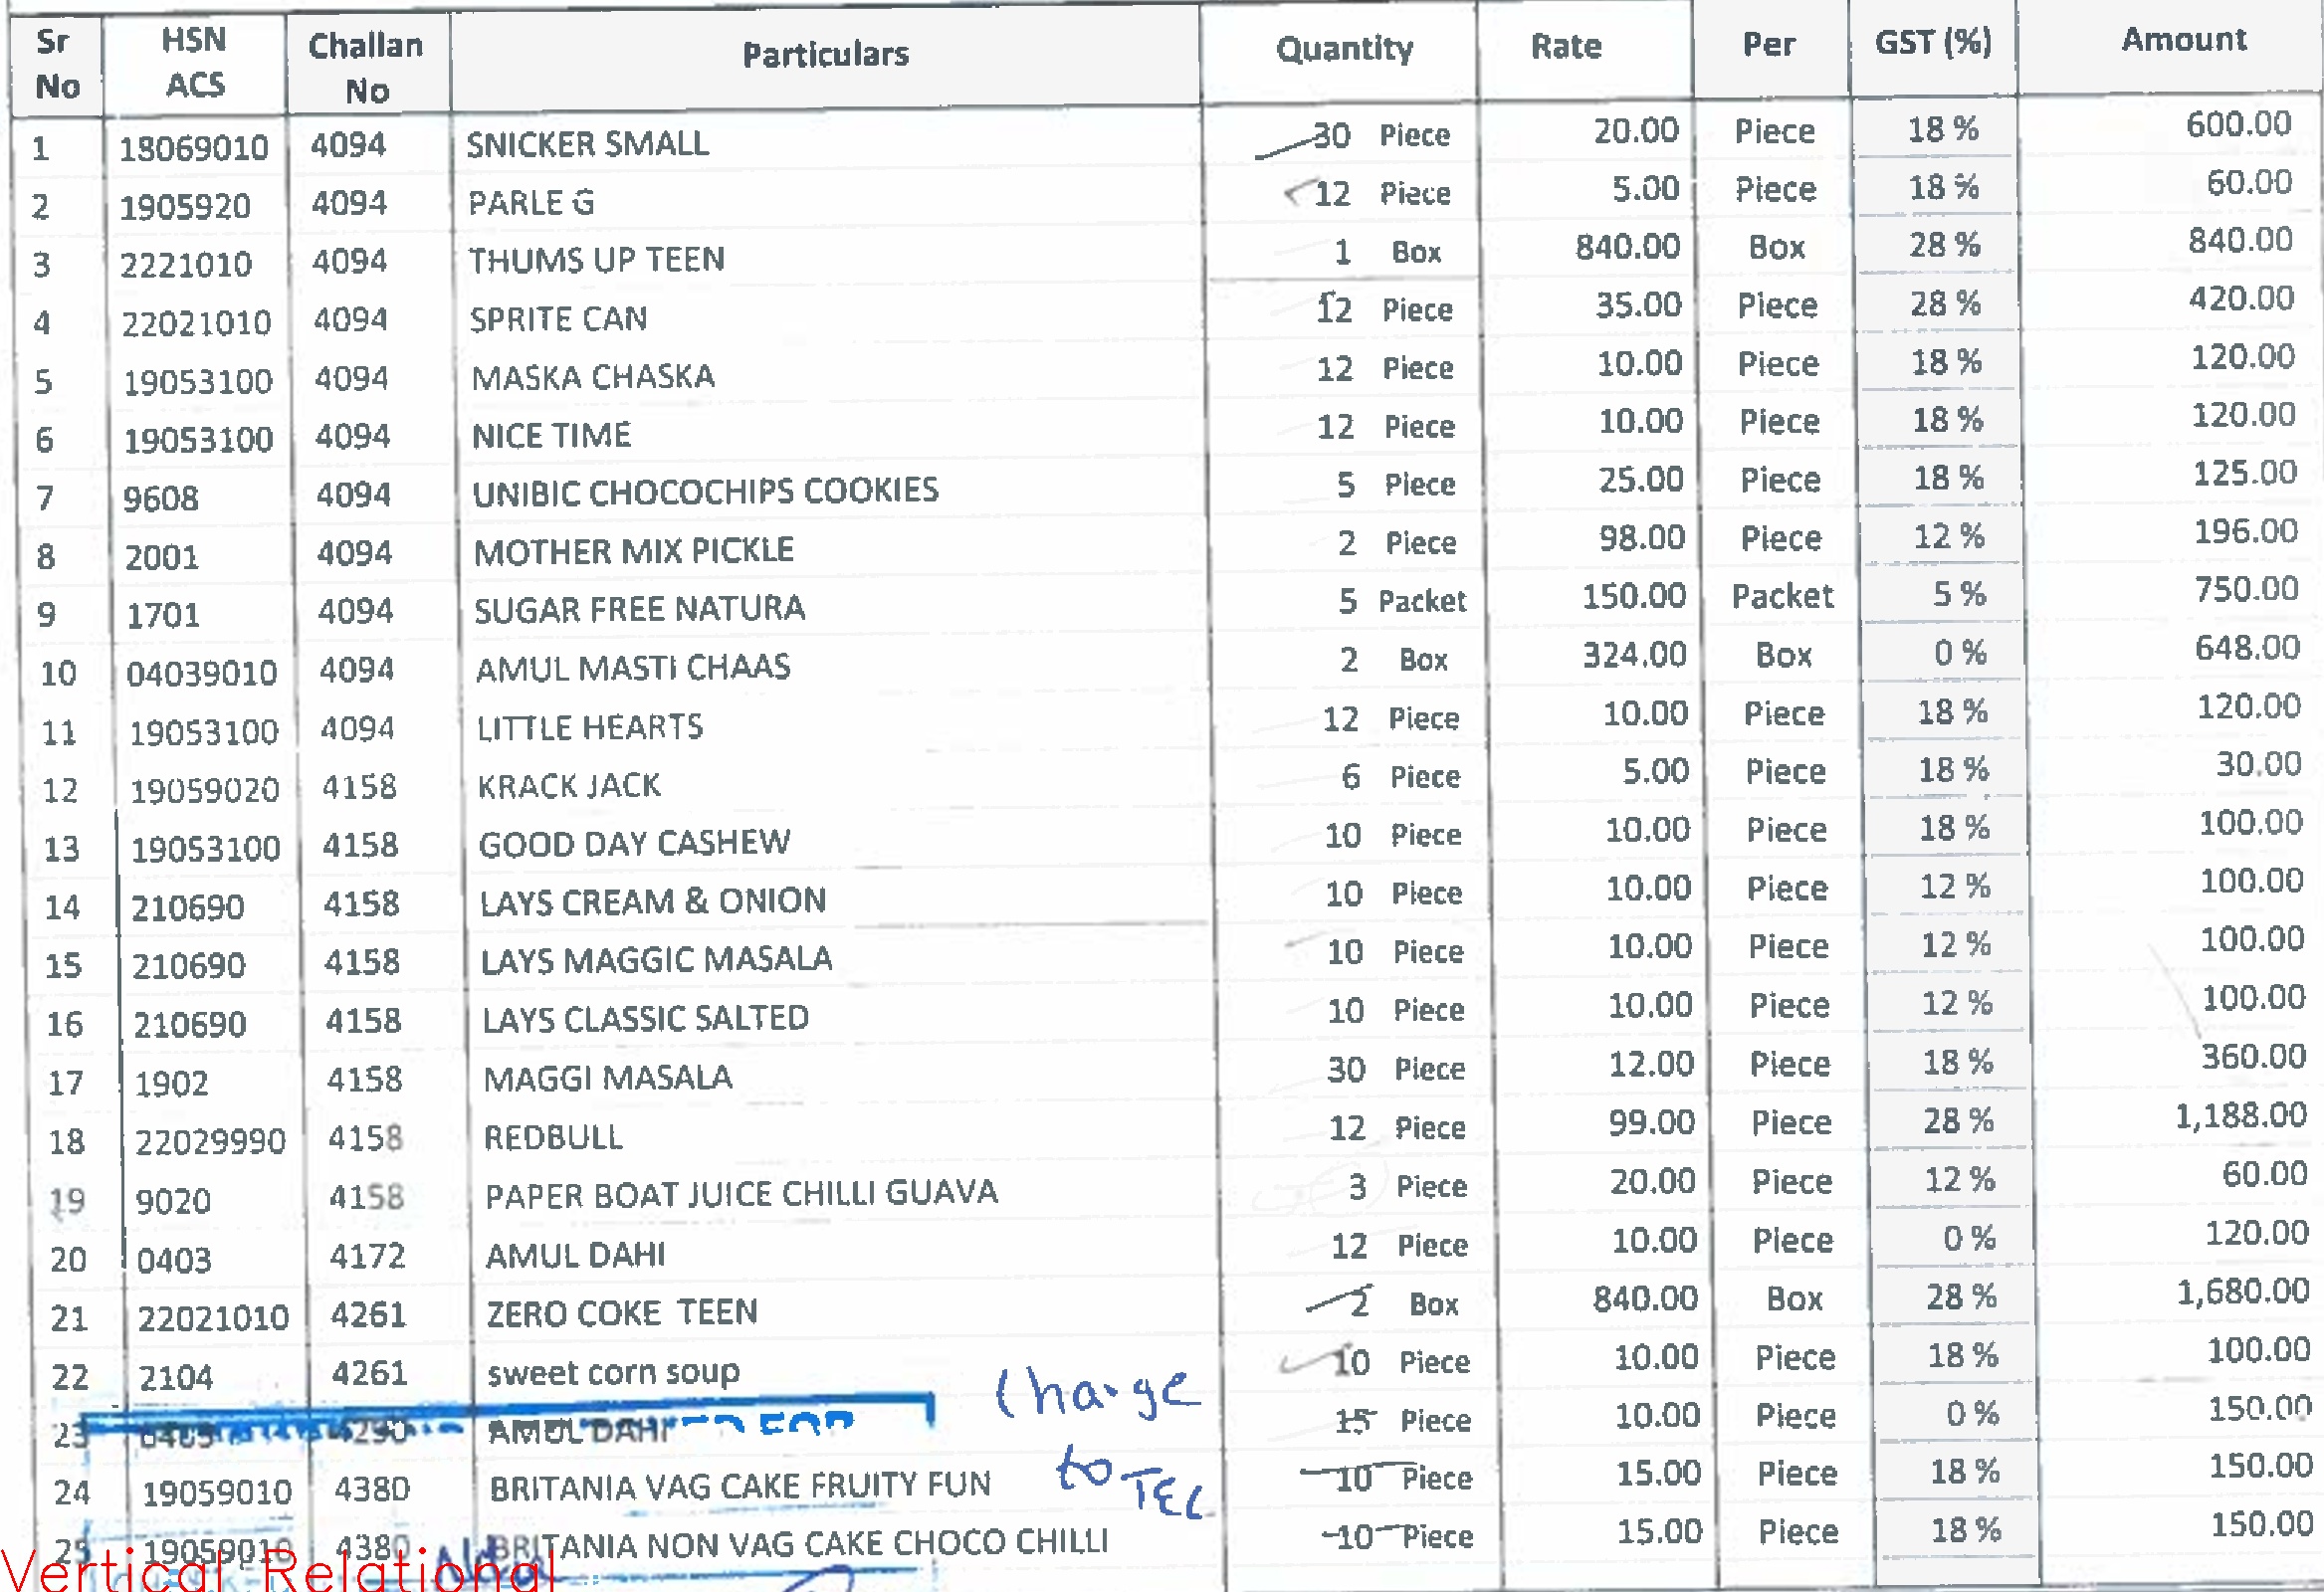
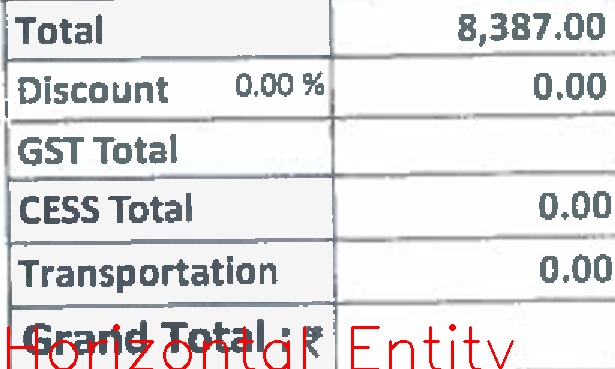
A Deep Learning API to classifiy type of detected bounding boxes.
Data can include structured documents such as invoices, reports and bank statements. Labeling of the data needs to be done using an image
annotation tool such as LabelImg. This API can also be used at the end of table detection model
such as Faster RCNN in a bounding-box detection and classification pipeline, which is where the inspiration for this API came from.
The data output by LabelImg should be in YOLO format, on which the denormalize method of the class can operate. If xml is chosen as the
output format, a separate function will need to be written to parse the files and extract bounding box coordinates.
All parameters for training/testing can be configured in config.ini file.
# NOTE: comment out the `training` or `load pretrained` as per requirement.


########################## get config
config = Config()
config.create_config('config.ini')

cc = ContainerClassifier()


######################### training

cc.read_train_data(path=config.train_data_folder_path,
	           resize_to=config.resize_to,
	           class_dict=config.class_dict,
	           use_labels=config.use_labels)

cc.train(model=config.architecture,
         epochs=config.epochs,
         batch_size=config.batch_size,
         optimizer=config.optimizer,
         summary=config.print_model_summary)

cc.save_model(name=config.model_name,
	      path=config.save_to_dir)


######################### load pretrained
cc.load_model(json_path=config.load_from_dir+'.json',
	      weights_path=config.load_from_dir+'.h5')


######################### testing
cc.read_test_data(path=config.test_data_folder_path,
	          resize_to=config.resize_to,
	          class_dict=config.class_dict,
	          use_labels=config.use_labels)

cc.test_model(output_dir=config.test_output_dir,
	      top_k=config.top_k,
	      plot_outputs=config.plot_outputs)
- Training data: 1020
- Arch: resnet101
- Image Size: 224x224
- Pretrained: False
- Epochs: 30
Classification Report:

			    	      precision    recall  f1-score   support

	vertical relational	   0       0.83      0.89      0.86        54
	horizontal entity	   1       0.97      0.82      0.89        39
	multiline text		   2       0.98      0.92      0.95       105
	other tabular		   3       0.68      0.62      0.65        24
	other		  	   4       0.61      0.91      0.73        33
	logo		  	   5       0.67      0.40      0.50        15

			    accuracy                           0.84       270
			   macro avg       0.79      0.76      0.76       270
			weighted avg       0.86      0.84      0.84       270


Confusion Matrix:

[[48  1  0  4  1  0]    0: vertical relational
 [ 4 32  0  3  0  0]    1: horizontal entity
 [ 0  0 97  0  8  0]    2: multiline text
 [ 6  0  2 15  1  0]    3: other tabular
 [ 0  0  0  0 30  3]    4: other
[ 0 0 0 0 9 6]] 5: logoThe Taxonomy to classify table types was inspired by the following paper:
- Kyosuke Nishida, Kugatsu Sadamitsu, Ryuichiro Higashinaka, Yoshihiro Matsuo - Understanding the Semantic Structures of Tables with a Hybrid Deep Neural Network Architecture - Proceedings of the Thirty-First AAAI Conference on Artificial Intelligence (AAAI-17) arXiv
The contents of this repo are covered under the MIT License.


