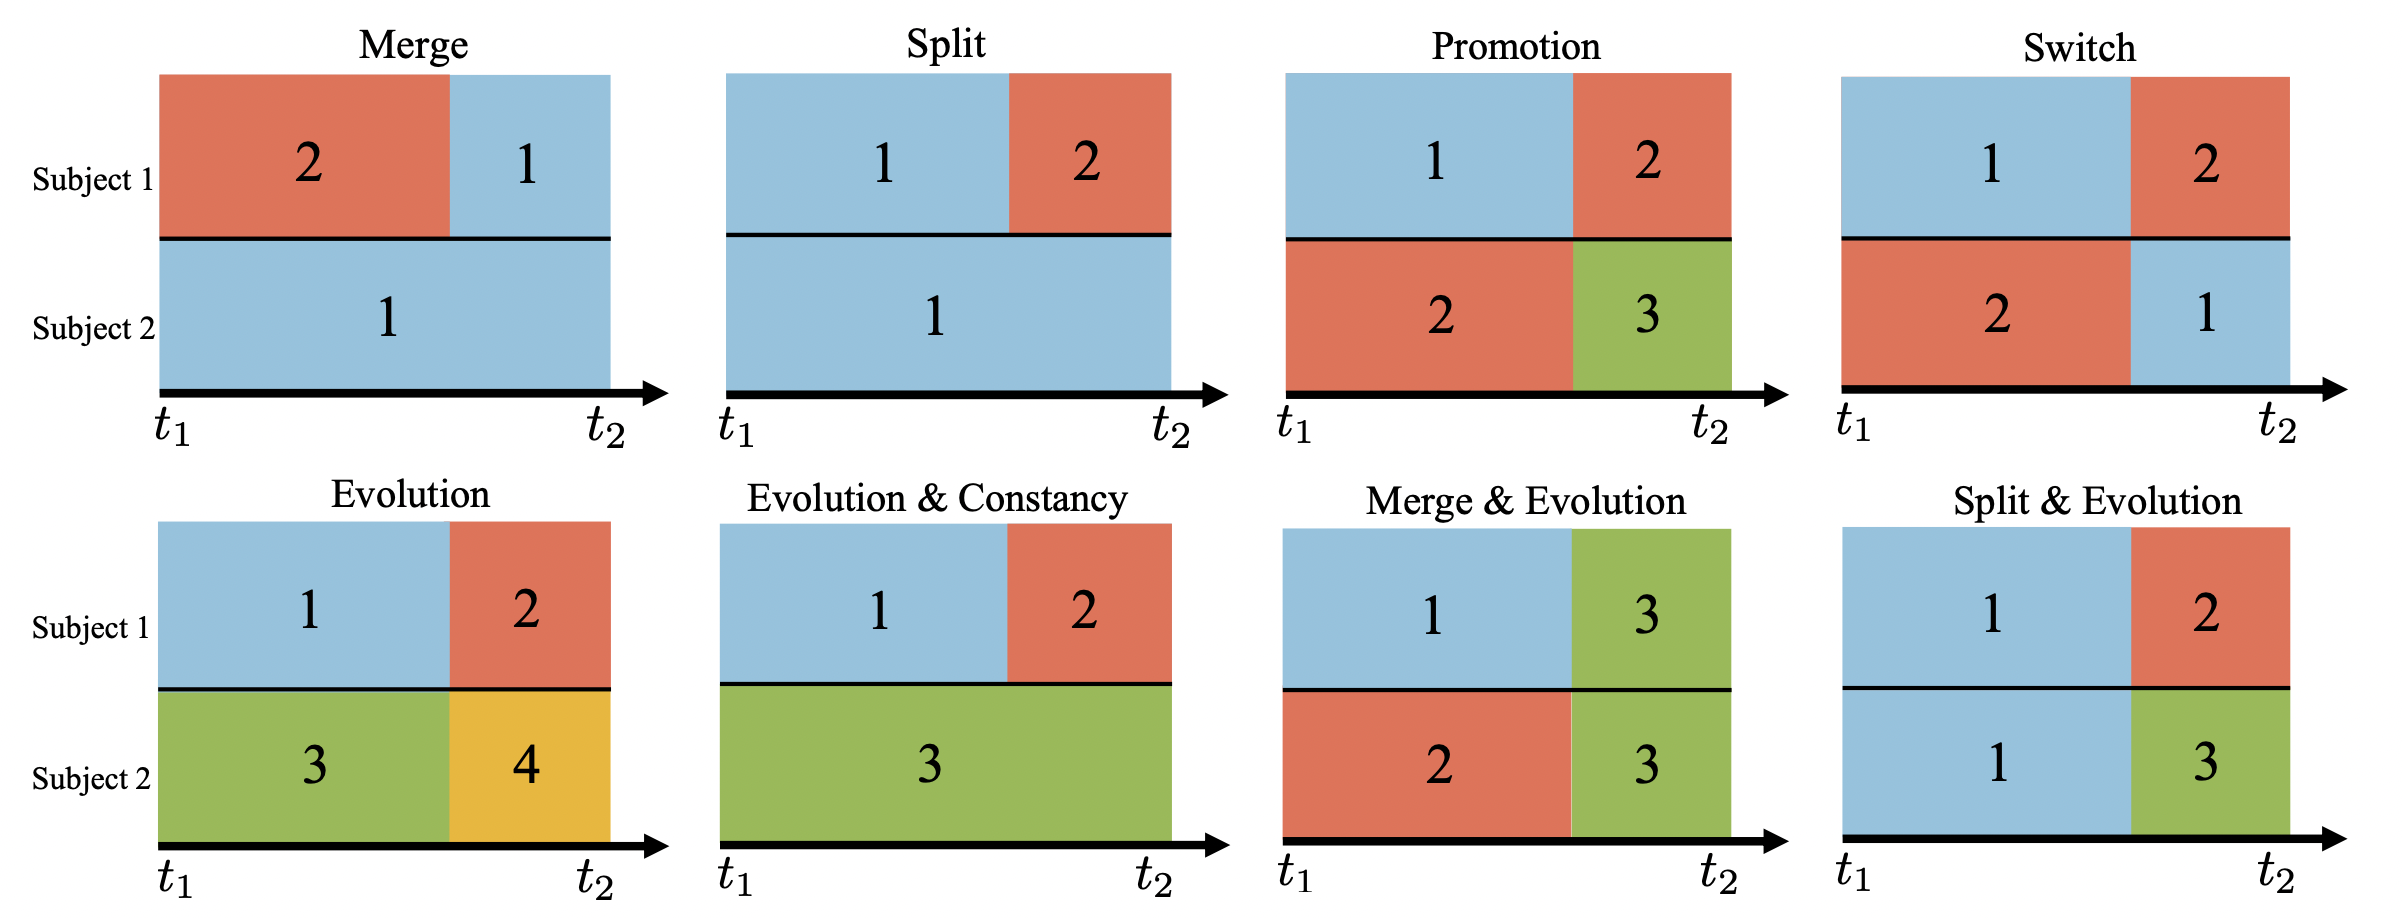
This repository contains the implementation for the paper "Doubly Non-homogeneous Reinforcement Learning" in Python (and R for plotting). The main challenge lies in that not only each subject can have their own system dynamics, but the system dynamics may evolve over time for each subject. In this work, we assume that at each time point, subjects can be grouped into clusters defined by their system dynamics. We provide some concrete examples with two subjects and a single change point (including merge, split, promotion, evolution, etc.) to elaborate.
Figure 1: Basic building blocks with two subjects (one in each row) and a single change point. Different dynamics are represented by distinct colors.
-
Folder
functions/: This folder contains all utility Python functions used in numerical experiments including simulation and data analysissimu_mean_detectimplements the proposed change point and cluster detection method for Non-homogeneous environment.compute_test_statistics_separateA.pycomputes the optimal policy.evaluation.pyimplements the evaluation procedure. Specifically, it contains functions for estimating the optimal policy and estimating the value of the policy using fitted-Q evaluation.simulate_data_1d.pygenerates data in 1-dimensional simulation. It contains functions to simulate data in s scenarios of different transition.simulate_data_1d_flexible.pygenerated data in 1-dimensional simulation with more flexibility.
-
Folder
simulations/: This folder contains the platform that realizes the 1-dimensional simulation in the paper. Files starting withplotin their names contain codes to generate plots in the paper.- Folder
final_perf/: This folder contains the code for offline estimation in Section 5.1.1 and Section 5.1.2.run_maxiter.pysimulates 1-dimensional data with different-sign transition functions and test for double non-homogeneity. Usage:
See the annotation in the script for the meanings of arguments. Example:python 01_sim_1d_run.py {init} {N} {T} {setting} {nthread} {cov} {threshold_type} {K} {max_iter} {random_cp}python 01_sim_1d_run.py kmeans 50 50 pwconst2 8 0.25 maxcusum 2 10 0run_maxiter_samesign.pysimulates 1-dimensional data with same-sign transition functions and test for double non-homogeneity.collect_results.pycollect simulation results of the performance of the proposed method to generate Figure 3 and Figure 4 in the paper.collect_results.pycollect simulation results of the performance of the proposed method given numbers of clusters when the transition functions of the two clusters have the same sign on the interaction term.plot_fig3_cp.pycreates Figure 3 of the estimation performance the proposed method given different initial change point locations.plot_fig4_cp.pycreates Figure 4 of the estimation performance the proposed method given different numbers of clusters.- To run the 1-dimensional simulation in sequence,
bash create_maxiter.sh
bash create_maxiter_samesign.sh
- Folder
value/: This folder contains the code for online evaluation in Section 5.1.2.run_value.pyestimates the value of different policies in environment where different clusters have different signs on the interaction term in the transition functions.run_value_samesign.pyestimates the value of different policies in environment where different clusters have the same sign in the interaction term in the transition functions.collect_results.pycollect simulation results of the value of the proposed method when the transition functions of the two clusters have different signs on the interaction term.collect_results_samesign.pycollect simulation results of the value of the proposed method when the transition functions of the two clusters have the same sign on the interaction term.plot_fig5_supp1_value.pycreates Figure 5 in the paper and the Figure 1 in the supplement of value difference distribution.- To run the evaluation in sequence,
bash create_value.sh
bash create_value.samesign.sh
- Folder
-
Folder
outputcontains raw results and corresponding figures of the simulation in the paper.
