Original Repo - https://github.com/paaacman/promstack
promstack (from dockprom)
A monitoring solution for Docker hosts and containers with Prometheus, Grafana, cAdvisor, NodeExporter, alerting with AlertManager and Loki.
If you're looking for a Docker Swarm version please go to stefanprodan/swarmprom
See promstack-exporters project for a client to install on other machines to monitor.
Clone this repository on your Docker host, cd into promstack directory and run compose up:
git clone https://github.com/paaacman/promstack
cd promstack

GF_SECURITY_ADMIN_USER=admin GF_SECURITY_ADMIN_PASSWORD=admin docker-compose up -d
Prerequisites:
- Docker Engine >= 1.13
- Docker Compose >= 1.11
Containers:
- Prometheus (metrics database)
http://<host-ip>:9090 - AlertManager (alerts management)
http://<host-ip>:9093 - Grafana (visualize metrics)
http://<host-ip>:3000 - NodeExporter (host metrics collector)
- cAdvisor (containers metrics collector)
- blackboxexporter (monitor website availability)
http://<host-ip>:9115 - loki (log aggregation)
http://<host-ip>:3100 - promtail (get log files)
Files to personalize :
- .env (from .env.dist). If you change Prometheus port, change it manually in Grafana dashboards.
alertmanager/alertmanager.yml(from alertmanager/alertmanager.yml.dist) for slack (or others) notifications.prometheus/blackbox_targets.yml(from prometheus/blackbox_targets.yml.dist) to monitor URL availability.prometheus/exporters/your_targets.json,prometheus/exporters/passwordandprometheus/exporters/ca.pemif you use prometheusexternalscrape_configs. (see prometheus/prometheus.yml and https://prometheus.io/docs/guides/file-sd/)
Navigate to http://<host-ip>:3000 and login with user admin password admin. You can change the credentials in the compose file or by supplying the GF_SECURITY_ADMIN_USER and GF_SECURITY_ADMIN_PASSWORD environment variables on compose up. The config file can be added directly in grafana part like this.
You can also set those environment variables in a .env file.
grafana:
  image: grafana/grafana:7.2.0
  env_file:
    - config
and the config file format should have this content
GF_SECURITY_ADMIN_USER=admin
GF_SECURITY_ADMIN_PASSWORD=changeme
GF_USERS_ALLOW_SIGN_UP=false
If you want to change the password, you have to remove this entry, otherwise the change will not take effect
- grafana_data:/var/lib/grafana
Grafana is preconfigured with dashboards and Prometheus as the default data source:
- Name: Prometheus
- Type: Prometheus
- Url: http://prometheus:9090
- Access: proxy
Docker Host Dashboard
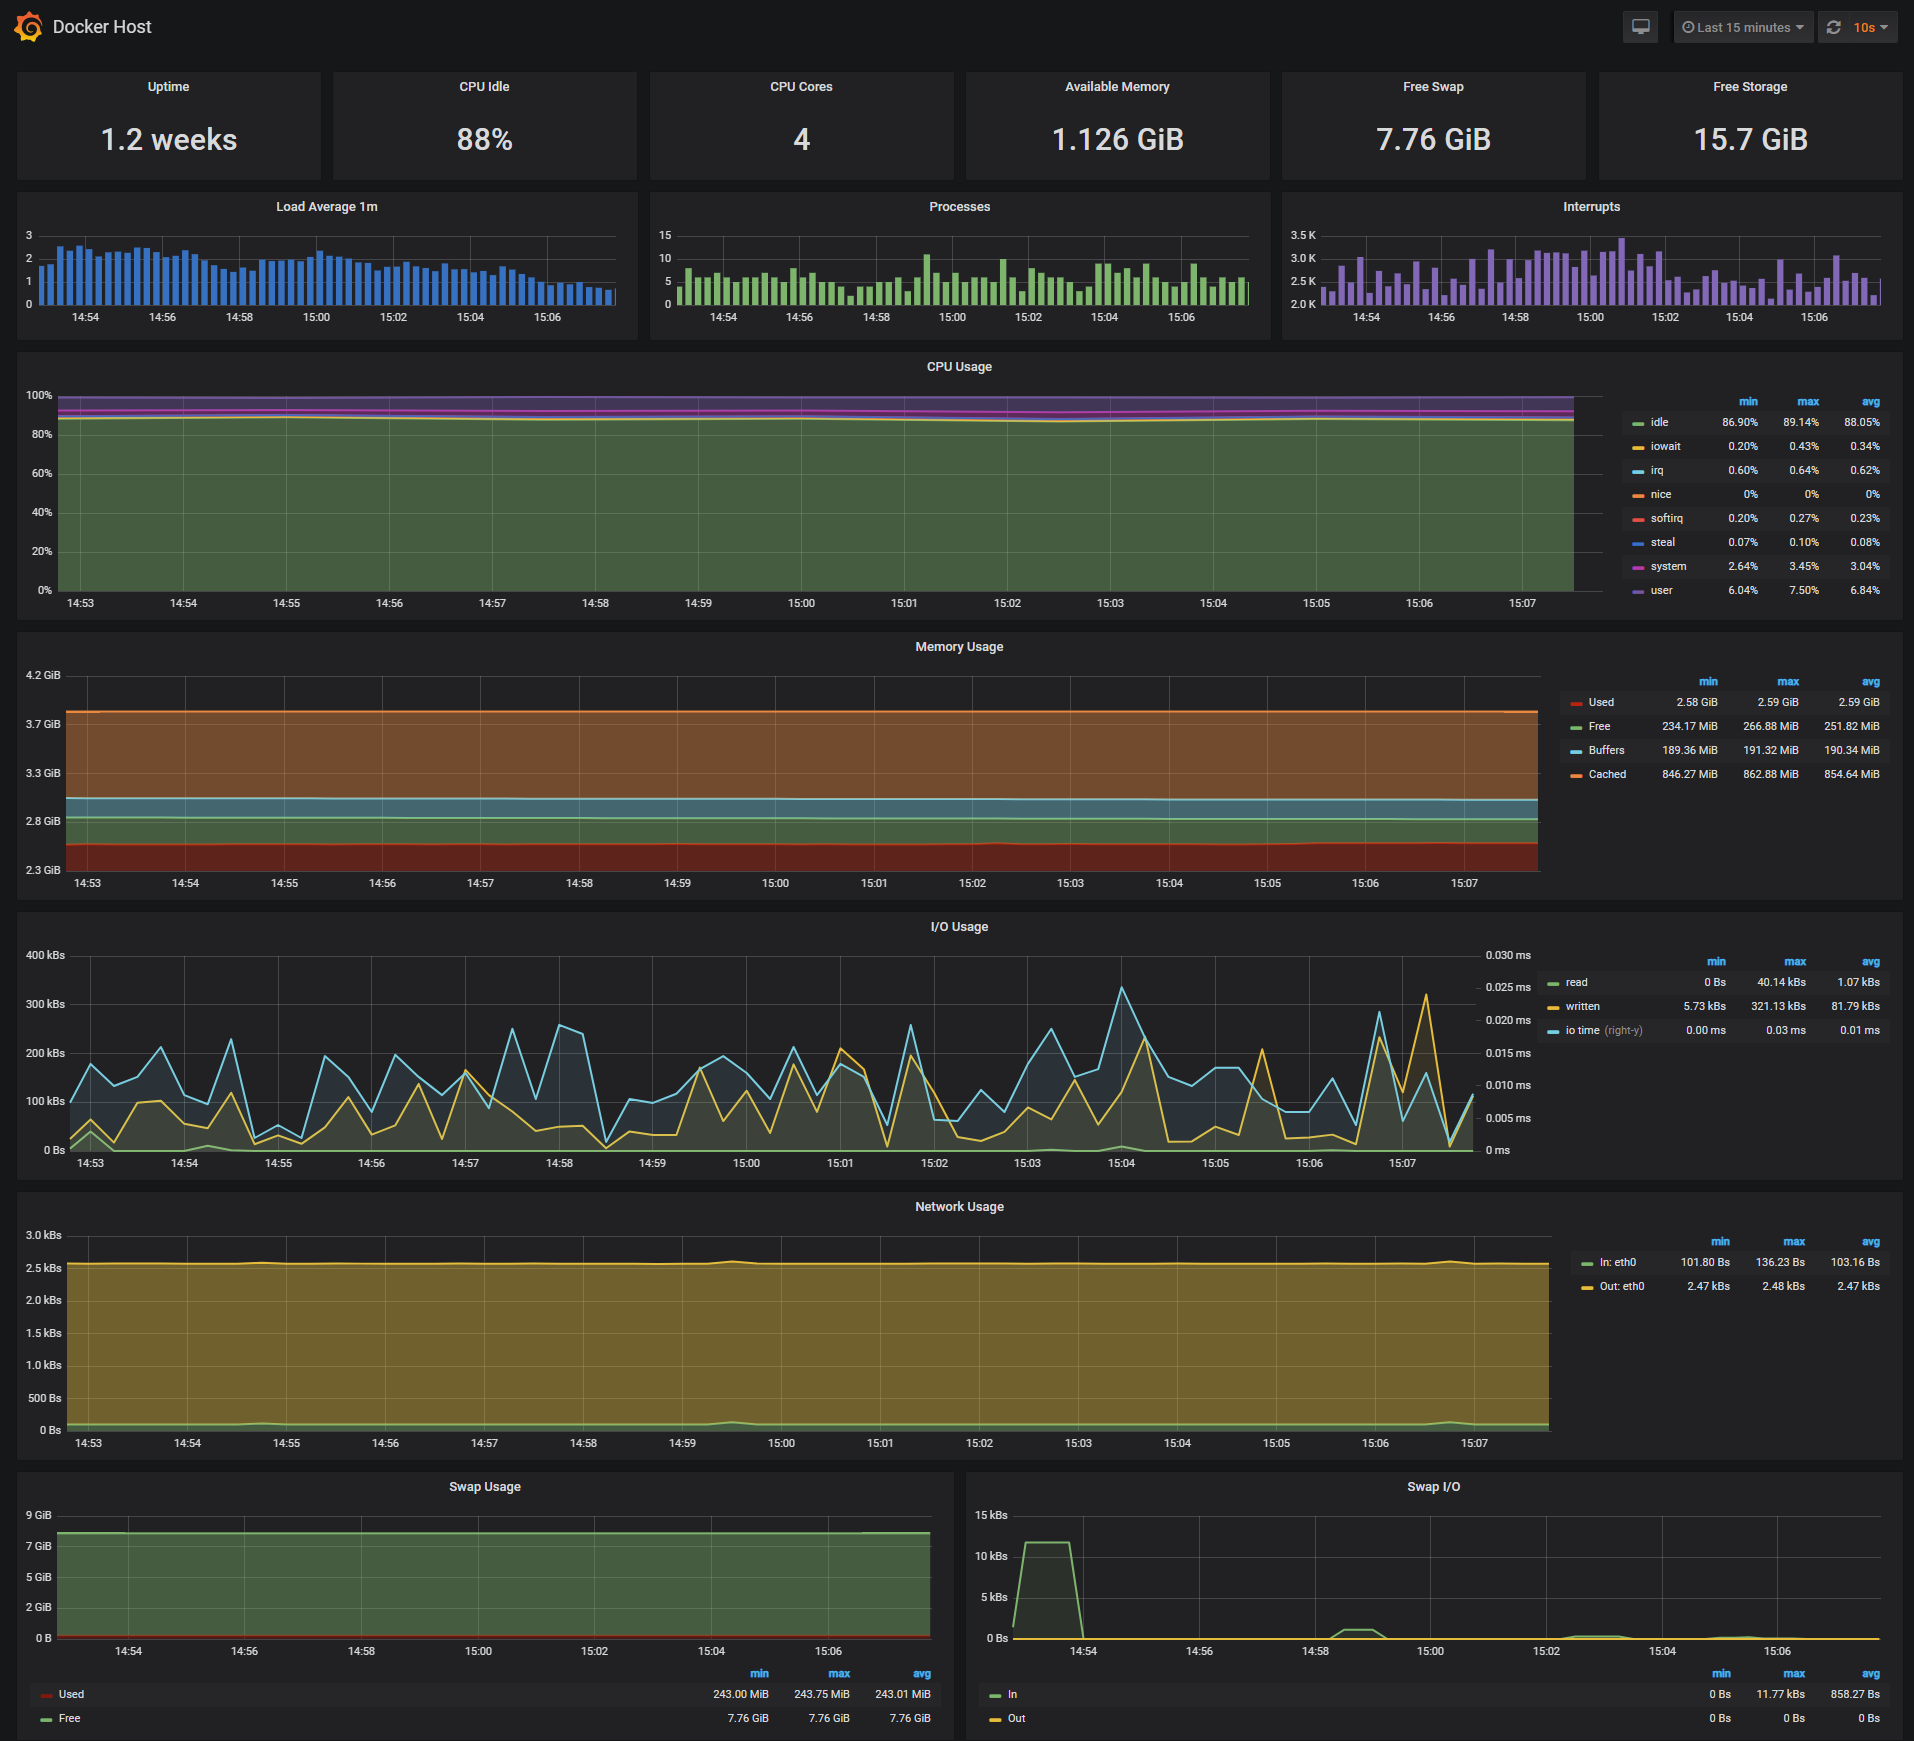
The Docker Host Dashboard shows key metrics for monitoring the resource usage of your server:
- Server uptime, CPU idle percent, number of CPU cores, available memory, swap and storage
- System load average graph, running and blocked by IO processes graph, interrupts graph
- CPU usage graph by mode (guest, idle, iowait, irq, nice, softirq, steal, system, user)
- Memory usage graph by distribution (used, free, buffers, cached)
- IO usage graph (read Bps, read Bps and IO time)
- Network usage graph by device (inbound Bps, Outbound Bps)
- Swap usage and activity graphs
For storage and particularly Free Storage graph, you have to specify the fstype in grafana graph request.
You can find it in grafana/dashboards/docker_host.json, at line 480 :
"expr": "sum(node_filesystem_free_bytes{fstype=\"btrfs\"})",
I work on BTRFS, so i need to change aufs to btrfs.
You can find right value for your system in Prometheus http://<host-ip>:9090 launching this request :
node_filesystem_free_bytes
Docker Containers Dashboard
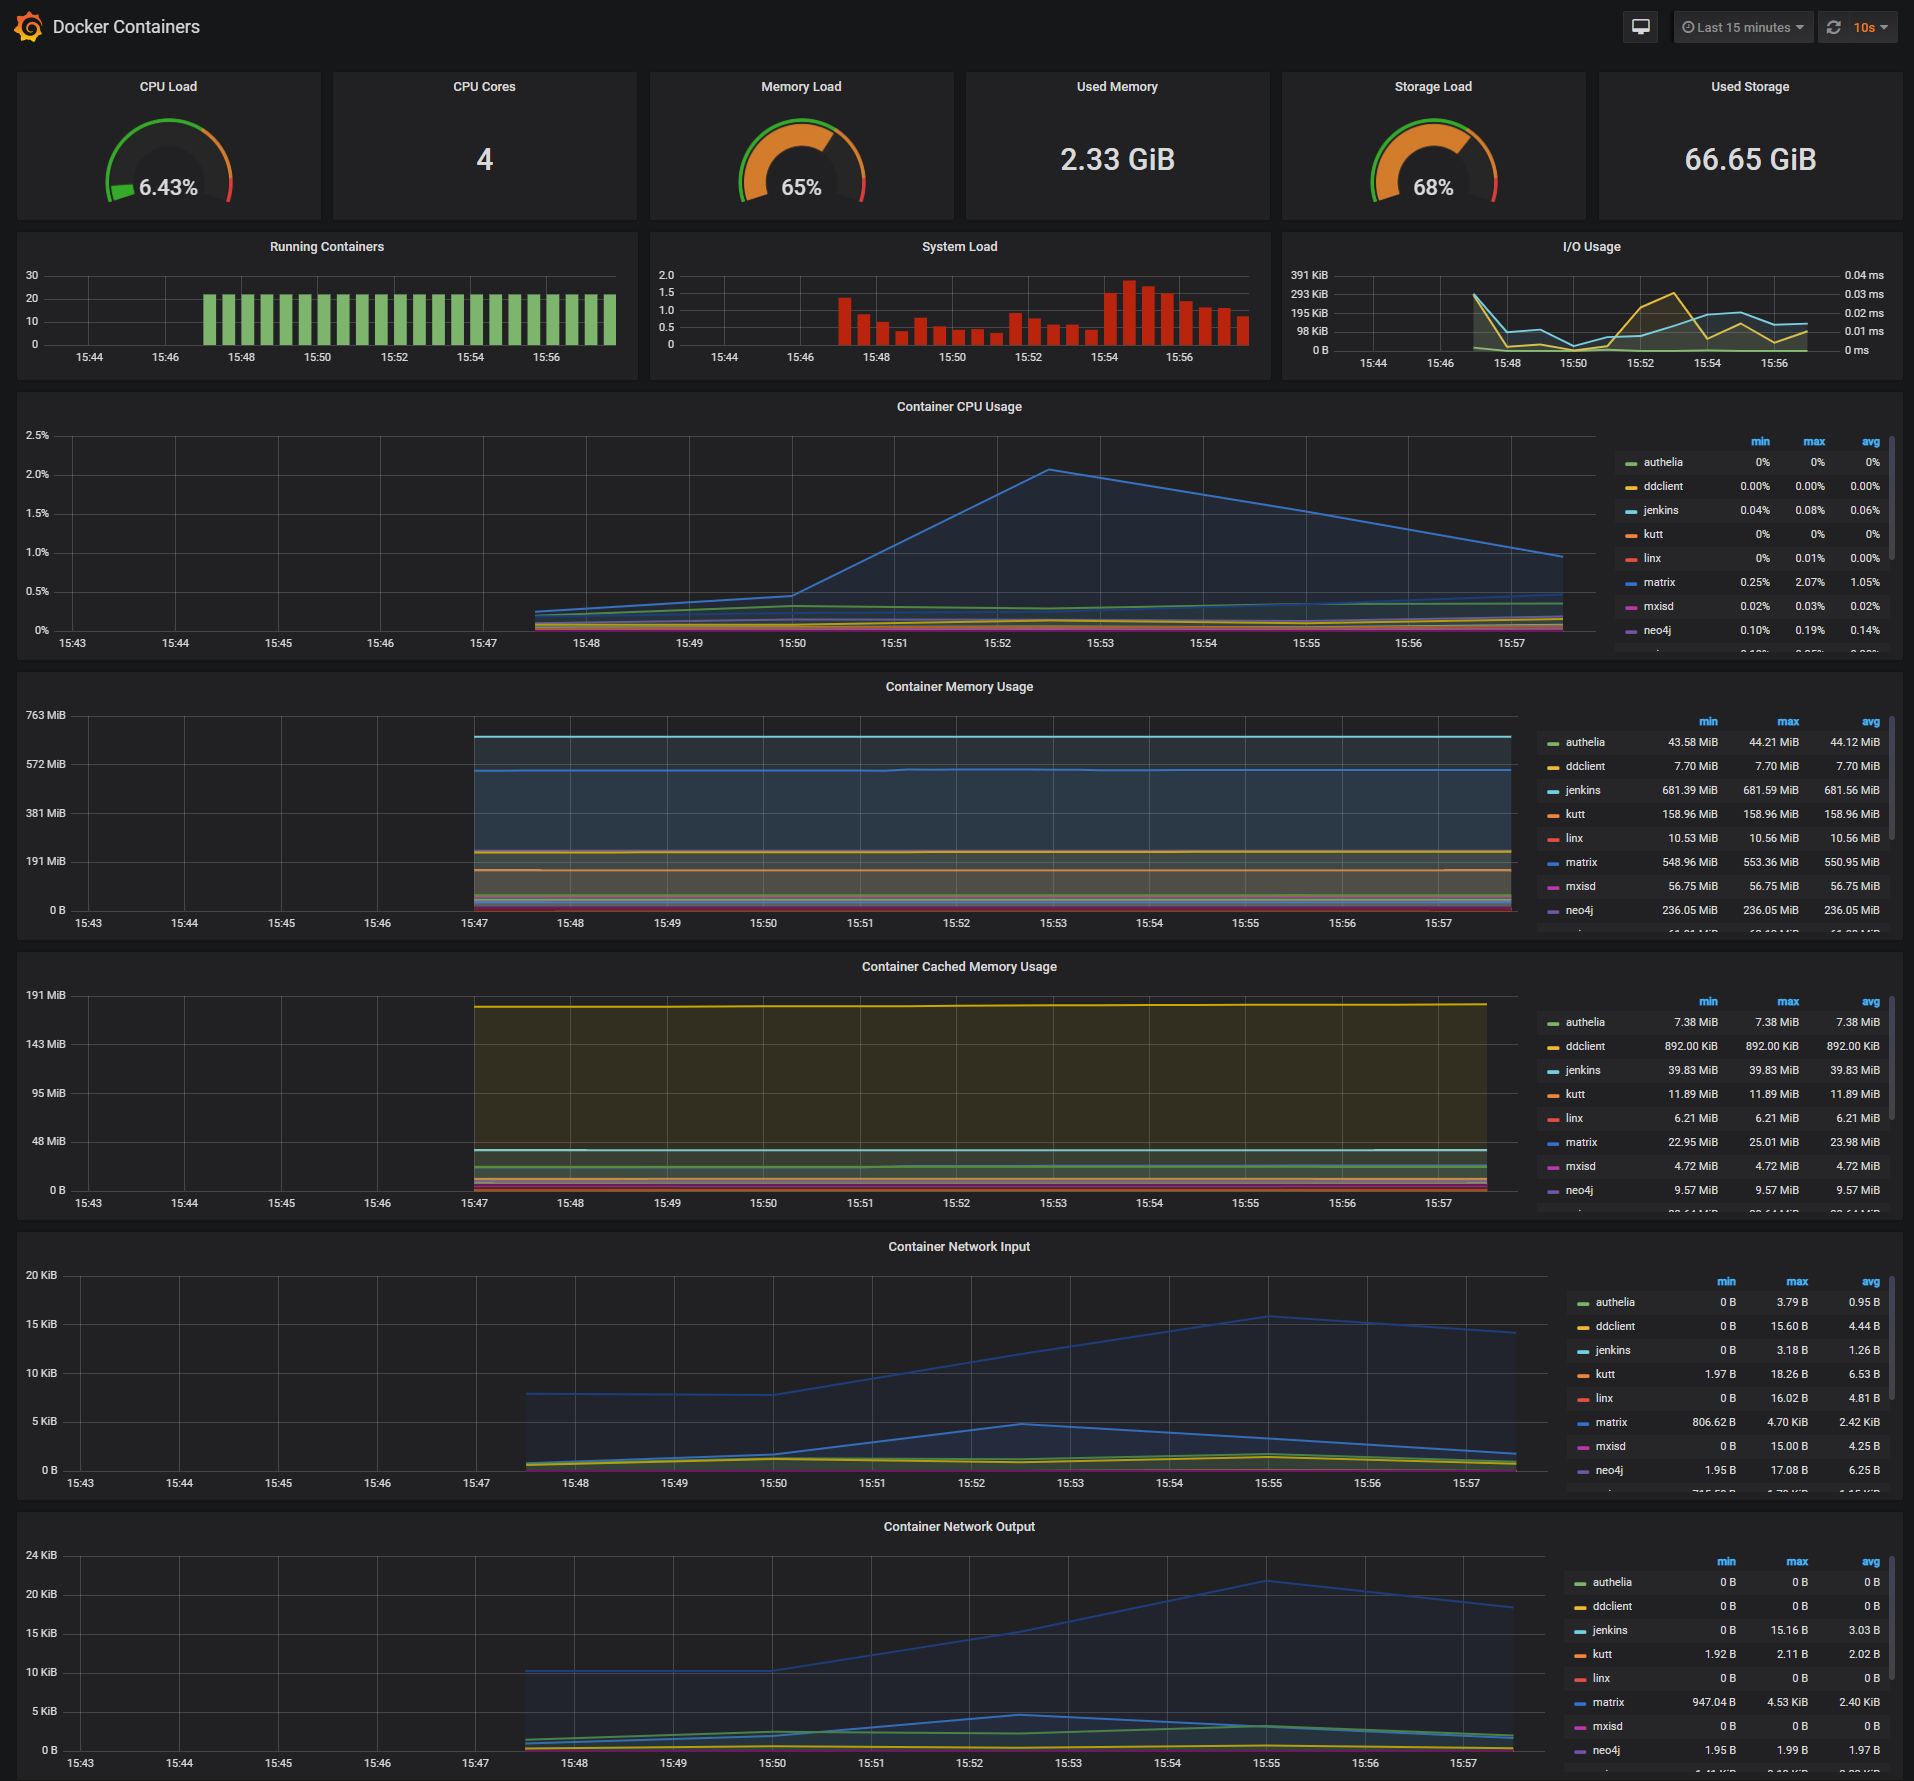
The Docker Containers Dashboard shows key metrics for monitoring running containers:
- Total containers CPU load, memory and storage usage
- Running containers graph, system load graph, IO usage graph
- Container CPU usage graph
- Container memory usage graph
- Container cached memory usage graph
- Container network inbound usage graph
- Container network outbound usage graph
Note that this dashboard doesn't show the containers that are part of the monitoring stack.
Monitor Services Dashboard
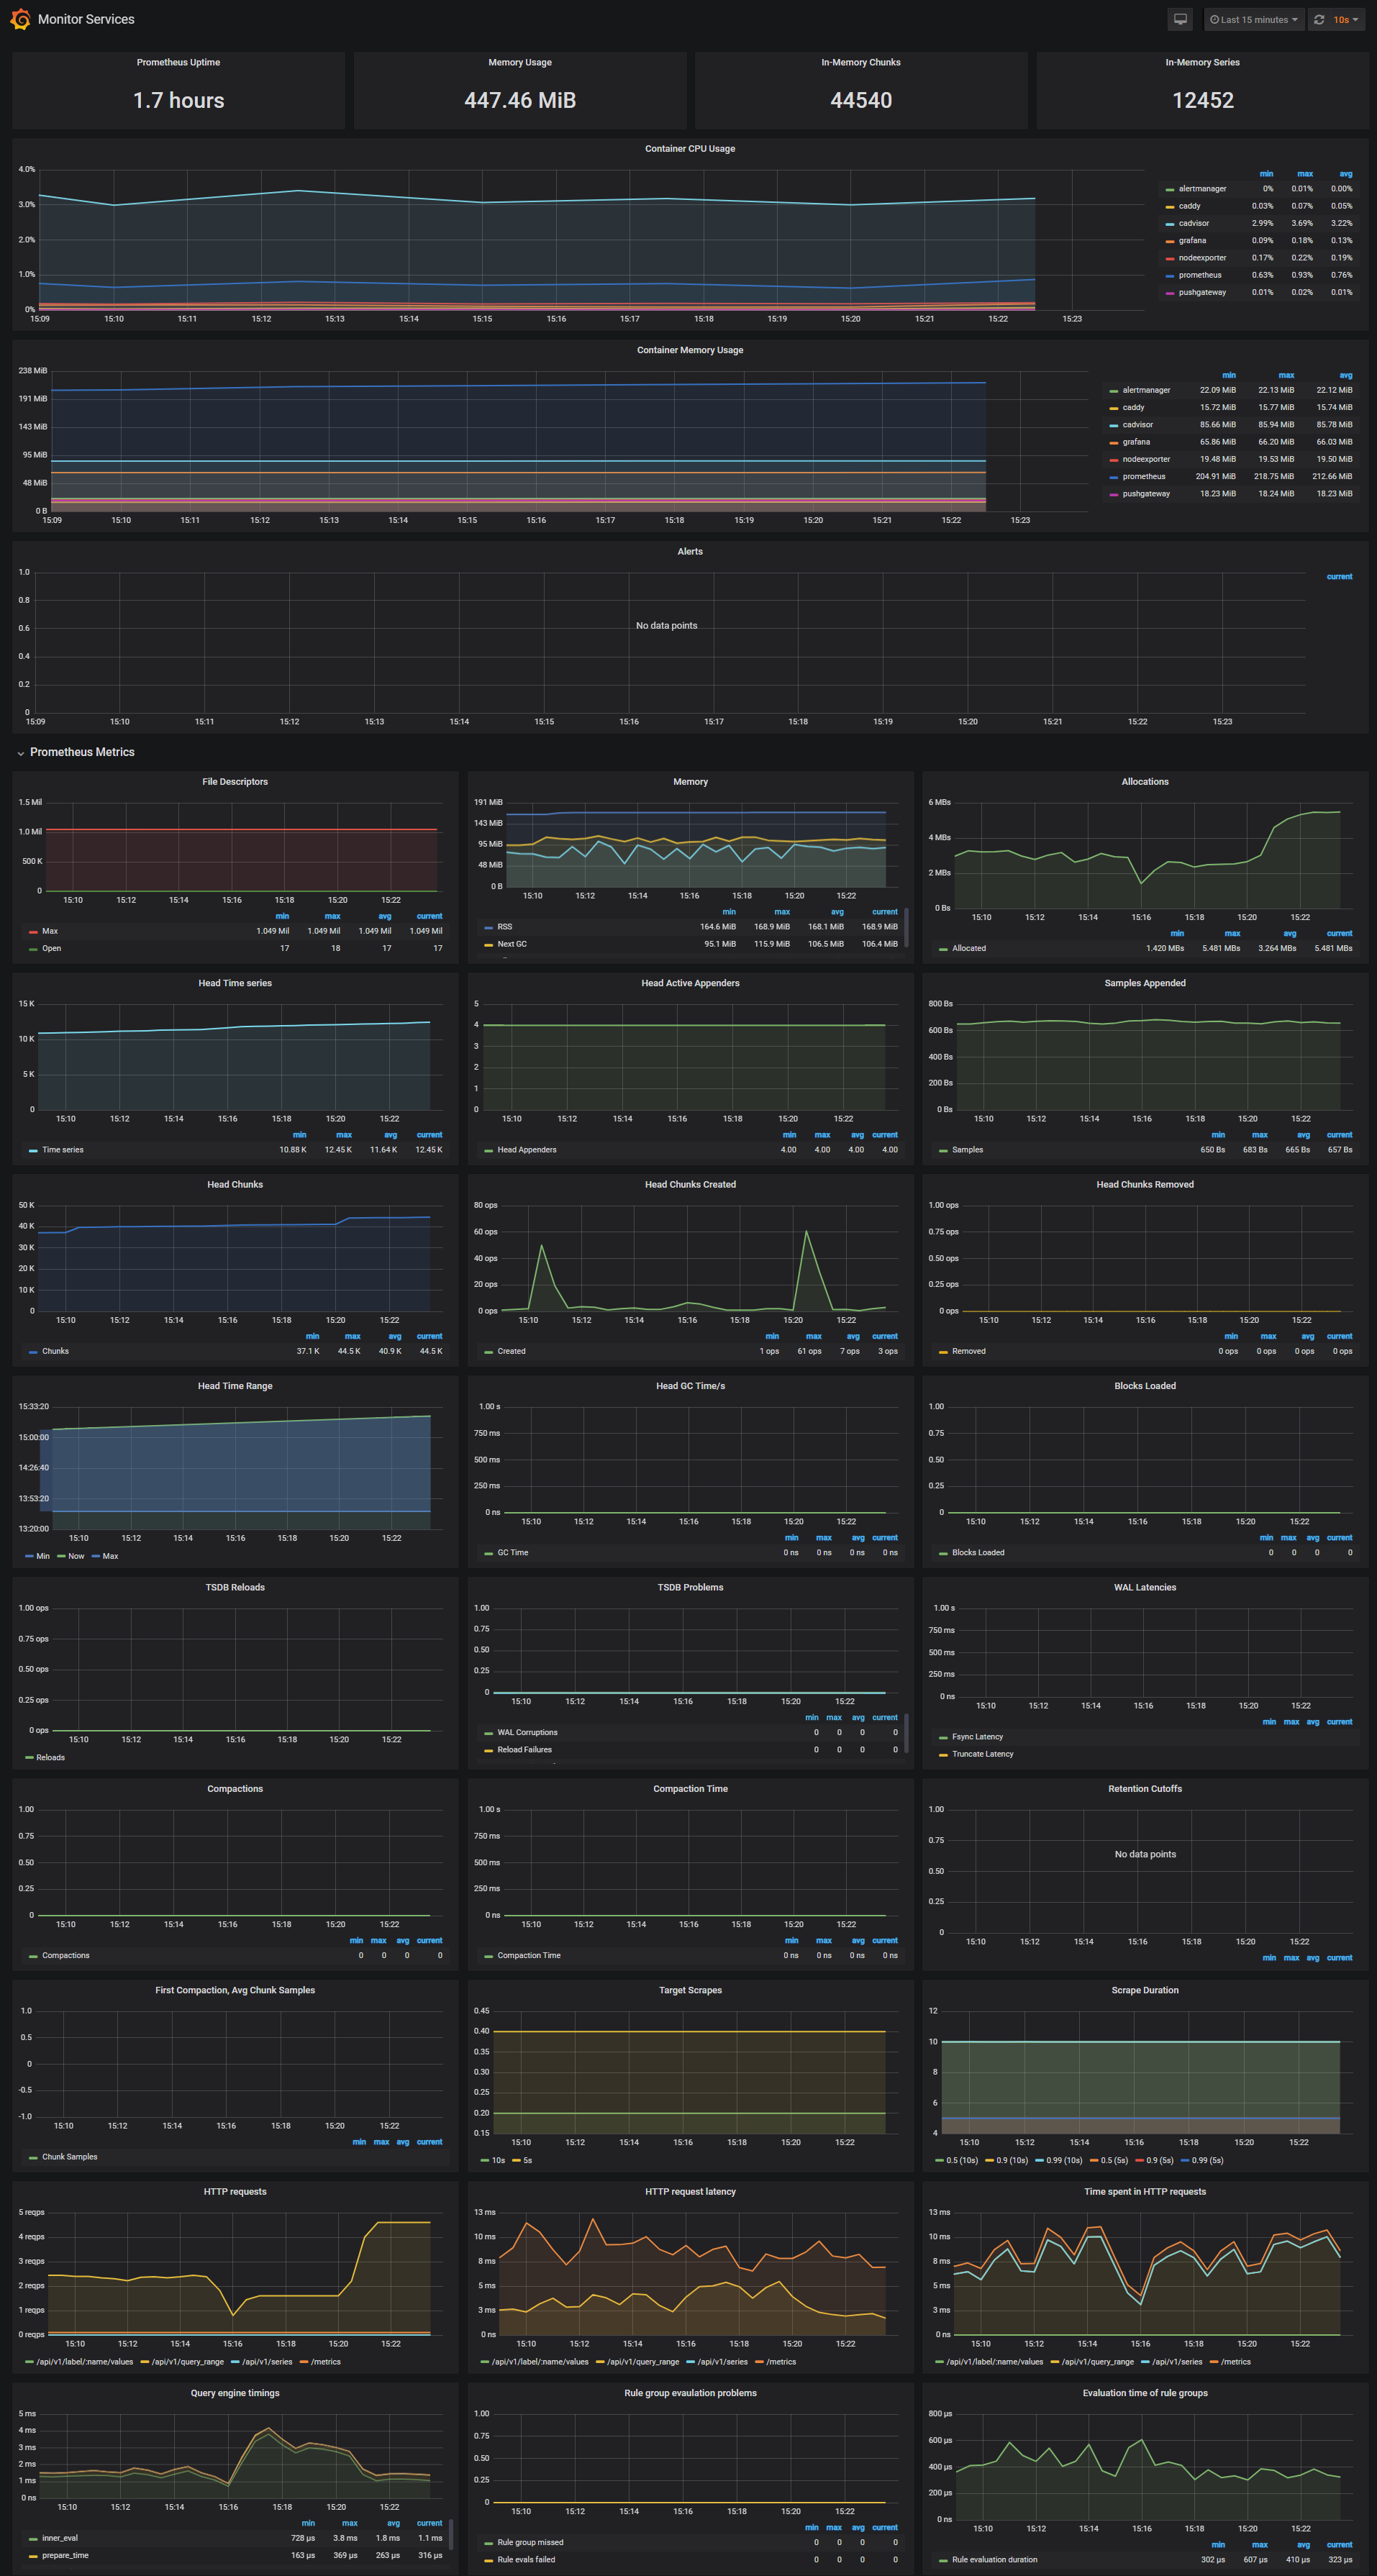
The Monitor Services Dashboard shows key metrics for monitoring the containers that make up the monitoring stack:
- Prometheus container uptime, monitoring stack total memory usage, Prometheus local storage memory chunks and series
- Container CPU usage graph
- Container memory usage graph
- Prometheus chunks to persist and persistence urgency graphs
- Prometheus chunks ops and checkpoint duration graphs
- Prometheus samples ingested rate, target scrapes and scrape duration graphs
- Prometheus HTTP requests graph
- Prometheus alerts graph
Blackbox Dashboard
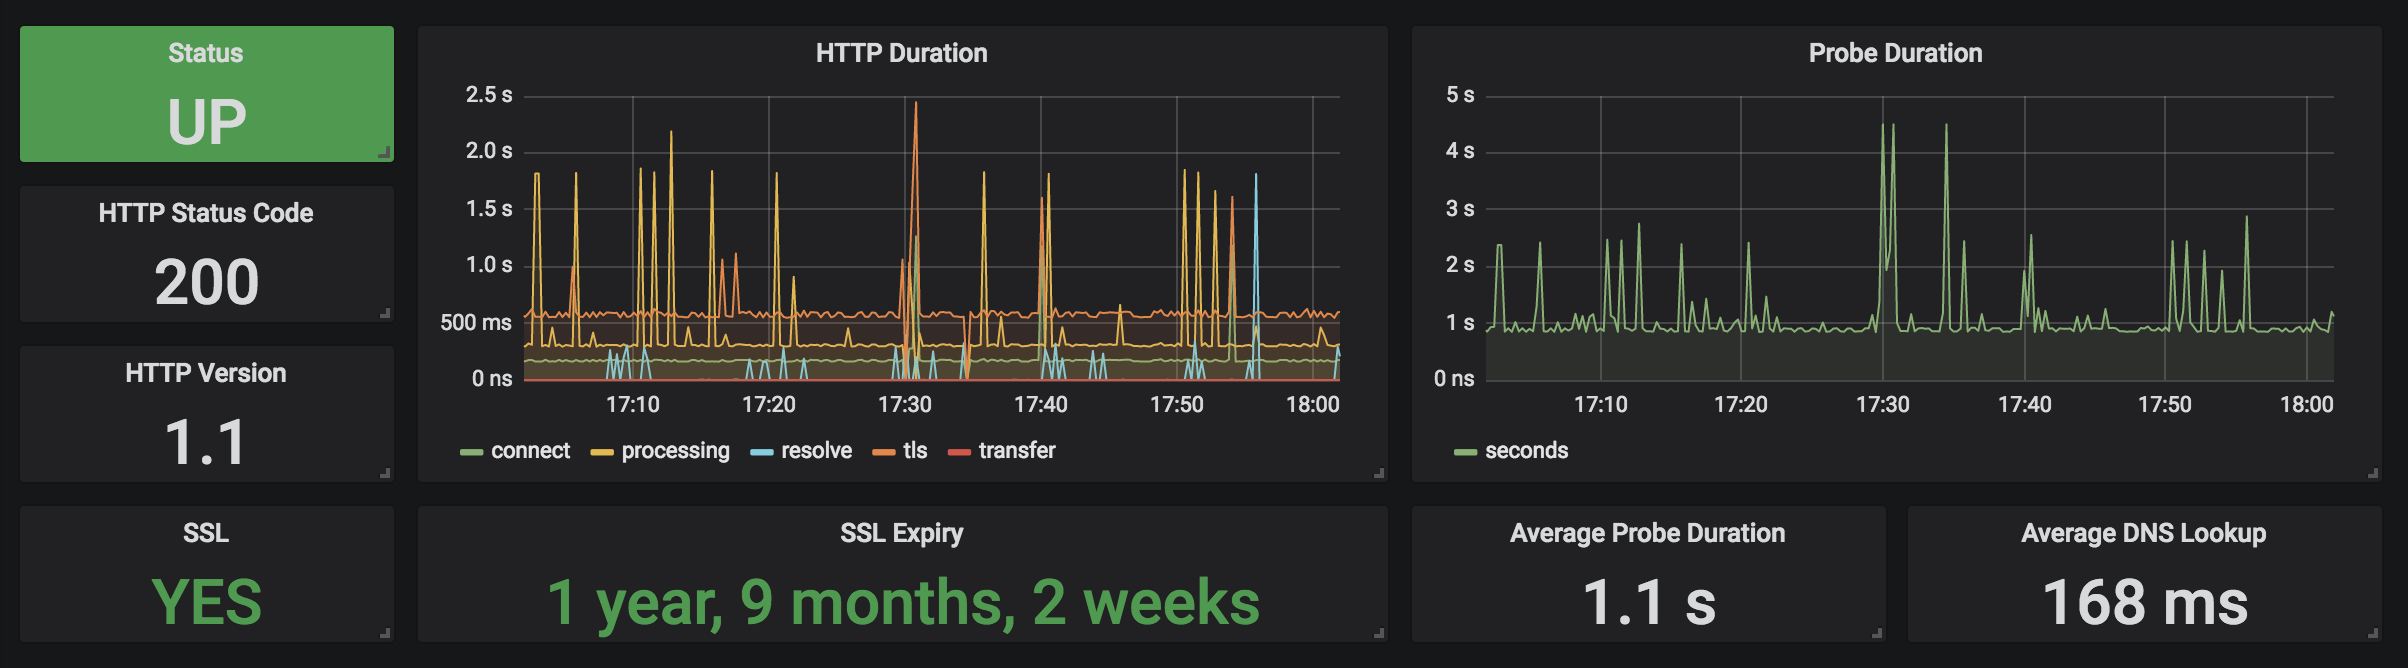
See the original dashboard: https://grafana.com/grafana/dashboards/7587.
The Blackbox Dashboard shows key metrics for monitoring the containers that make up the monitoring stack:
- Prometheus container uptime, monitoring stack total memory usage, Prometheus local storage memory chunks and series
- Container CPU usage graph
- Container memory usage graph
- Prometheus chunks to persist and persistence urgency graphs
- Prometheus chunks ops and checkpoint duration graphs
- Prometheus samples ingested rate, target scrapes and scrape duration graphs
- Prometheus HTTP requests graph
- Prometheus alerts graph
Three alert groups have been setup within the alert.rules.yml configuration file:
- Monitoring services alerts targets
- Docker Host alerts host
- Docker Containers alerts containers
First, create the prometheus/alert.rules.yml file.
You can check rules with docker-compose exec prometheus promtool check rules /etc/prometheus/alert.rules.yml
Most alerts come from here : https://awesome-prometheus-alerts.grep.to/rules.html#prometheus-self-monitoring
To test alerts slack message, you can use this service: https://juliusv.com/promslack/
You can modify the alert rules and reload them by making a HTTP POST call to Prometheus:
curl -X POST http://admin:admin@<host-ip>:9090/-/reload
The AlertManager service is responsible for handling alerts sent by Prometheus and Loki servers. AlertManager can send notifications via email, Pushover, Slack, HipChat or any other system that exposes a webhook interface. A complete list of integrations can be found here.
First create the alertmanager/alertmanager.yml file.
You can view and silence notifications by accessing http://<host-ip>:9093.
The notification receivers can be configured in alertmanager/config.yml file.
To receive alerts via Slack you need to make a custom integration by choose incoming web hooks in your Slack team app page. You can find more details on setting up Slack integration here.
Copy the Slack Webhook URL into the api_url field and specify a Slack channel.
route:
    receiver: 'slack'

receivers:
    - name: 'slack'
      slack_configs:
          - send_resolved: true
            text: "{{ .CommonAnnotations.description }}"
            username: 'Prometheus'
            channel: '#<channel>'
            api_url: 'https://hooks.slack.com/services/<webhook-id>'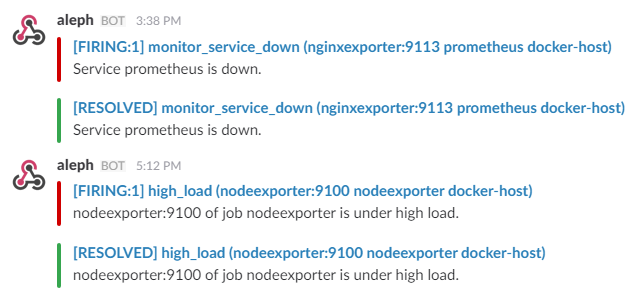
The blackbox exporter allows blackbox probing of endpoints over HTTP, HTTPS, DNS, TCP and ICMP. See https://github.com/prometheus/blackbox_exporter.
Add targets you want to monitor in prometheus/blackbox_targets.yml.
To change ownership of the files run your grafana container as root and modify the permissions.
First perform a docker-compose down then modify your docker-compose.yml to include the user: root option:
  grafana:
    image: grafana/grafana:5.2.2
    container_name: grafana
    volumes:
      - grafana_data:/var/lib/grafana
      - ./grafana/datasources:/etc/grafana/datasources
      - ./grafana/dashboards:/etc/grafana/dashboards
      - ./grafana/setup.sh:/setup.sh
    entrypoint: /setup.sh
    user: root
    environment:
      - GF_SECURITY_ADMIN_USER=${GF_SECURITY_ADMIN_USER:-admin}
      - GF_SECURITY_ADMIN_PASSWORD=${GF_SECURITY_ADMIN_PASSWORD:-admin}
      - GF_USERS_ALLOW_SIGN_UP=false
    restart: unless-stopped
    expose:
      - 3000
    networks:
      - monitor-net
    labels:
      org.label-schema.group: "monitoring"
Perform a docker-compose up -d and then issue the following commands:
docker exec -it --user root grafana bash

# in the container you just started:
chown -R root:root /etc/grafana && \
chmod -R a+r /etc/grafana && \
chown -R grafana:grafana /var/lib/grafana && \
chown -R grafana:grafana /usr/share/grafana
To run the grafana container as user: 104 change your docker-compose.yml like such:
  grafana:
    image: grafana/grafana:5.2.2
    container_name: grafana
    volumes:
      - grafana_data:/var/lib/grafana
      - ./grafana/datasources:/etc/grafana/datasources
      - ./grafana/dashboards:/etc/grafana/dashboards
      - ./grafana/setup.sh:/setup.sh
    entrypoint: /setup.sh
    user: "104"
    environment:
      - GF_SECURITY_ADMIN_USER=${ADMIN_USER:-admin}
      - GF_SECURITY_ADMIN_PASSWORD=${ADMIN_PASSWORD:-admin}
      - GF_USERS_ALLOW_SIGN_UP=false
    restart: unless-stopped
    expose:
      - 3000
    networks:
      - monitor-net
    labels:
      org.label-schema.group: "monitoring"
If you use promstack-exporters, you have to add your targets in :
- prometheus/exporters/node-exporters.yml
- prometheus/exporters/cadvisor.yml
- prometheus/exporters/nginx-exporters.yml
If you don't configure external exporters, you can comment this section in [prometheus.yml][prometheus/prometheus.yml]
# prometheus.yml
...
scrape_configs:
  - job_name: 'external'
    scrape_interval: 15s
    basic_auth:
      username: "prometheus"
      password_file: 'exporters/password'
    scheme: https
    tls_config:
      ca_file: 'exporters/ca.pem'
    file_sd_configs:
      - files:
          - 'exporters/*.json'
...