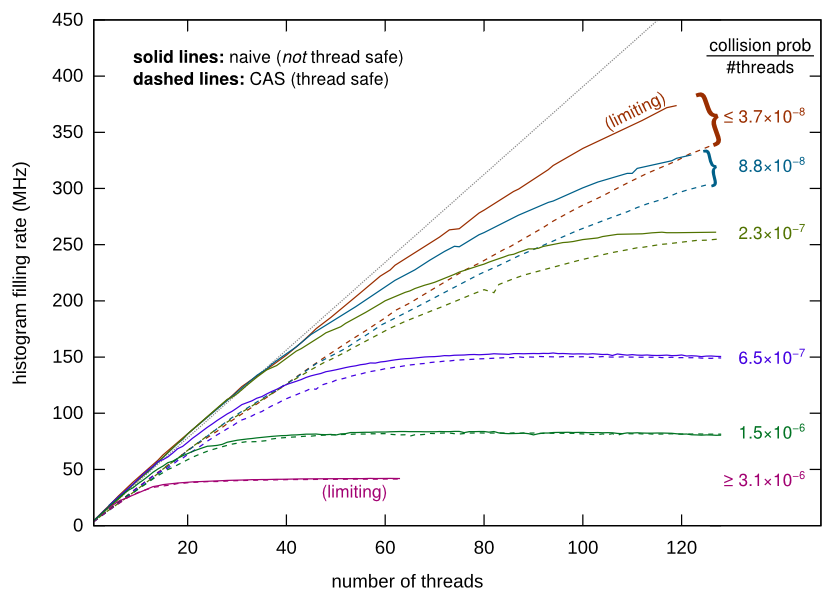
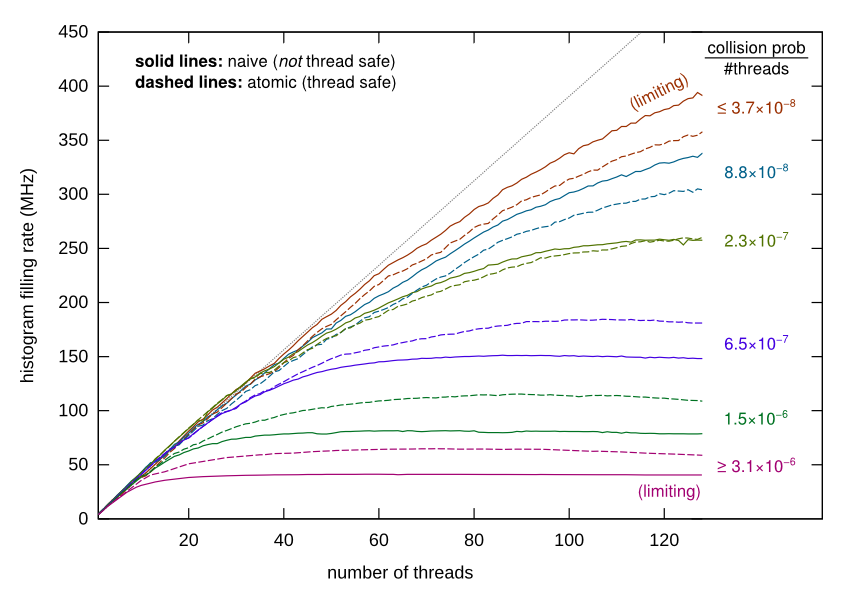
This directory contains all of the code and results behind my June 1, 2017 talk at the ROOT PPP meeting. See my slides for a motivation and overview of the study. The bottom line plots are shown below.
Step 1: find a machine with lots of cores. I used a KNL at Princeton; results and cpuinfo dumps are in results_mcmillan-r1k1.princeton.edu.
Step 2: copy over randomfill.cpp and randomfill.py, which are the only two files needed for the test.
Numpy and psutil are also required as dependencies.
Step 3: compile the C++ code into a shared library:
gcc -std=c++11 -shared -fPIC -lstdc++ -lrt -O3 randomfill.cpp -o randomfill.so
(No, there's no Makefile.)
Step 4: configure the Python script to run the appropriate test. Currently, that's chosen by uncommenting the appropriate experiment line:
# experiment = numpy.random.permutation([(i, "naive", RunNaive) for i in range(1, 128+1)] + [(i, "cassafe", RunCASSafe) for i in range(1, 128+1)])   # [(128, "cassafe", RunCASSafe)]
# experiment = numpy.random.permutation([(i, "naive", RunNaive) for i in range(1, 64+1)] + [(i, "cassafe", RunCASSafe) for i in range(1, 64+1)])

experiment = numpy.random.permutation([(i, "naive", RunNaive) for i in range(1, 128+1)] + [(i, "atomic", RunAtomic) for i in range(1, 128+1)])
The uncommented one runs the "naive" test on 1–128 cores (inclusive) and the "atomic" test on 1–128 cores (inclusive), all in a random order (so that the control and experiment are interleaved). RunCasSafe is a different option.
Step 5: further configure the experiment with command-line options.
size: number of GB for the shared block of memory, to be interpreted as a minimalist histogram.trials: number of bin-increment evnets in a single wall-time measurement (C++gettimeofday).cardinality: powers of 2 to reduce the size of the set of bins that might be hit. This is to increase the collision rate.
size = int(int(sys.argv[1]) * 1024**3 / 8)    # 1024**3 / 8 == 2**27
trials = int(float(sys.argv[2]))
cardinality = size >> int(sys.argv[3])
Results in results_mcmillan-r1k1.princeton.edu are labeled by command-line arguments and then sorted for plotting.
Because it's easier to set up the conditions of the test. Measurements of wall times of parallel tasks are much more stable when:
- Equal-sized jobs are started at the same time. If some tasks start before others, they'll get through their work more quickly than if they really started at the same time. Python's
Event(called "startgun" in my script) makes it easy to start the relevant, timed (non-initialization) part of the task for all threads in parallel. - Threads are pinned to CPUs. Of course you can do that with
numactl, butpsutilmakes it easy to do on a per-thread basis, sripted within one process. This test must be single-process to share a memory buffer (though it could have been done with forking...). - Experimental conditions, particularly test and control, are random-ordered. Things like making permutations are one-liners in Python.
Of course all of this can be done in C++, but I found it more expedient to do it in Python. The burden this added was having to load the functions in ctypes and set their signatures, since Python can't read the .h files.
Because it's wall time, unlike std::clock().
Why am I making smooth lines by measuring every number of threads, rather than skipping by powers of two?
Because I didn't mind waiting and it demonstrates just how stable the measurements are.
Because collision probability can only be measured in the CAS case. For the others, it's filled in as zero.

