This application was designed to give customers greater insight into their AWS API usage by generating custom CloudWatch Metrics based on CloudTrail logs.
VERSION: 0.1.1
AUTHORS: Joe Hsieh, Ho Ming Li, Jeremy Wallace
Here is the data flow:
- Amazon CloudTrail is configured to send API logs to Amazon CloudWatch Logs.
- AWS Lambda is triggered by new records that are written to the CloudWatch Log Stream.
- AWS Lambda aggregates the number of API requests and publishes custom Amazon CloudWatch Metrics.
By default, if an existing Cloudwatch Log Group is not specified during deployment, a new multi-region trail is created for the purpose of tracking Cloudtrail events. If you would like to use an existing trail, specify it as the CloudTrailLogGroupName parameter for CloudFormation.
Below are two different ways of configuring your AWS environment to collect metrics on API usage using this lambda function. You could configure the AWS environment with the command line, or through the web console.
- If you do not have an s3 bucket you can use, create one.
$ aws s3 mb s3://<YOUR_S3_BUCKET>
- Define the S3 bucket and prefix for SAM artifacts
$ export S3_BUCKET=<YOUR_S3_BUCKET>
$ export S3_PREFIX=cloudwatch-api-tracker-sam-artifacts
- Transform the SAM template to get the output template for CloudFormation
$ aws cloudformation package --template-file sam.yaml --output-template-file sam-output.yaml --s3-bucket $S3_BUCKET --s3-prefix $S3_PREFIX
-
Deploy the SAM output template
a. creates a new trail
$ aws cloudformation deploy --template-file sam-output.yaml --stack-name cloudwatch-api-tracker --capabilities CAPABILITY_IAMb. using an existing trail - ensure you have CloudTrail logs sent to CloudWatch Logs. Follow the guide here. Replace $CloudWatchLogGroupName with your own.
$ aws cloudformation deploy --template-file sam-output.yaml --stack-name cloudwatch-api-tracker --capabilities CAPABILITY_IAM --parameter-overrides CloudTrailLogGroupName=$CloudWatchLogGroupName -
Soon after CloudFromation stack creation completes, verify that the lambda function is being invoked and that no errors are produced.
Congratulations! You have set up API tracker. You will now start to see metrics in CloudWatch.
Please follow the instructions below to configure API tracker.
- Create an AWS account and sign in to the AWS Management Console.
- Under Management Tools, click on CloudTrail.
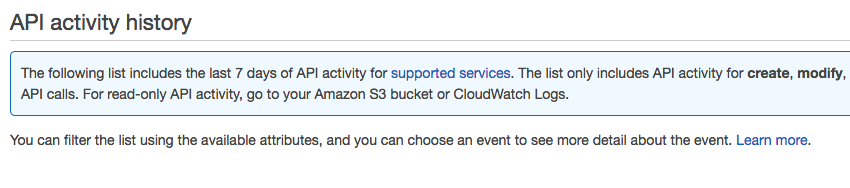
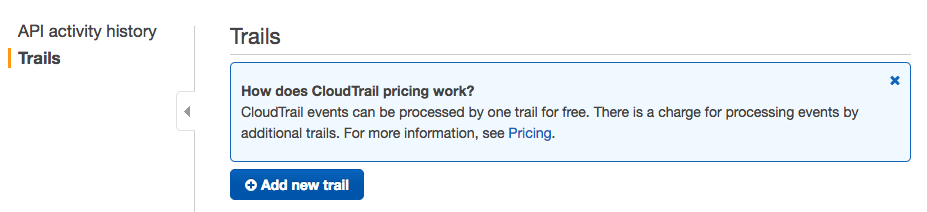
- Click Trails on the left menu bar.
- Click the blue Add New Trail button.
- Name the trail and pick an S3 bucket location to store the logs. Press create.
- Once created, click on your newly created CloudTrail.
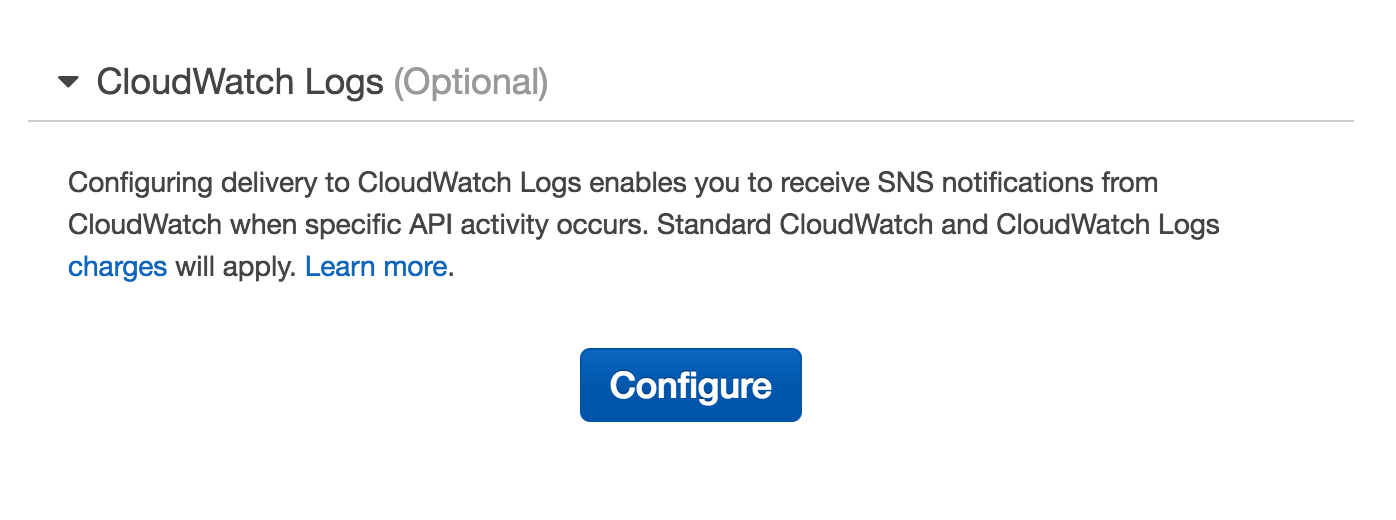
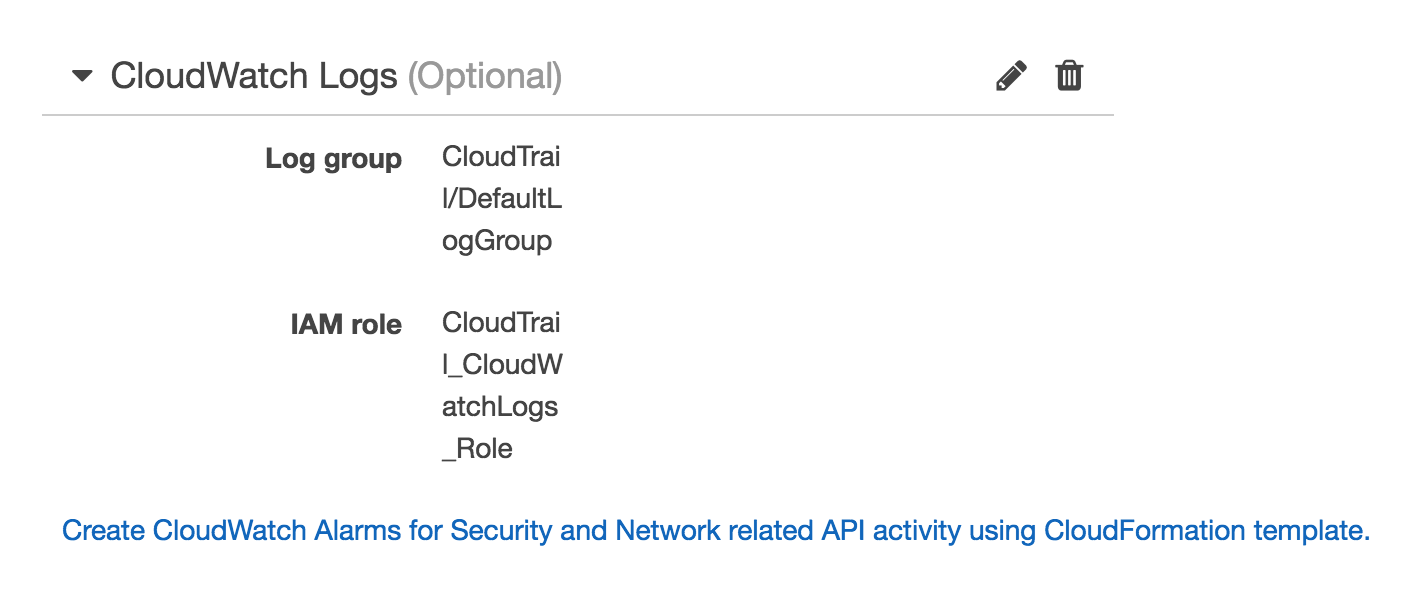
- In the section CloudWatch Logs, click configure.
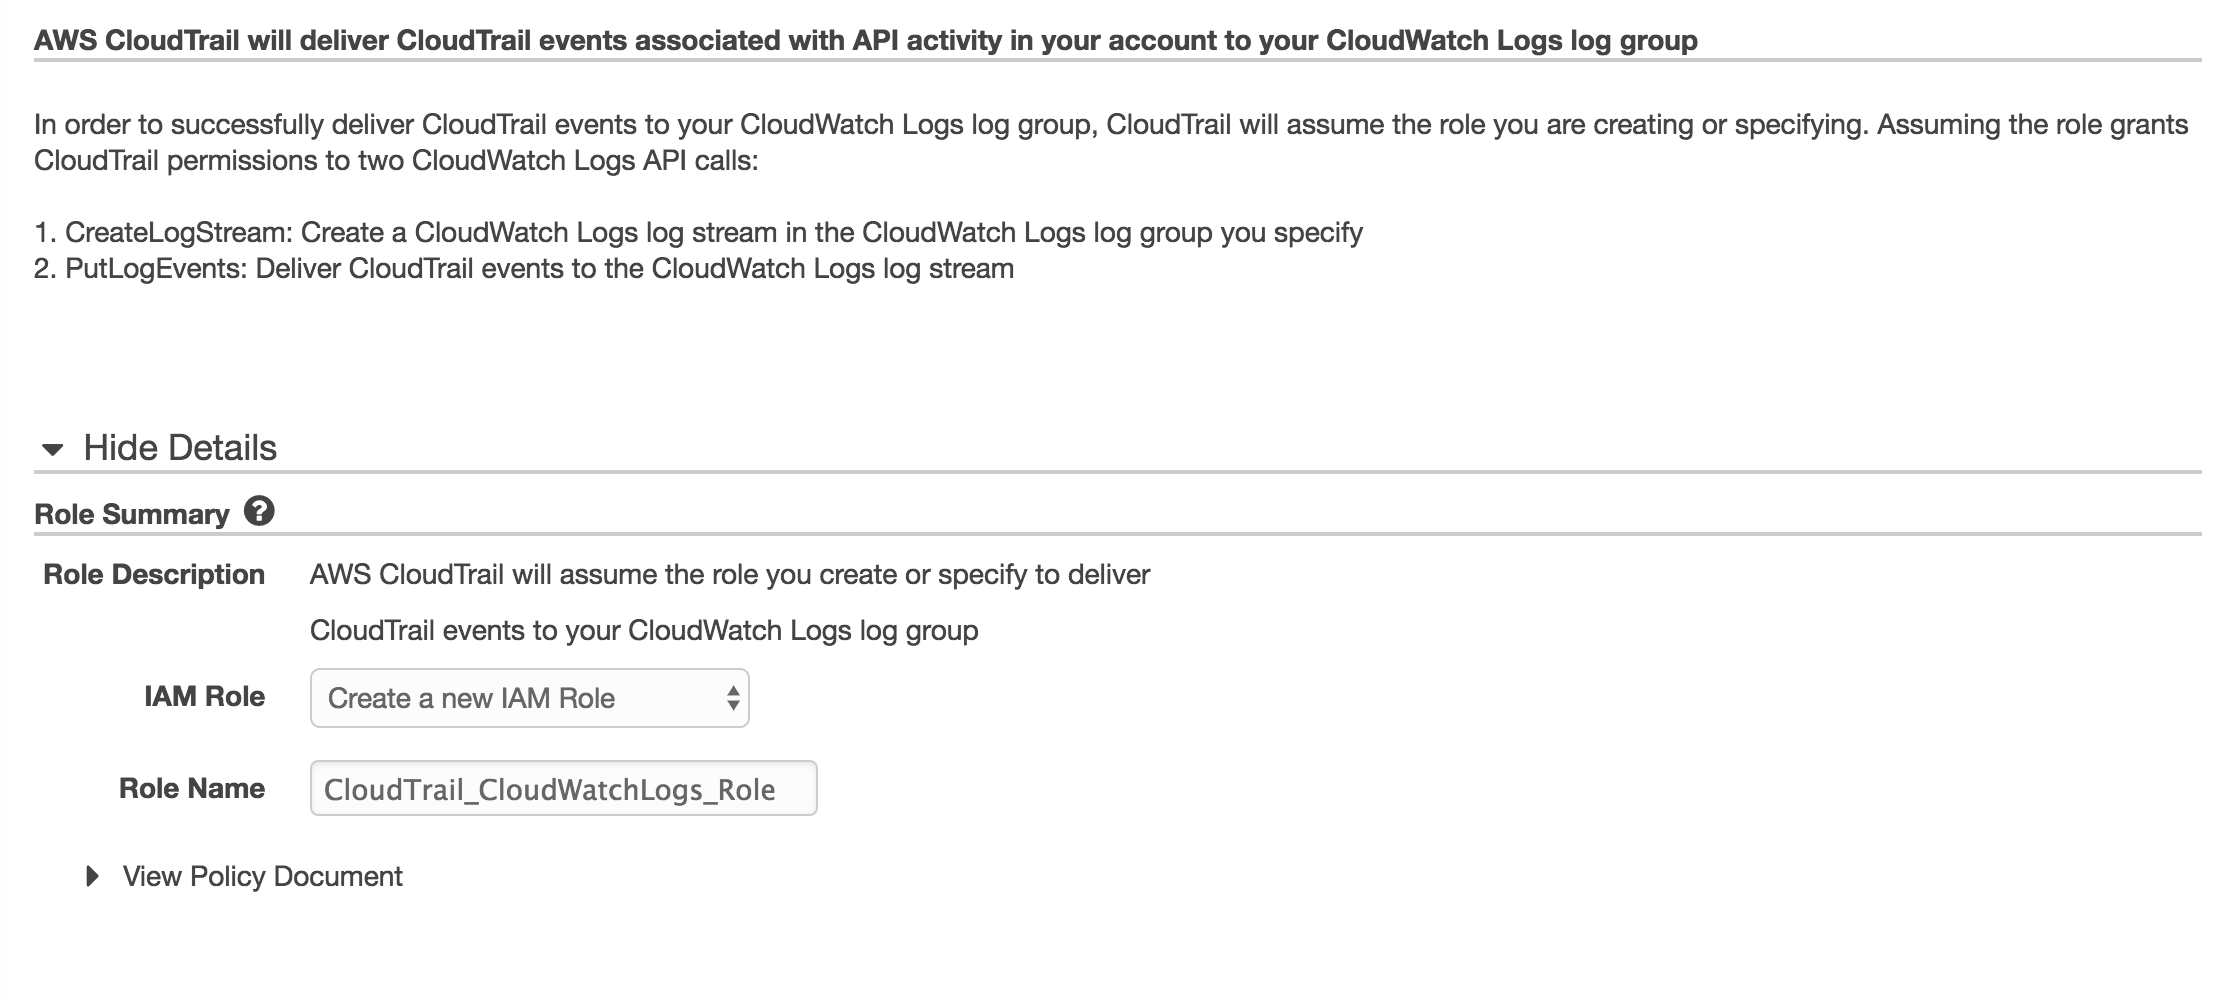
- If you do not have a CloudWatch Log Stream created, name one here and press continue.
- Review the IAM policy and press Allow.
- Click back to the CloudTrail page and ensure that CloudWatch Logs has been configured.
- Locally on your machine, run npm install in the nodejs directory (cloudwatch-api-tracker).
- Create a new zip file based on the contents of this directory (cloudwatch-api-tracker).
- Open the Lambda Console page.
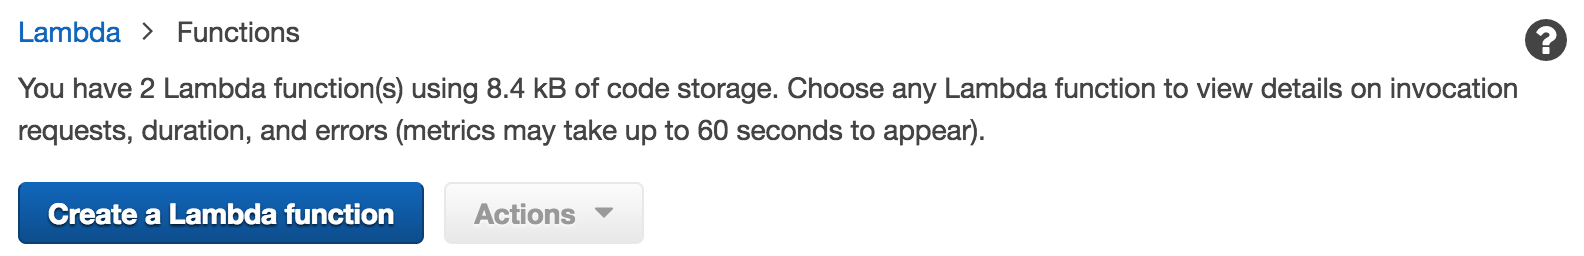
- Create a new lambda function.
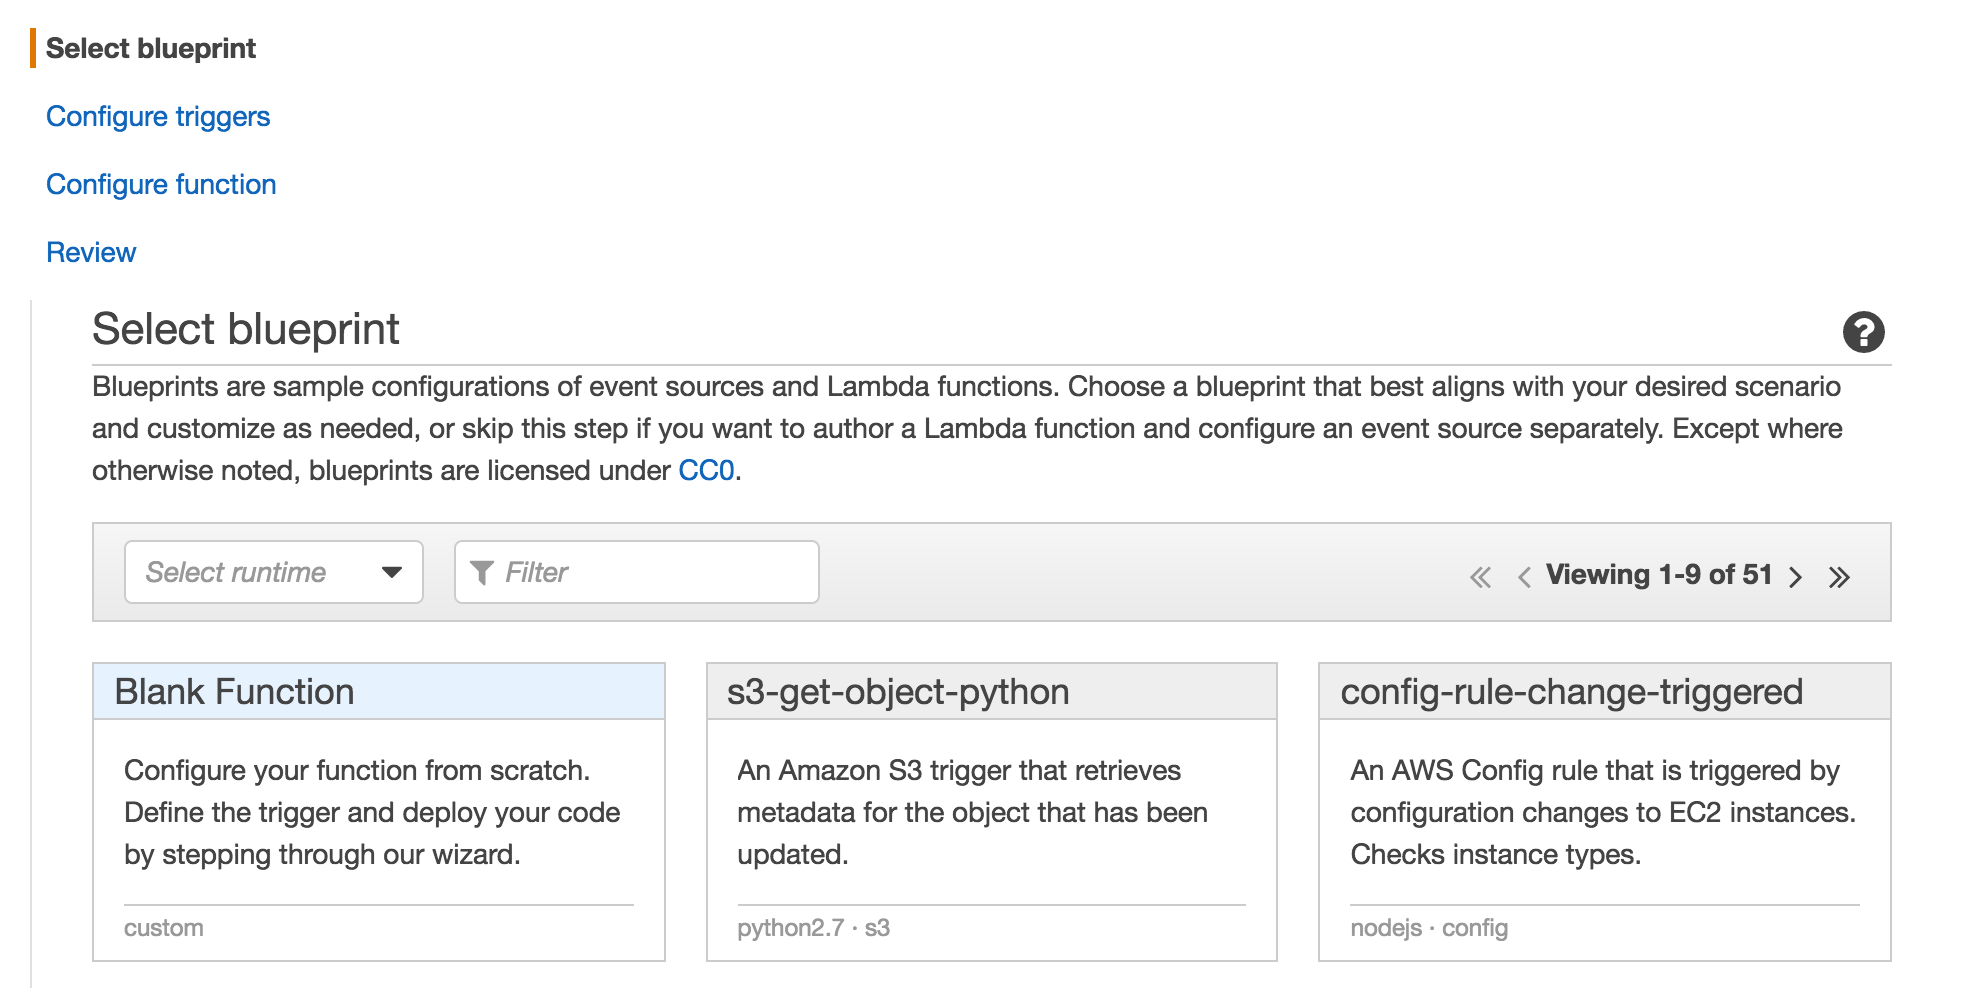
- Select the Blank Function blueprint.
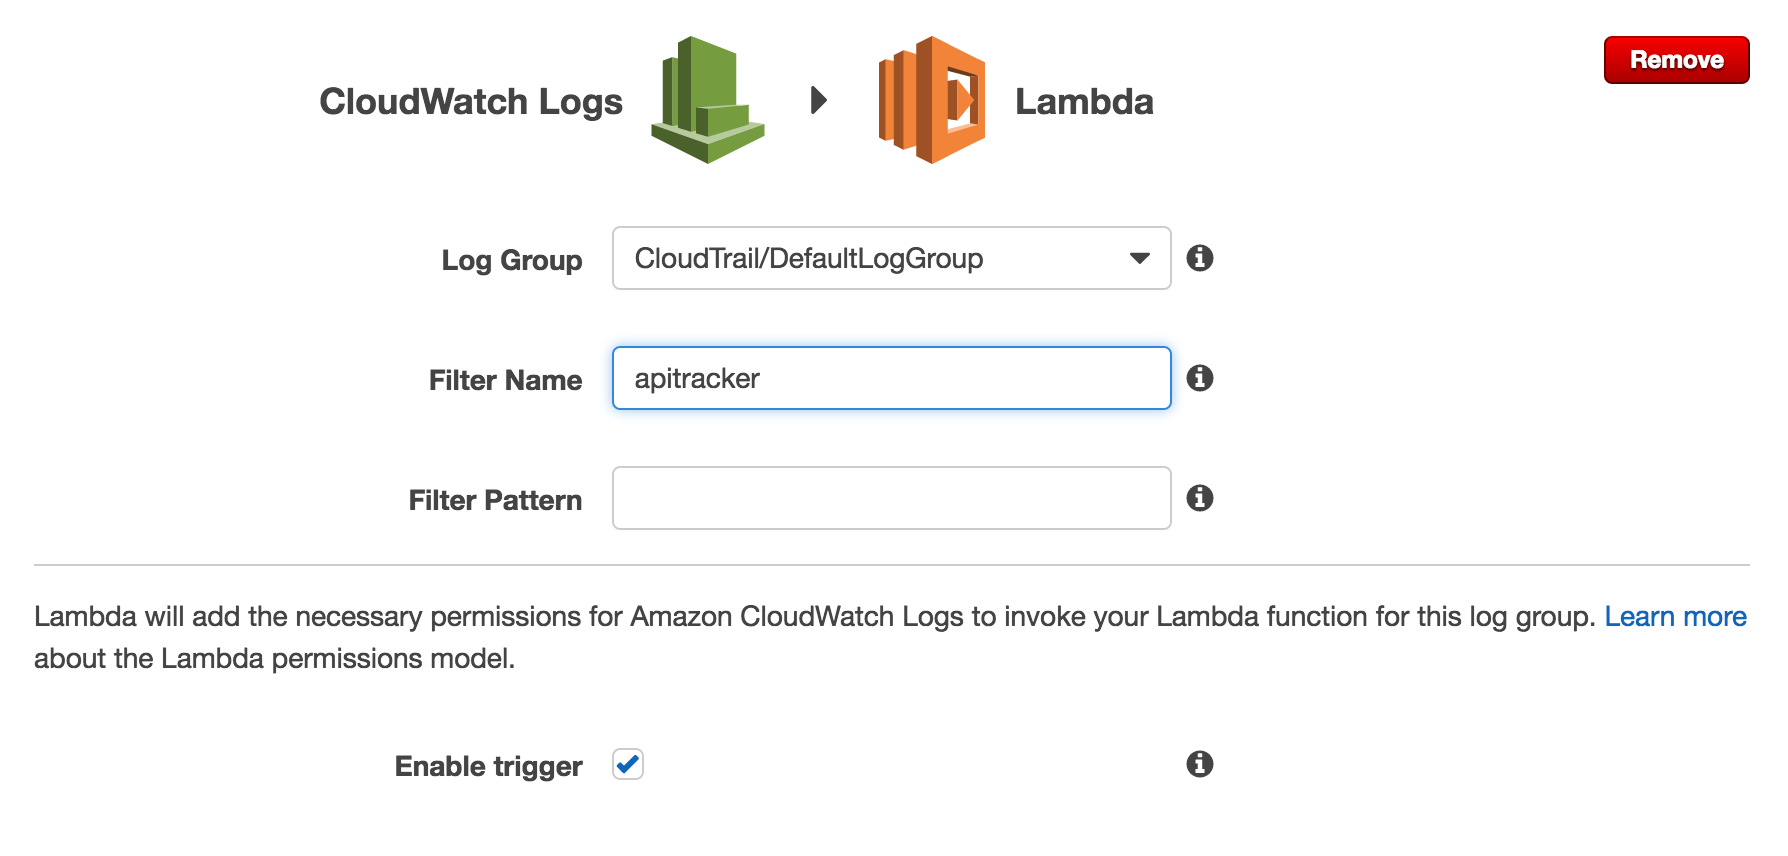
- Add a CloudWatch Logs Trigger.
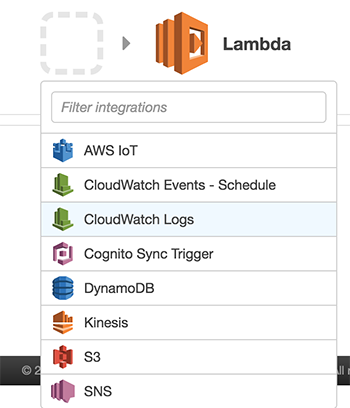
- Name the filter and use the CloudTrail Log Group that you created above.
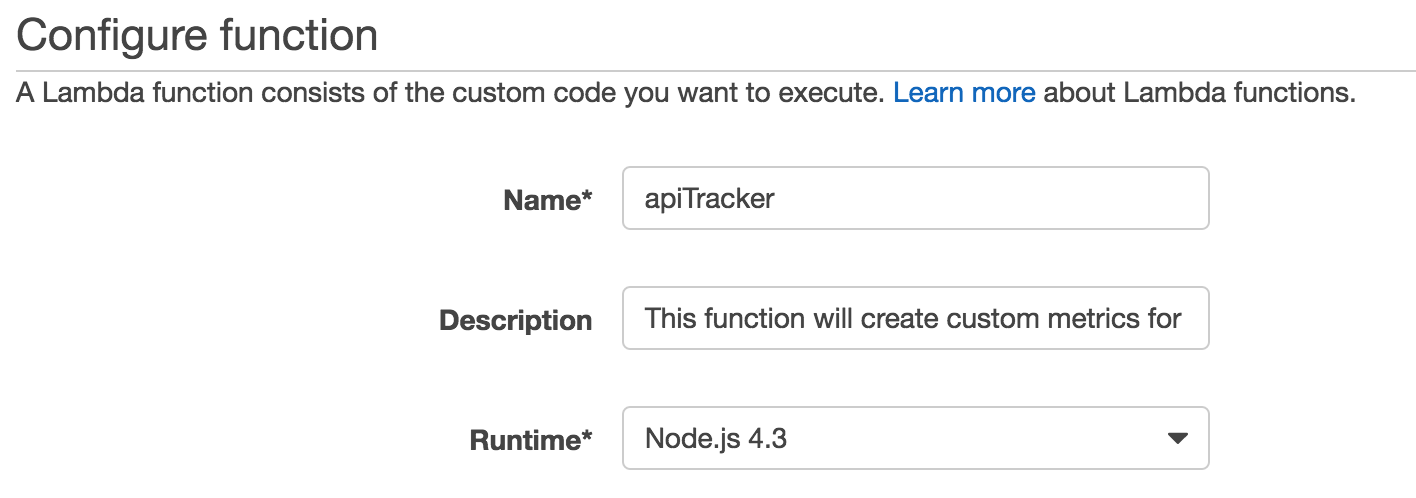
- Press Next. Name the Lambda function.
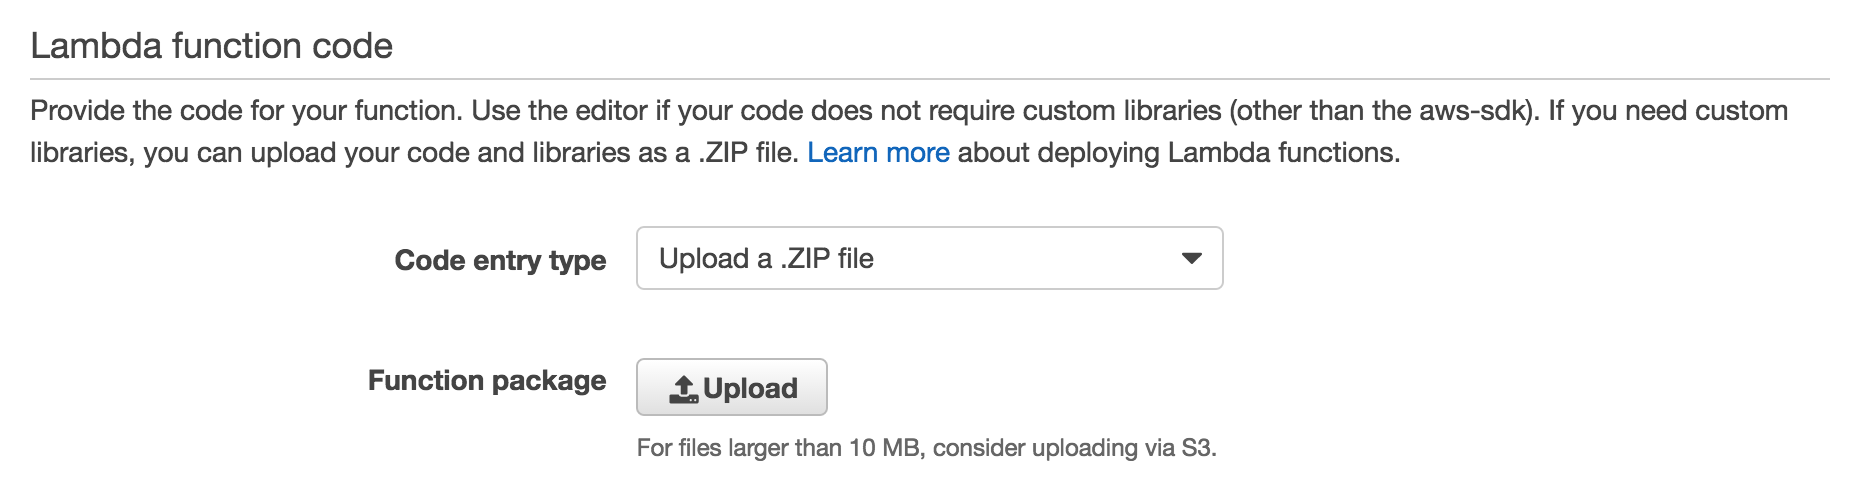
- Upload the ZIP file that you created above.
- Set the handler to app.handler.
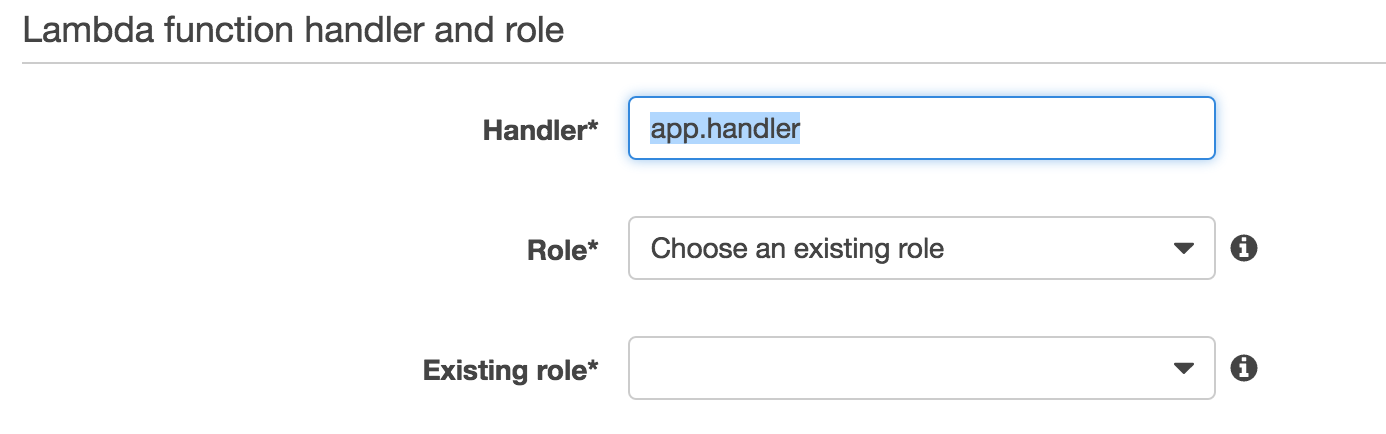
- Create a new IAM role for the Lambda function with the following IAM policy.
{
  "Version": "2012-10-17",
  "Statement": [
  {
    "Effect": "Allow",
    "Action": [
    "logs:CreateLogGroup",
    "logs:CreateLogStream",
    "logs:PutLogEvents"
    ],
    "Resource": "arn:aws:logs:*:*:*"
    },
    {
      "Effect": "Allow",
      "Action": [
      "cloudwatch:PutMetricData"
      ],
      "Resource": [
      "*"
      ]
    }
    ]
  }
Congratulations! You have set up API tracker. You will now start to see metrics in CloudWatch.
- Create a CloudWatch Alarm on a particular API.
- Create a CloudWatch Dashboard with the most commonly used APIs.