Allows MongoDB to be used as a data source for Grafana by providing a proxy to convert the Grafana Data source API into MongoDB aggregation queries
- Grafana > 3.x.x
- MongoDB > 3.4.x
- Copy the whole mongodb-grafana dir into the Grafana plugins dir ( /usr/local/var/lib/grafana/plugins )
- Restart the Grafana server. If installed via Homebrew, this will be
brew services restart grafana
- Open a command prompt in the mongodb-grafana directory
- Run
npm installto install the node.js dependencies - Run
npm run serverto start the REST API proxy to MongoDB. By default, the server listens on http://localhost:3333
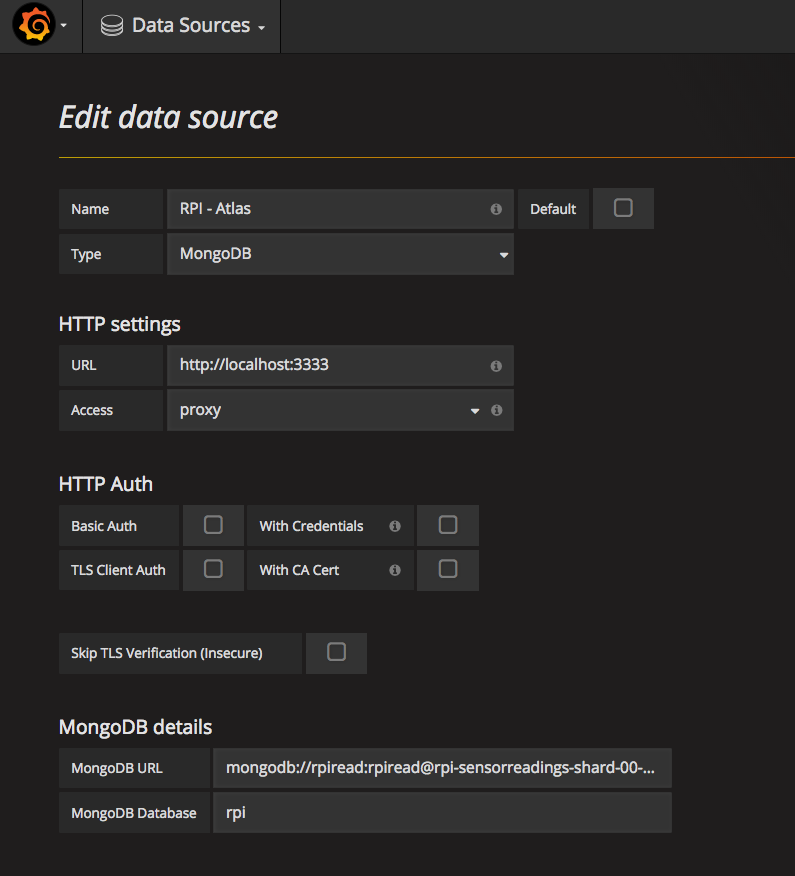
Create a new data source of type MongoDB as shown below. The MongoDB details are :
- MongoDB URL -
mongodb://rpiread:rpiread@rpi-sensorreadings-shard-00-00-fgscn.mongodb.net:27017,rpi-sensorreadings-shard-00-01-fgscn.mongodb.net:27017,rpi-sensorreadings-shard-00-02-fgscn.mongodb.net:27017/test?ssl=true&replicaSet=RPI-SensorReadings-shard-0&authSource=admin - MongoDB Database -
rpi
Then save the data source
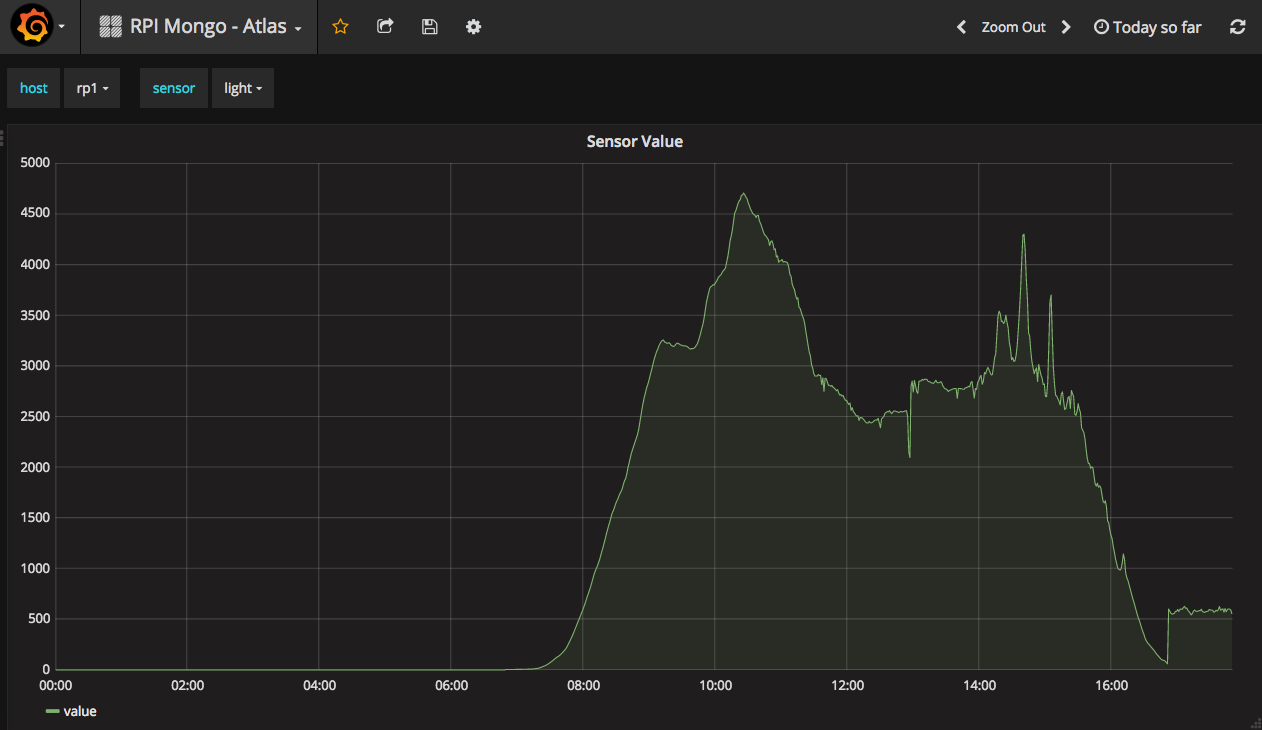
Import the dashboard in examples\RPI MongoDB - Atlas.json
This should show a graph of light sensor values from a Raspberry PI with an EnviroPHAT board feeding readings every minute into a MongoDB Atlas database.
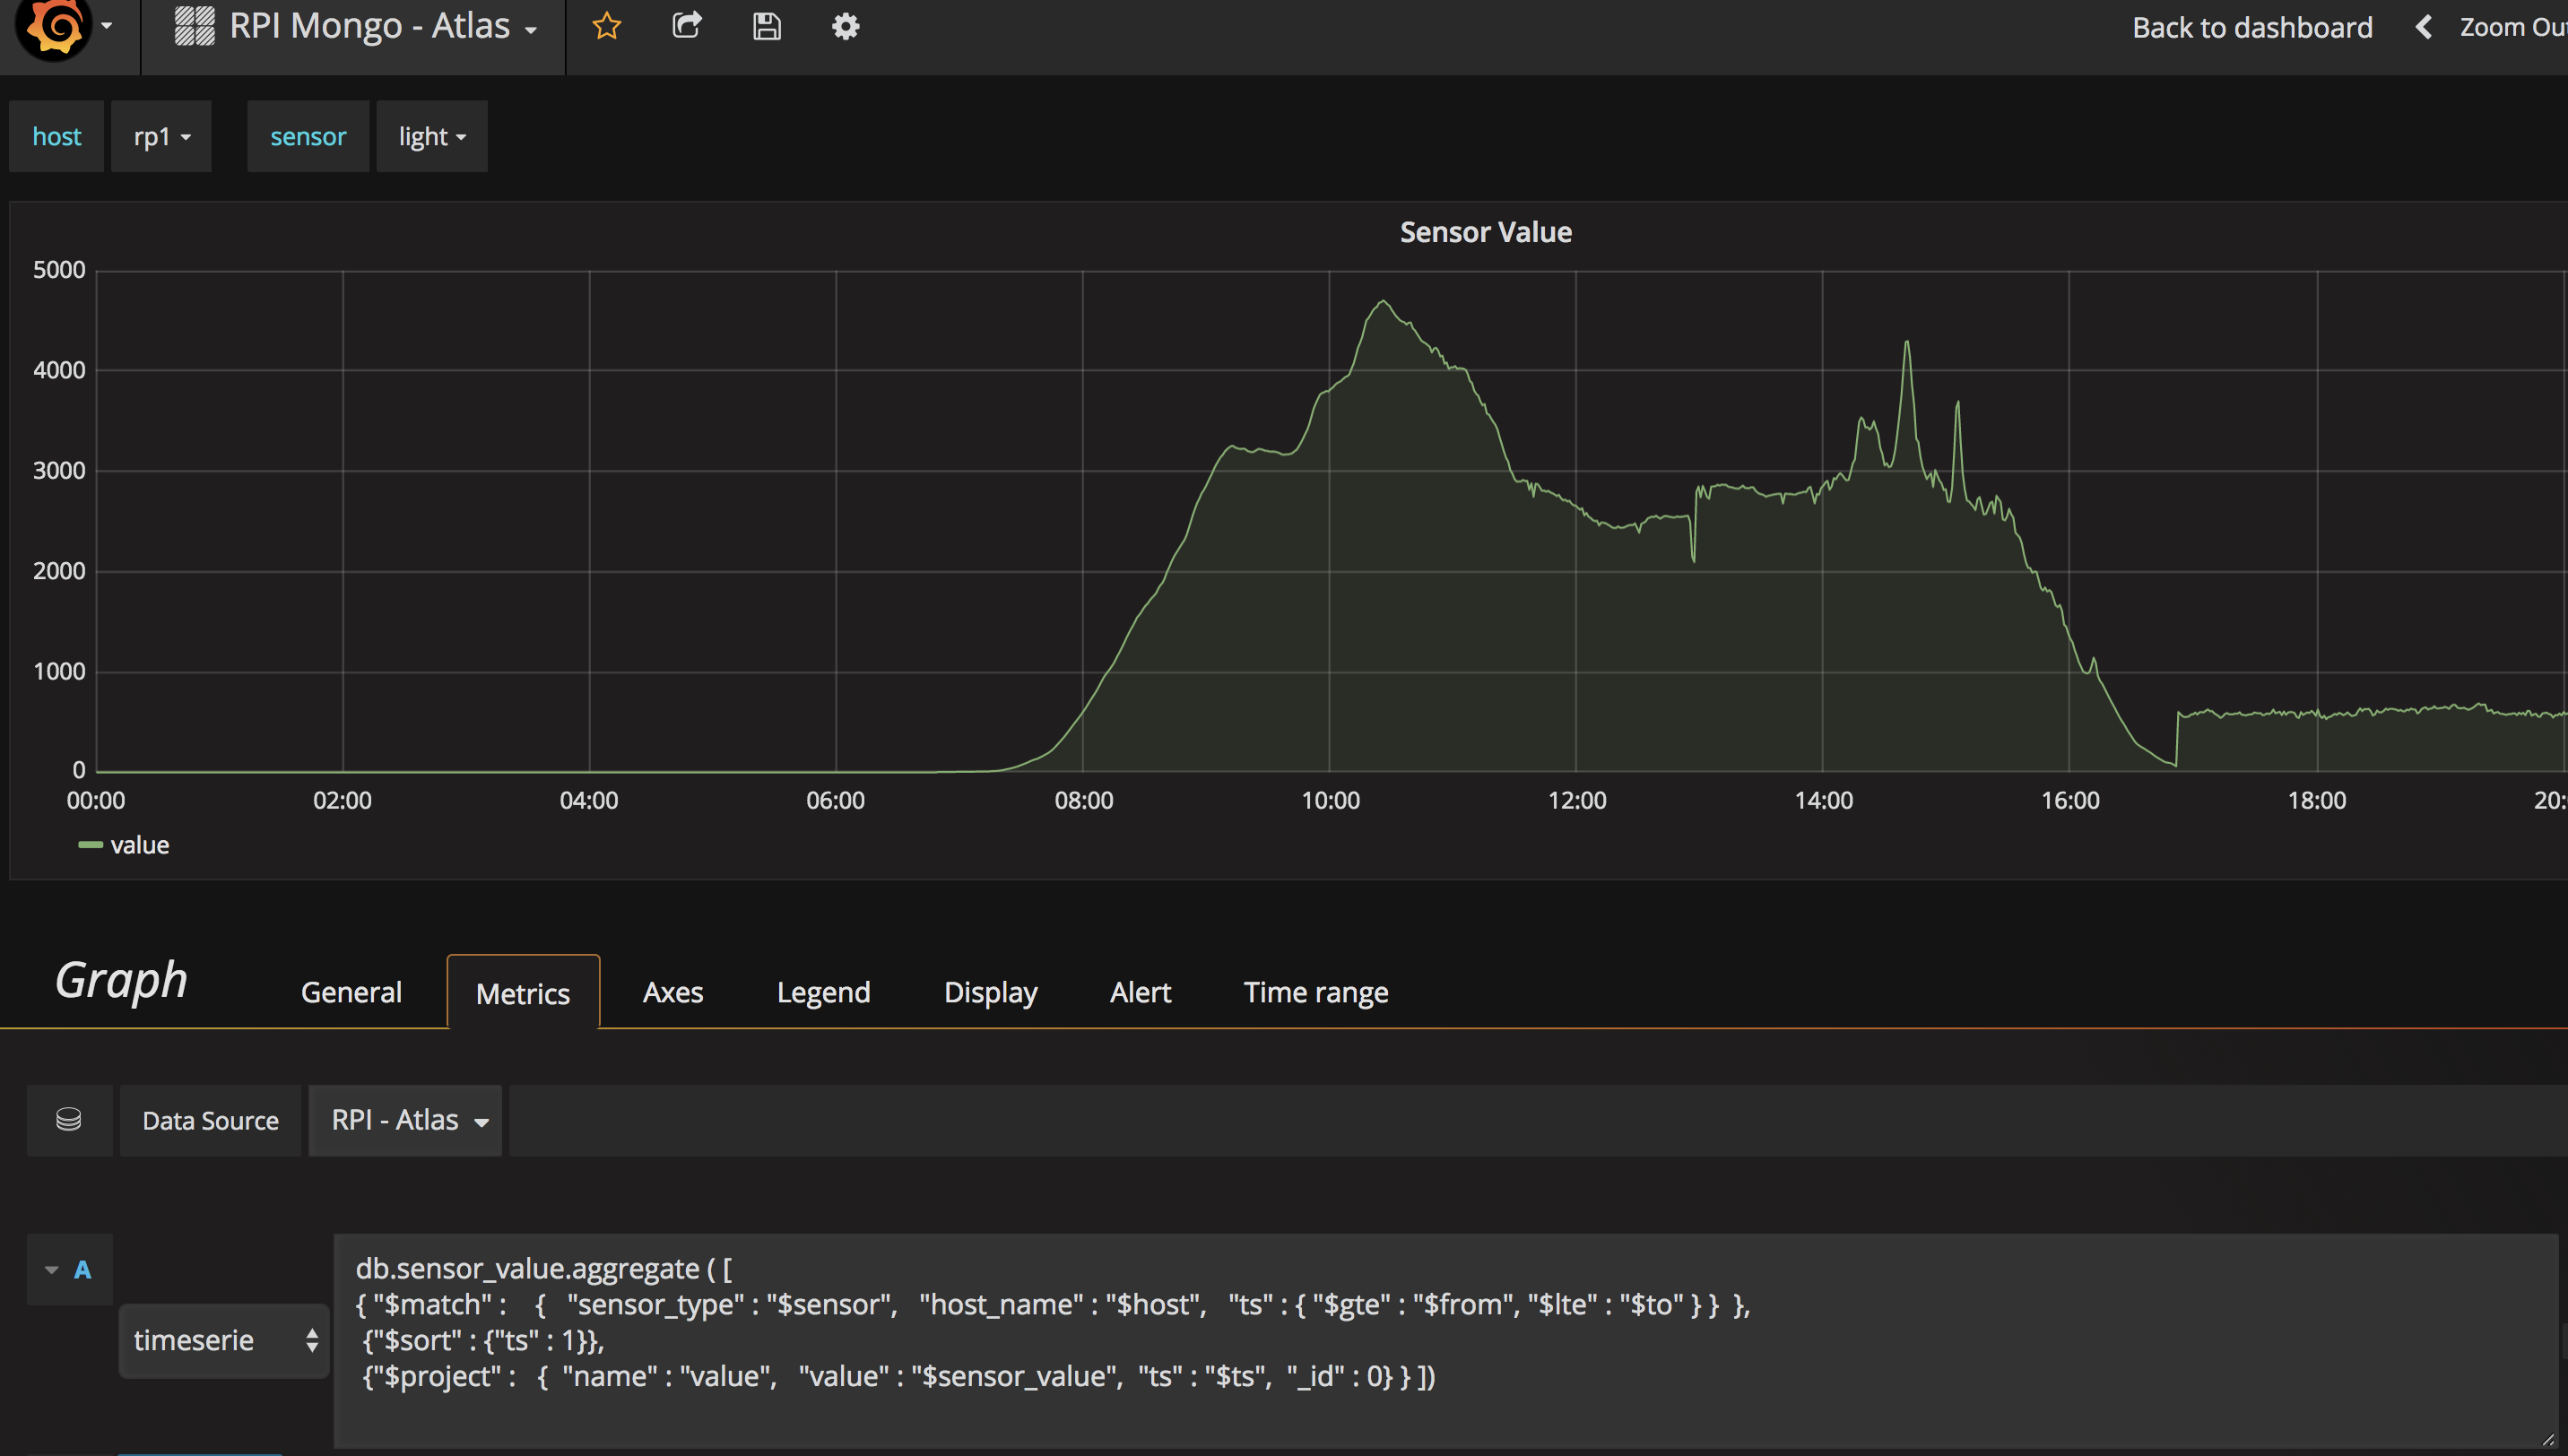
Clicking on the title of the graph allows you to see the aggregation query being run against the 'RPI Atlas' data source
The query here is
db.sensor_value.aggregate ( [
{ "$match" :    {   "sensor_type" : "$sensor",   "host_name" : "$host",   "ts" : { "$gte" : "$from", "$lte" : "$to" } }  },
 {"$sort" : {"ts" : 1}},
 {"$project" :   {  "name" : "value",   "value" : "$sensor_value",  "ts" : "$ts",  "_id" : 0} } ])
The API is expecting back documents with the following fields
name- Name of the series ( will be displayed on the graph)value- The float value of the pointts- The time of the point as a BSON date
These documents are then converted into the Grafana API
$from and $to are expanded by the plugin as BSON dates based on the range settings on the UI.
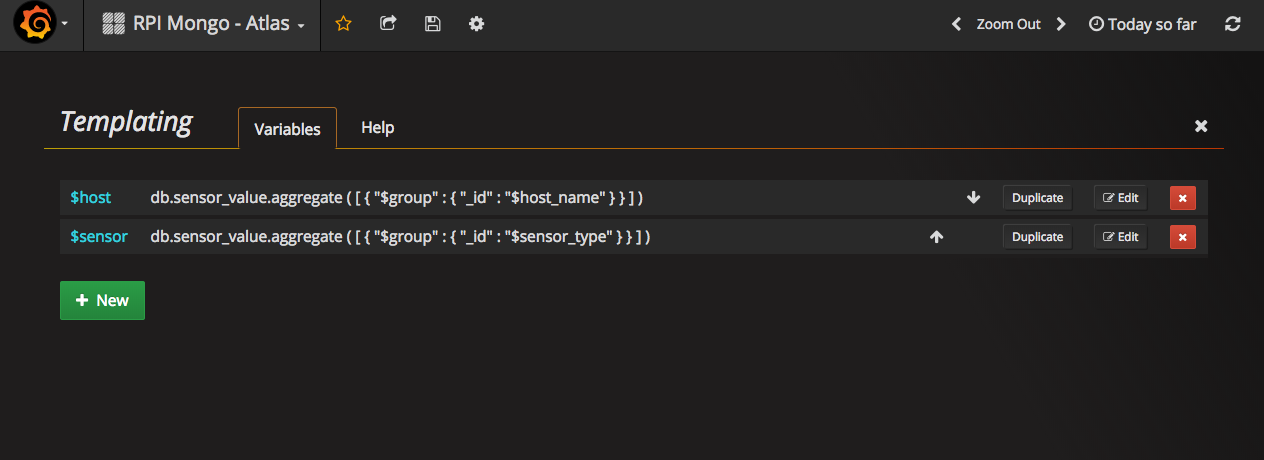
$sensor and $host are template variables that are filled in by Grafana based on the drop down. The sample template queries are shown below. They expect documents to be returned with a single _id field.
Grafana tells the backend server the date range along with the size of the buckets that should be used to calculate points. Therefore it's possible to use the MongoDB aggregation operator $bucketAuto to automatically bucket the data points into display points. To support this the backend provides the $dateBucketCount macro so that queries such as the one below can be written
db.sensor_value.aggregate( [
{  "$match" :  {  "sensor_type" : "$sensor", "host_name" : "$host" , "ts" : { "$gte" : "$from", "$lt" : "$to" }}},
{  "$bucketAuto" :  { "groupBy" : "$ts",
                           "buckets" : "$dateBucketCount",
                            "output" :  {  "maxValue" : { "$max" : "$sensor_value" }  }   }   },
{  "$project" :  {  "name" : "value",  "value" : "$maxValue",  "ts" : "$_id.min",  "_id" : 0  }  }  ]  )
Note that _id field of the bucketAuto output contains the start and end of the bucket so we can use that as the ts value
The dashboard in examples\RPI MongoDB Bucket - Atlas.json shows this.
- Install forever-mac
- Copy server/mongodb-grafana-proxy.plist to ~/Library/LaunchAgents
- run
launchctl load mongodb-grafana-proxyfrom ~/Library/LaunchAgents
This launch ctrl plist runs the node script via forever. To check it's running, use forever list. Logs go into /usr/local/var/lib/grafana/plugins/mongodb-grafana/dist/server


