A tool to extract Agile metrics and charts from JIRA projects and Trello Boards.
Requires Python 3.6 or later.
Install Python 3 and the pip package manager. Then run:
$ pip install jira-agile-metrics
You can do this globally, but you may want to use a virtual Python environment
(venv) instead to keep things self-contained.
See The Hitchhiker's Guide to Python for the full details about how to install Python and venvs.
This should install a binary called jira-agile-metrics in the relevant bin
directory. You can test it using:
$ jira-agile-metrics --help
... which should print a help message.
If you prefer, you can use Docker to install and run
jira-agile-metrics with all the relevant dependencies in place. After
installing Docker, run:
$ docker run -it --rm -v $PWD:/data optilude/jira-agile-metrics:latest config.yml
This will run jira-agile-metrics with the configuration file config.yml from
the current directory, writing outputs also to the current directory. The
argument -v $PWD:/data mounts the /data volume, where output files will be
written, to the current working directory. You can of course specify a
different bind mount.
There is a second Docker image, which can be used to run multiple config files in batch mode, for example to generate metrics overnight.
To use it, create a directory containing one or more configuration files, with
the extension .yml or .yaml, and a different directory for the outputs.
Assuming these are /path/to/config and /path/to/output, you can run
the following Docker command periodically, e.g. using cron or another
scheduler:
$ docker run --rm -v /path/to/config:/config -v /path/to/output:/data optilude/jira-agile-metrics:batch-latest
When this is finished, you should see a directory under the output directory
for each of the config files in the config directory, containing the reports
and charts. You will also find a file called metrics.log containing the log
output during the run, which may be helpful in diagnosing any problems.
Any command line arguments passed to docker run after the image name will be
passed directly to jira-agile-metrics. So, for example, if you wanted to use
the -n option to limit the number of results fetched from JIRA (for testing
purposes), you can pass -n 10 (or some different number) at the end of the
command line above.
The basic usage pattern is to run jira-agile-metrics with a configuration
file, written in YAML format (see below), which describes:
- how to connect to a remote JIRA or Trello instance (this can also be set using command line options);
- what metrics (spreadsheet-like data files, charts as images) to output;
- various settings used to calculate those metrics; and
- a description of the stages of the workflow the relevant JIRA tickets go through.
The tool will then connect to JIRA or Trello using its web services API, run a query to the relevant tickets and their history, and calculate the required metrics.
The outputs are written to local filesystem files. Data files can be written in CSV, XLSX or JSON formats (depending on the extension of the desired output file), whilst charts are written as PNG images.
jira-agile-metrics comes with a simple web server that can be used to produce
metrics by uploading a configuration file and downloading a ZIP file with data
and charts. To start it, run:
$ jira-agile-metrics --server 5000
This will start a server on port 5000 (you can also specify a bind host name
or IP address, e.g. 0.0.0.0:5000). Visit this address in a web browser and
upload a file.
In this mode, all other command line options are ignored.
Note: The web server is designed for low-volume usage only, and does not have a sophisticated security model. It is simply a more accessible front end to the features of the command line tool. The server will wait, synchronously, whilst JIRA is queried and charts are produced, which can take a long time. During this time, the browser will wait, and threads will block.
Warning: The web server does not encrypt requests, which means that by
default JIRA/Trello credentials are transmitted in plain-text. You are strongly
advised to configure a reverse proxy (e.g. nginx) with SSL enabled in front
of it.
There is a separate Docker image for running the web server, which uses nginx
and uwsgi for improved performance and stability (but still not SSL, which
would need to be configured with a domain-specific certificate):
$ docker run -d --rm -p 8080:80 --name jira_metrics optilude/jira-agile-metrics:server-latest
This will run the server in daemon mode and bind it to port 8080 on the local
host. To stop it, run:
$ docker stop jira_metrics
See the Docker documentation for more details.
The tool uses a simple username/password combination to connect to JIRA. You need to ensure this user exists in the remote JIRA instance, and has the required permissions. A JIRA API token can be used in the place of a password.
There are three ways to provide the credentials for JIRA -- in particular, the password, which should be kept scret. You should think carefully about which approach makes most sense for you.
- Generate an API token for your user in JIRA settings and use this API token instead of password in your scripts
- Creating API token is mandatory if your Atlassian account is based on a single sign on like Google
- The safest option is to not set it in either the configuration file, or as a command line option. In this case, you will be prompted to input a password (and username, if you didn't set this either) each time the tool is run.
- You can use the
--usernameand/or--passwordcommand line options to set credentials when you invoke thejira-agile-metricscommand. This keeps them out of the configuration file, but if you do this in an interactive shell that records command history (i.e. virtually all of them), your password will likely be stored in plain text in the command history! - If you are confident you can keep the configuration file secret, you can
store them there, under the
Connectionsection (see below).
Example how to connect with username and API token:
# Connects with an API token that is passed on --password argument
jira-agile-metrics --username your-email@example.com --password CGI... config.yml
For Trello the tool uses a username plus an API Key/Token pair. You need to ensure this user exists in the remote Trello instance, and has the required permissions.
Example how to connect with username and API token:
# Connects with an API token that is passed on --password argument
jira-agile-metrics --username your-email@example.com --key 6d1658b... --token a7d6b34... config.ymlThe most common use case is to calculate metrics for a team using a JIRA issue
type called something like Story, going through a workflow with stages like
Backlog, Committed, Elaboration, Build, Code review, Test, and Done,
and allowing a set of resolutions like Completed, Withdrawn, and Duplicate.
jira-agile-metrics lets you use JIRA JQL syntax to specify which issues you
are interested in. See the JIRA documentation for more details (or construct a
search using the JIRA UI and then have JIRA show you the corresponding JQL).
Here is an example JIRA configuration file for a basic example using the workflow above:
# How to connect to JIRA. Can also include `Username` and `Password`
Connection:
    Domain: https://myjira.atlassian.net # your JIRA instance
    # bypass JIRA API call for the server version endpoint
#   Jira server version check: False

# What issues to search for. Uses JQL syntax.
Query: Project=ABC AND IssueType=Story AND (Resolution IS NULL OR Resolution IN (Completed, Withdrawn))

# The workflow we want to analyse. By convention, the first stage should be
# the backlog / initial state, and the final stage should indicate the work
# is done.
#
# We map analytics names to JIRA status names. It's possible to collapse
# multiple JIRA statuses into a single workflow stage, as with `QA` below.
Workflow:
    Backlog: Backlog
    Committed: Committed
    Elaboration: Elaboration
    Build: Build
    QA:
        - Code review
        - Test
    Done: Done

# What outputs to produce. These are all optional. If an option isn't set
# the relevant metric will not be produced.

Output:

    # CSV files with raw data for input to other tools or further analysis in a spreadsheet
    # If you use .json or .xlsx as the extension, you can get JSON data files or Excel
    # spreadsheets instead

    Cycle time data:
        - cycletime.csv
        - cycletime.json
    CFD data: cfd.csv
    Scatterplot data: scatterplot.csv
    Histogram data: histogram.csv
    Throughput data: throughput.csv
    Percentiles data: percentiles.csv

    # Various charts

    Scatterplot chart: scatterplot.png
    Scatterplot chart title: Cycle time scatter plot

    Histogram chart: histogram.png
    Histogram chart title: Cycle time histogram

    CFD chart: cfd.png
    CFD chart title: Cumulative Flow Diagram

    Throughput chart: throughput.png
    Throughput chart title: Throughput trend

    Burnup chart: burnup.png
    Burnup chart title: Burn-up

    Burnup forecast chart: burnup-forecast.png
    Burnup forecast chart title: Burn-up forecast
    Burnup forecast chart trials: 100 # number of Monte Carlo trials to run to estimate completion date

    # Burnup forecast chart throughput window: 60 # Days in the past to use for calculating historical throughput
    # Burnup forecast chart throughput window end: 2018-06-01 # Calculate throughput window to this date (defaults to today)
    # Burnup forecast chart target: 100 # items to complete in total; by default uses the current size of the backlog
    # Burnup forecast chart deadline: 2018-06-01 # deadline date, in ISO format; if not set, no deadline is drawn.
    # Burnup forecast chart deadline confidence: .85 # percentile to use to compare forecast to deadline

    WIP chart: wip.png
    WIP chart title: Work in Progress

    Ageing WIP chart: ageing-wip.png
    Ageing WIP chart title: Ageing WIP

    Net flow chart: net-flow.png
    Net flow chart title: Net flow
Hint: If you prefer to manage your queries as saved filters in JIRA, you can
use the special JQL syntax of filter=123, where 123 is the filter ID.
If you save this file as e.g. config.yaml, you can run:
$ jira-agile-metrics config.yaml
This should prompt you for a username and password, and then connect to your
JIRA instance, fetch the issues matching the query, calculate metrics, and
write a number of CSV and PNG files to the current working directory (you can
use the --output-directory option to write to another directory).
When testing configuration, it is often helpful to fetch just a small number of
issues to speed things up. You can either do this by making your query more
restrictive, or by using the -n flag to limit the number of issues fetched:
$ jira-agile-metrics -n 20 config.yaml
If you want more information about what's going on, use the -v flag:
$ jira-agile-metrics -v config.yaml
And if you are realy curious:
$ jira-agile-metrics -vv config.yaml
If you are using Trello then your configuration file needs to look like this:
Connection:
    type: trello

# Board to get data from
Query: Web Services
If you want to reuse some configuration elements (e.g., Connection,
Workflow) across multiple configuration files, you can use the Extends
option to "import" one file into another.
For example, if you had a file called common.yaml with:
Connection:
    Domain: https://myjira.atlassian.net

Workflow:
    Backlog: Backlog
    Committed: Committed
    Elaboration: Elaboration
    Build: Build
    QA:
        - Code review
        - Test
    Done: Done

Output:

    Quantiles:
        - 0.5
        - 0.75
        - 0.95
Another file, e.g. team1.yaml, could then reuse these settings with:
Extends: common.yaml

Output:
    Cycle time data: team1-cycletime.csv
    CFD chart: team1-cfd.png
    CFD chart title: Team 1: CFD
The extended filename is resolved relative to the file being loaded, so in
this example they would be in the same directory. You can use relative or
absolute paths. Note that the path separator for relative paths is always /
(forward slash), even on Windows!
When one file extends another, the extending file can override any options
set in the extended file. So, for example, if team1.yaml also set Quantiles
under Output, the list from common.yaml would be overridden in its entirety.
This is the case for any option under Output, and for the Query / Queries
and Workflow options in their entirety. Any Attributes will be merged.
You can use Extends recursively, i.e. an extended file can extend another
file.
Note: The Extends feature is not available in server mode. If a file with
an Extends line is uploaded to the server, an error will be thrown.
jira-agile-metrics can produce a number of data files and charts, which can
be enabled in the Output section of the configuration file, or with a
corresponding command line option.
Note: In the configuration file, you can specify output file names, but not absolute or relative paths. Files will always be written to the current working directory. This is to prevent unexpeced behaviour and the potential of overwriting other files when configuration files are moved around or used on a remote machine. No such restriction applies to output files specified in command line arguments.
Details about each ticket and the date it entered each stage of the workflow. Both the CSV and JSON versions of this file can be used by the Actionable Agile Analytics tool, which offers powerful, interactive analysis of Agile flow.
In the configuration file:
Output:
    Cycle time data: cycletime.csv
You can also use .json or .xlsx formats. To output multiple files, use a
list like:
Output:
    Cycle time data:
        - cycletime.json
        - cycletime.xlsx
        - cycletime.csv
Note: the "Blocked Days" calculation relies on the "Flagged" feature in JIRA, showing the total number of days (rounded up to the nearest whole day) that each ticket was flagged as impeded. Impediments raised whilst the ticket is in the backlog or done do not count.
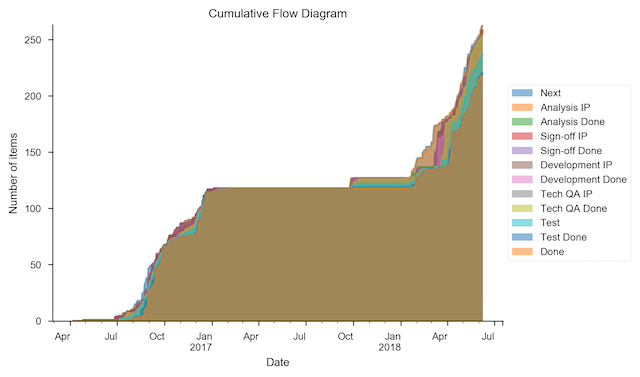
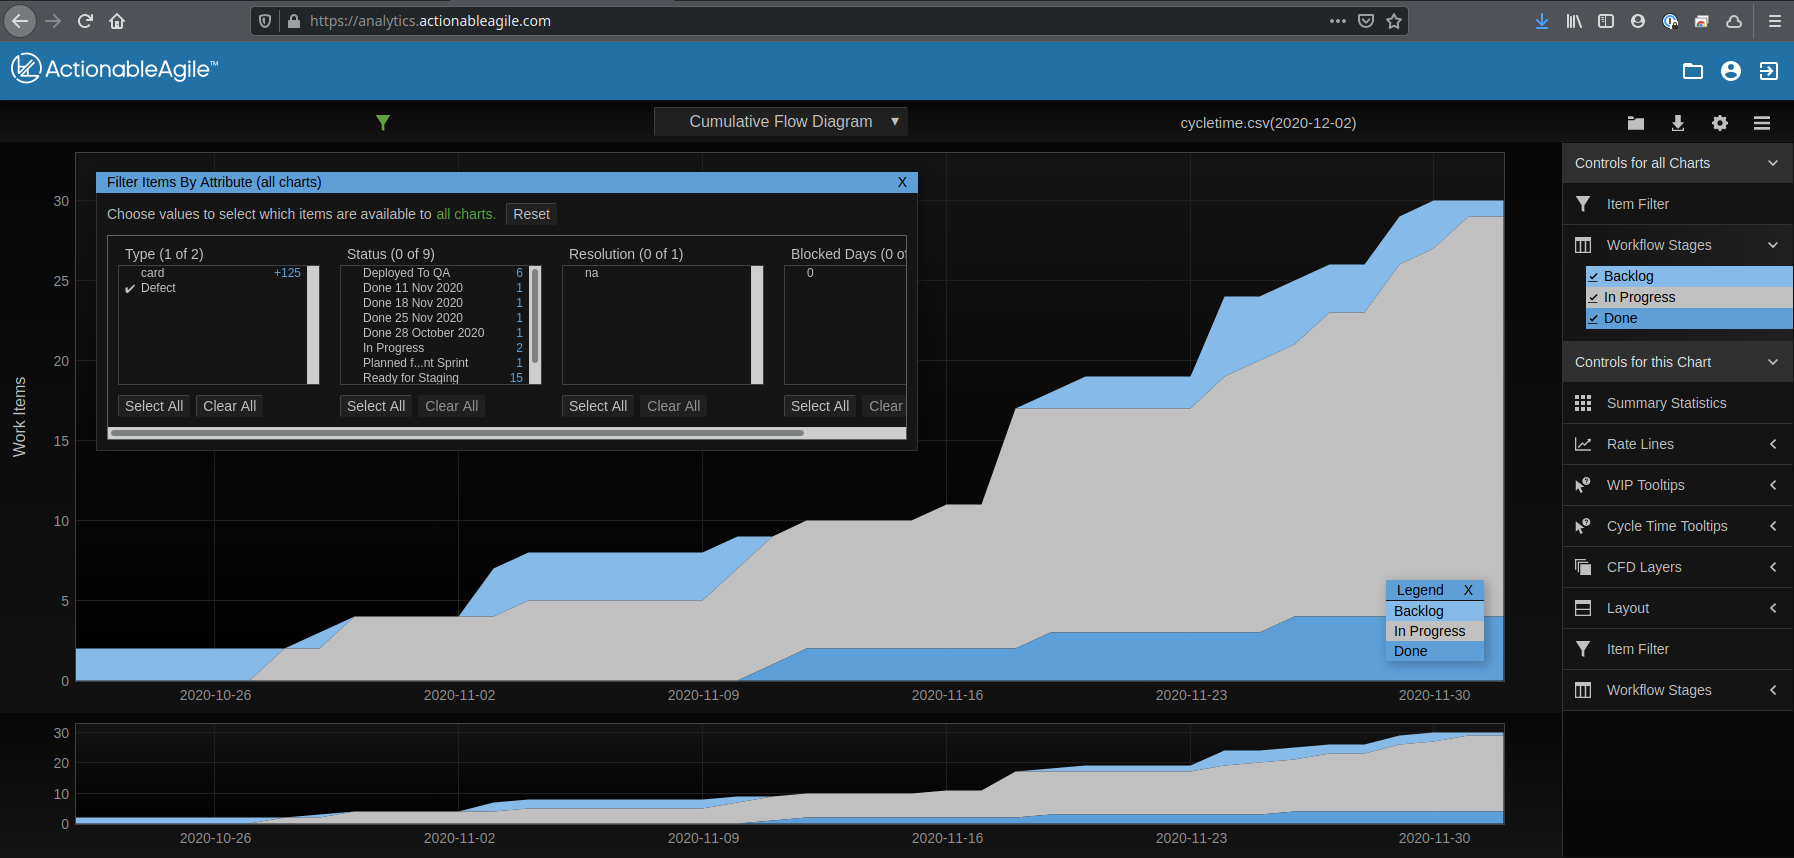
Raw data for creating a valid Cumulative Flow Diagram, in spreadsheet format, and/or an image file of the same. The CFD shows the number of work items in each stage of the flow as a stacked area chart, day by day. This allows us to visualise WIP, cycle time, and throughput.
In the configuration file:
Output:
    CFD data: cfd.csv
    CFD chart: cfd.png
    CFD chart title: Cumulative Flow Diagram
You can also use .json or .xlsx formats for the data file. To output
multiple files, use a list like:
Output:
    CFD data:
        - cfd.json
        - cfd.xlsx
        - cfd.csv
To only show the 30 most recent days in the chart:
CFD window: 30
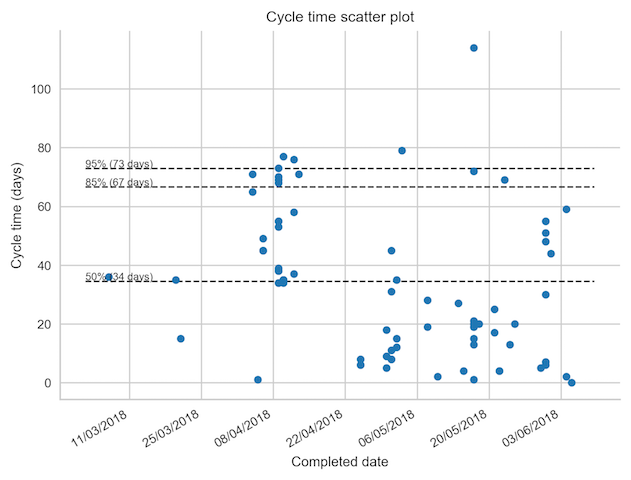
Raw data for creating a valid Cycle Time scatter plot graph, and/or an image file of the same. This chart plots the end-to-end cycle time (excluding time spent in the backlog) for each work item against its completion date, and overlays quantiles (e.g. 85% of tickets took 18 days or fewer)
In the configuration file:
Output:
    Scatterplot data: scatterplot.csv
    Scatterplot chart: scatterplot.png
    Scatterplot chart title: Cycle time scatter plot
You can also use .json or .xlsx formats for the data file. To output
multiple files, use a list like:
Output:
    Scatterplot data:
        - scatterplot.json
        - scatterplot.xlsx
        - scatterplot.csv
By default, the quantiles used are the 50th, 85th and 95th percentile, but you
can specify a different list with the Quantiles option under Output:
    Quantiles:
        - 0.3
        - 0.5
        - 0.75
        - 0.85
        - 0.95
Note that this option affects all charts that use quantiles.
To get the quantile values (number of day at each quantile) in a data file, use:
Percentiles data: percentiles.csv
To only show the 30 most recent days in the chart:
Scatterplot window: 30
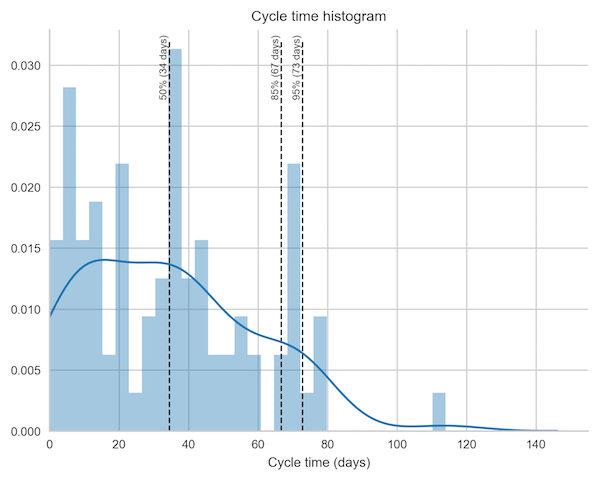
This is a different view of the cycle time , calculatd and/or plotted as a histogram.
In the configuration file:
Output:
    Histogram data: histogram.csv
    Histogram chart: histogram.png
    Histogram chart title: Cycle time histogram
You can also use .json or .xlsx formats for the data file. To output
multiple files, use a list like:
Output:
    Histogram data:
        - histogram.json
        - histogram.xlsx
        - histogram.csv
This also respects the Quantiles option (see above).
To only show the 30 most recent days in the chart:
Histogram window: 30
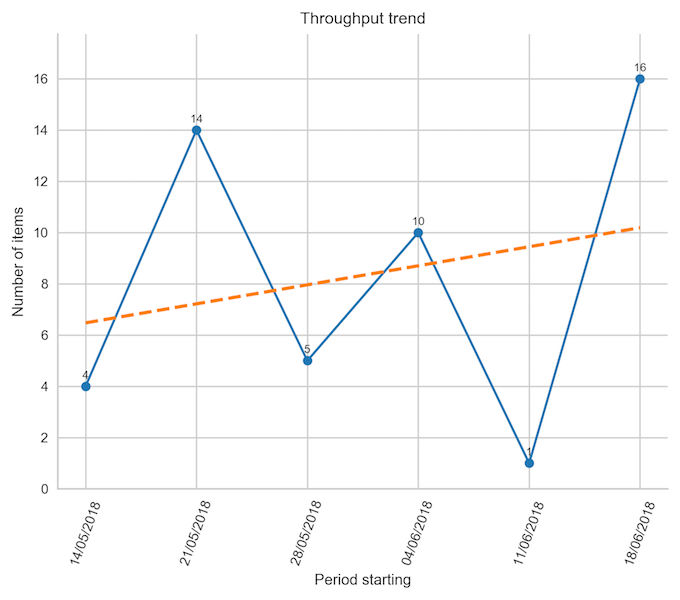
Weekly throughput, i.e. the number of items completed week by week. The chart also shows a trend line.
In the configuration file:
Output:
    Throughput data: throughput.csv
    Throughput chart: throughput.png
    Throughput chart title: Throughput trend
You can also use .json or .xlsx formats for the data file.
To change the frequency from weekly to something else, use:
Throughput frequency: 1D
Here, 1D means daily. The default is 1W-MON, which means weekly starting on
Mondays.
To only show the 6 most recent periods (e.g. weeks) in the chart:
Throughput window: 6
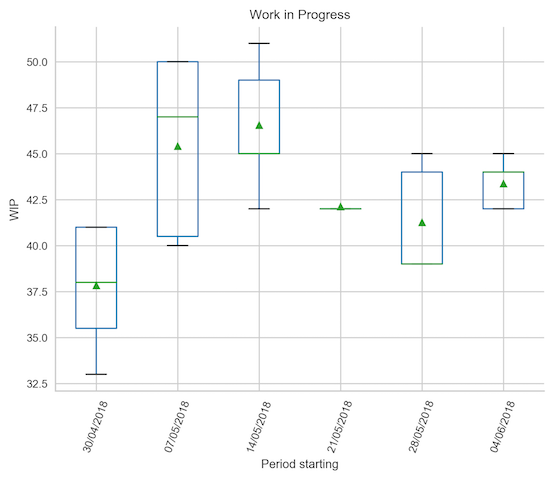
Shows a box plot of WIP, week by week (or some other frequency).
In the configuration file:
    WIP chart: wip.png
    WIP chart title: Work in Progress
To change the frequency from weekly to something else, use:
WIP frequency: 1D
Here, 1D means daily. The default is 1W-MON, which means weekly starting on
Mondays.
To only show the 6 most recent periods (e.g. weeks) in the chart:
WIP window: 6
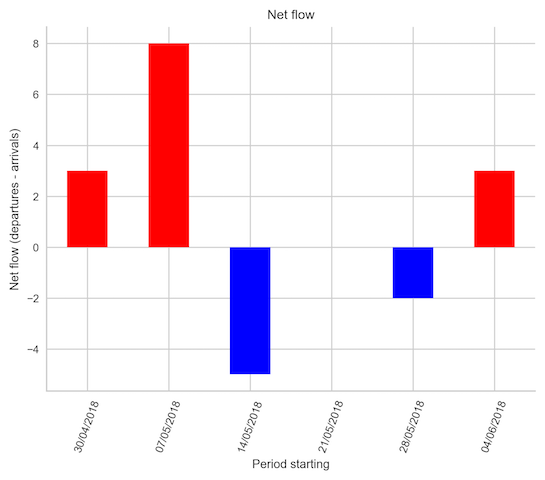
Shows the difference between arrivals and departures week on week. In a perfectly stable system, the net flow would be 0.
In the configuration file:
    Net flow chart: net-flow.png
    Net flow chart title: Net flow
To change the frequency from weekly to something else, use:
Net flow frequency: 1D
Here, 1D means daily. The default is 1W-MON, which means weekly starting on
Mondays.
To only show the 6 most recent periods (e.g. weeks) in the chart:
Net flow window: 6
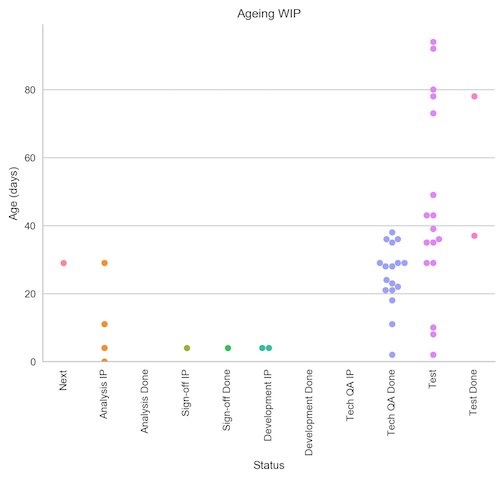
Shows the cycle time to date for each work item, grouped into the stages of the workflow. This can help identify slow-moving tickets.
In the configuration file:
    Ageing WIP chart: ageing-wip.png
    Ageing WIP chart title: Ageing WIP
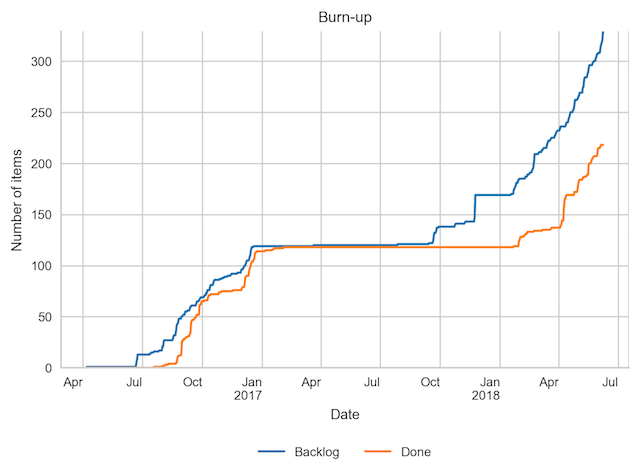
A basic Agile burn-up chart, based on a count of items completed and in the backlog.
In the configuration file:
    Burnup chart: burnup.png
    Burnup chart title: Burn-up
To only show the 30 most recent days in the chart:
Burnup window: 30
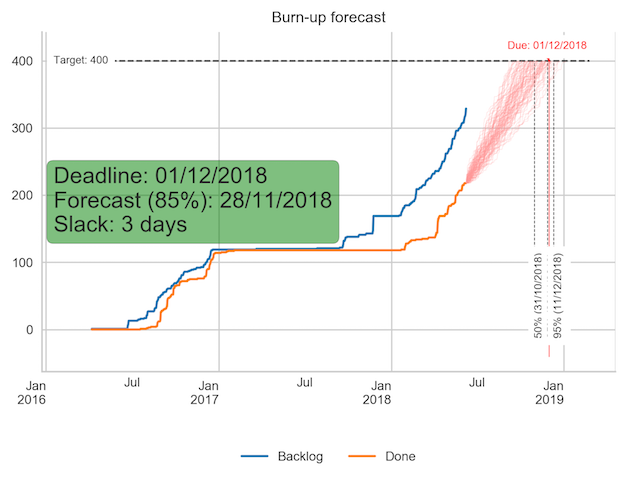
A more advanced version of the burn-up chart, which will run a Monte Carlo simulation based on historical throughput to forecast a completion date for the scope.
The simulation can be calibrated with a series of options to set:
- The number of trials to run. Each trial will be drawn as a hypotehtical burn-up to completion.
- The window of time from which to sample historical throughput. This should be representative of the near future, and ideally about 6-12 weeks long.
- The target to aim for, as a number of stories to have completed. Defaults to the size of the backlog, but can be set to an assumed figure.
- A deadline date, which, if set, can be compared to a forecast at a given confidence interval.
In the configuration file:
    Burnup forecast chart: burnup-forecast.png
    Burnup forecast chart title: Burn-up forecast
    Burnup forecast chart trials: 100 # number of Monte Carlo trials to run to estimate completion date

    Burnup forecast chart throughput window: 60 # Days in the past to use for calculating historical throughput
    Burnup forecast chart throughput window end: 2018-06-01 # Calculate throughput window to this date (defaults to last day of burnup)
    Burnup forecast chart target: 100 # items to complete in total; by default uses the current size of the backlog
    Burnup forecast chart deadline: 2018-06-01 # deadline date, in ISO format; if not set, no deadline is drawn.
    Burnup forecast chart deadline confidence: .85 # percentile to use to compare forecast to deadline
To only show the 30 most recent days in the chart:
Burnup forecast window: 30
Note this feature is not available in Trello.
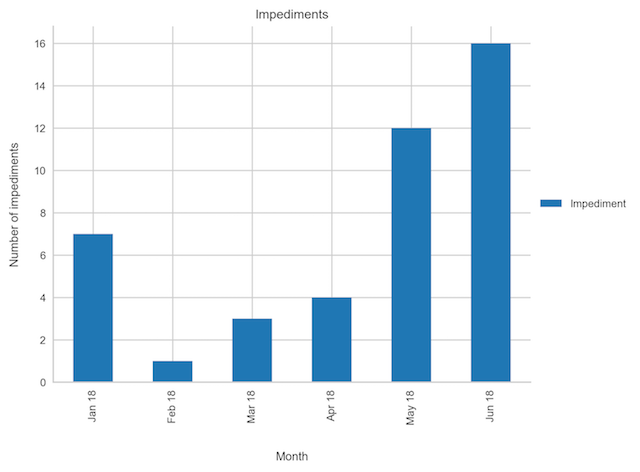
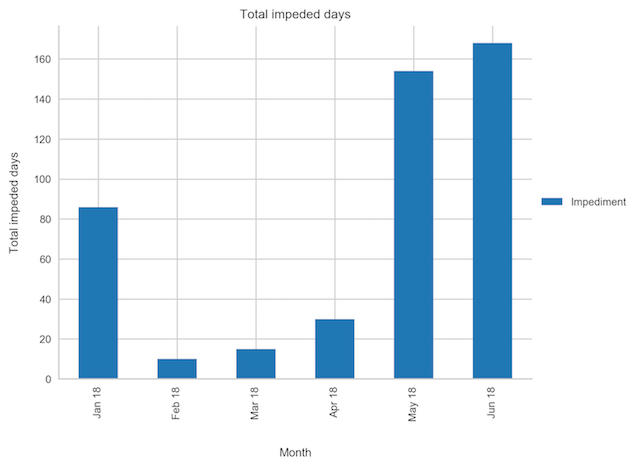
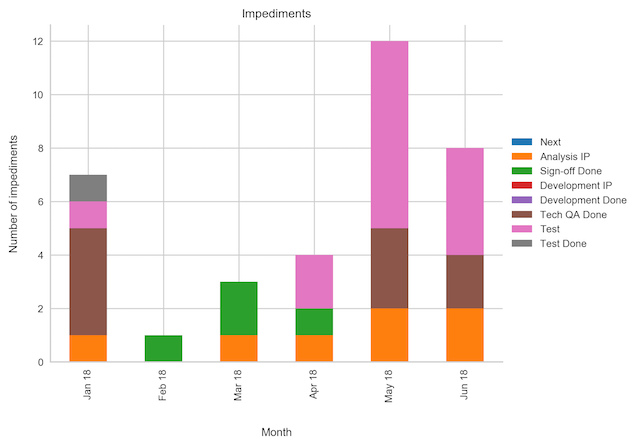
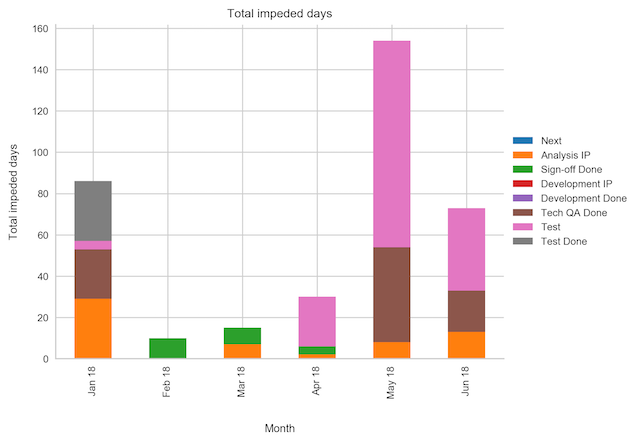
If you use the "Flagged" feature in JIRA to mark (and unmark) tickets as impeded when they are blocked, you can produce charts showing the number of impediments raised, and the cumulative amount of time tickets have spent being impeded, broken down by month and either the flag set or the the workflow stage a ticket was in when the flag was set. You can also write out the impediment events to a file.
The charts can be enabled with:
Impediments data: impediments.csv
Impediments window: 6
Impediments chart: impediments.png
Impediments chart title: Number of impediments
Impediments days chart: impediments-days.png
Impediments days chart title: Total impeded days
Impediments status chart: impediments-status.png
Impediments status chart title: Number of impediments by status
Impediments status days chart: impediments-status-days.png
Impediments status days chart title: Total impeded days by status
Note that by default, only a single value ("Impediment") is available for the
Flagged field in JIRA, and indeed only one field can be set when using the
"Set flag" option on a JIRA Agile board. However, you can enable additional
values in the field configuration for the relevant field, and make that field
available on the issue edit screen.
The Impediments window, which is optional, can be used to limit the chart to
showing only the most recent months' data: six in this case.
The Impediments chart and Impediments status chart will count the number of
impediment events that were active each month, i.e. a ticket was flagged as
impeded at some point during the month.
The Impediments days chart and Impediments status days chart uses the same
underlying logic, but instead of counting impediments, it sums the number of
days of all impediments in each month.
Note that:
- Impediments raised against tickets in the backlog or in the "done" column are not shown.
- If a ticket is flagged and then resolved before being unflagged, the impeded time is calculated to the resolution date.
- If a ticket is still flagged at the time the chart is generated, the impeded day count will run to today's date.
- Blocking time is always rounded up to the nearest whole day.
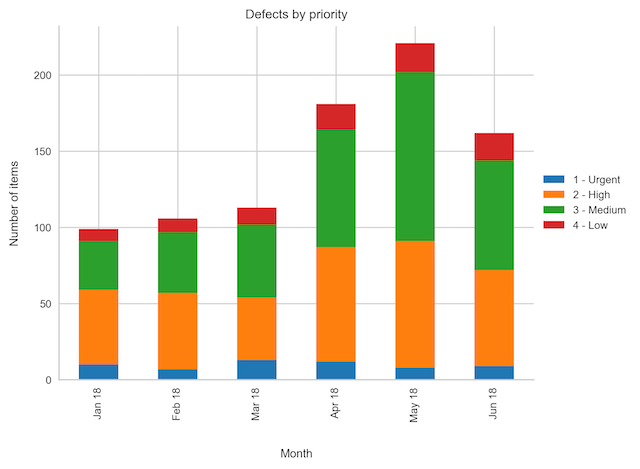
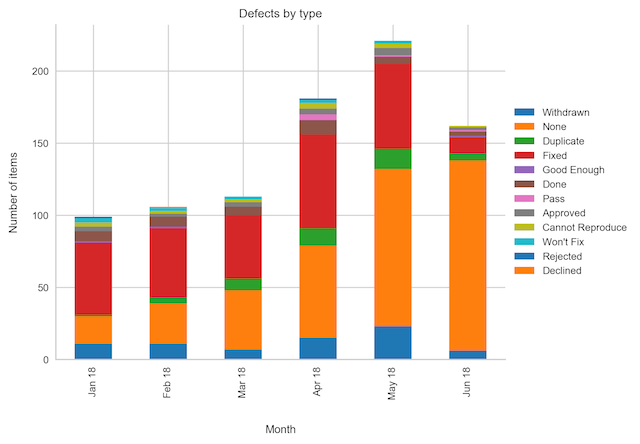
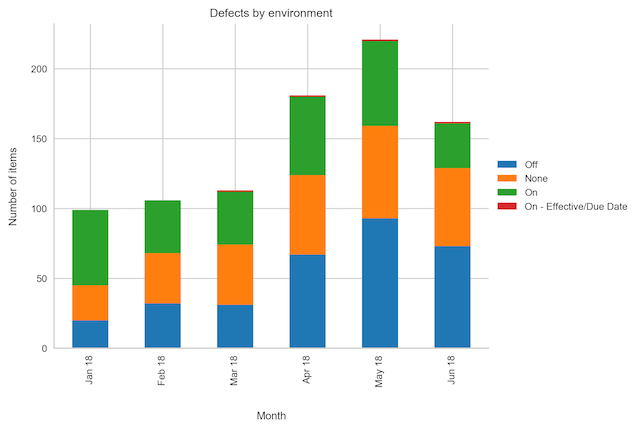
Three charts for analysing the amount of defects that have been open historically, grouped in various ways into stacked bar graphs.
These charts all rely on a separate JIRA query:
Defects query: issueType = Bug
Again, you can use the filter=123 JQL syntax to delegate the query specifics
to a named filtered.
The three available groupings are:
- Show how many defects remained open each month, grouped by priority.
- Show how many defects remained open each month, grouped by type.
- Show how many defects remained open each month, grouped by environment.
They each require you to specify the name of the relevant field, and a chart output. You can also optionally specify a list of allowed values for each field, which lets you control the order. Finally, you can specify a "window" of how many of the most recent months to show (the default is to show all months for which there is data). Here is an example that enables all charts, and limits to showing the six most recent months in each:
Defects query: issueType = Bug
Defects window: 6
Defects priority field: Priority
Defects priority values:
    - Low
    - Medium
    - High
Defects type field: Root cause
Defects type values:
    - Config
    - Data
    - Code
Defects environment field: Environment
Defects environment values:
    - SIT
    - UAT
    - PROD

Defects by priority chart: defects-by-priority.png
Defects by priority chart title: Defects by priority
Defects by type chart: defects-by-type.png
Defects by type chart title: Defects by type
Defects by environment chart: defects-by-environment.png
Defects by environment chart title: Defects by environment
If you omit any of the chart names, the relevant chart will not be produced. If you omit any of the field names, the relevant chart will not be stacked. If you omit the values list, all unique values will be shown.
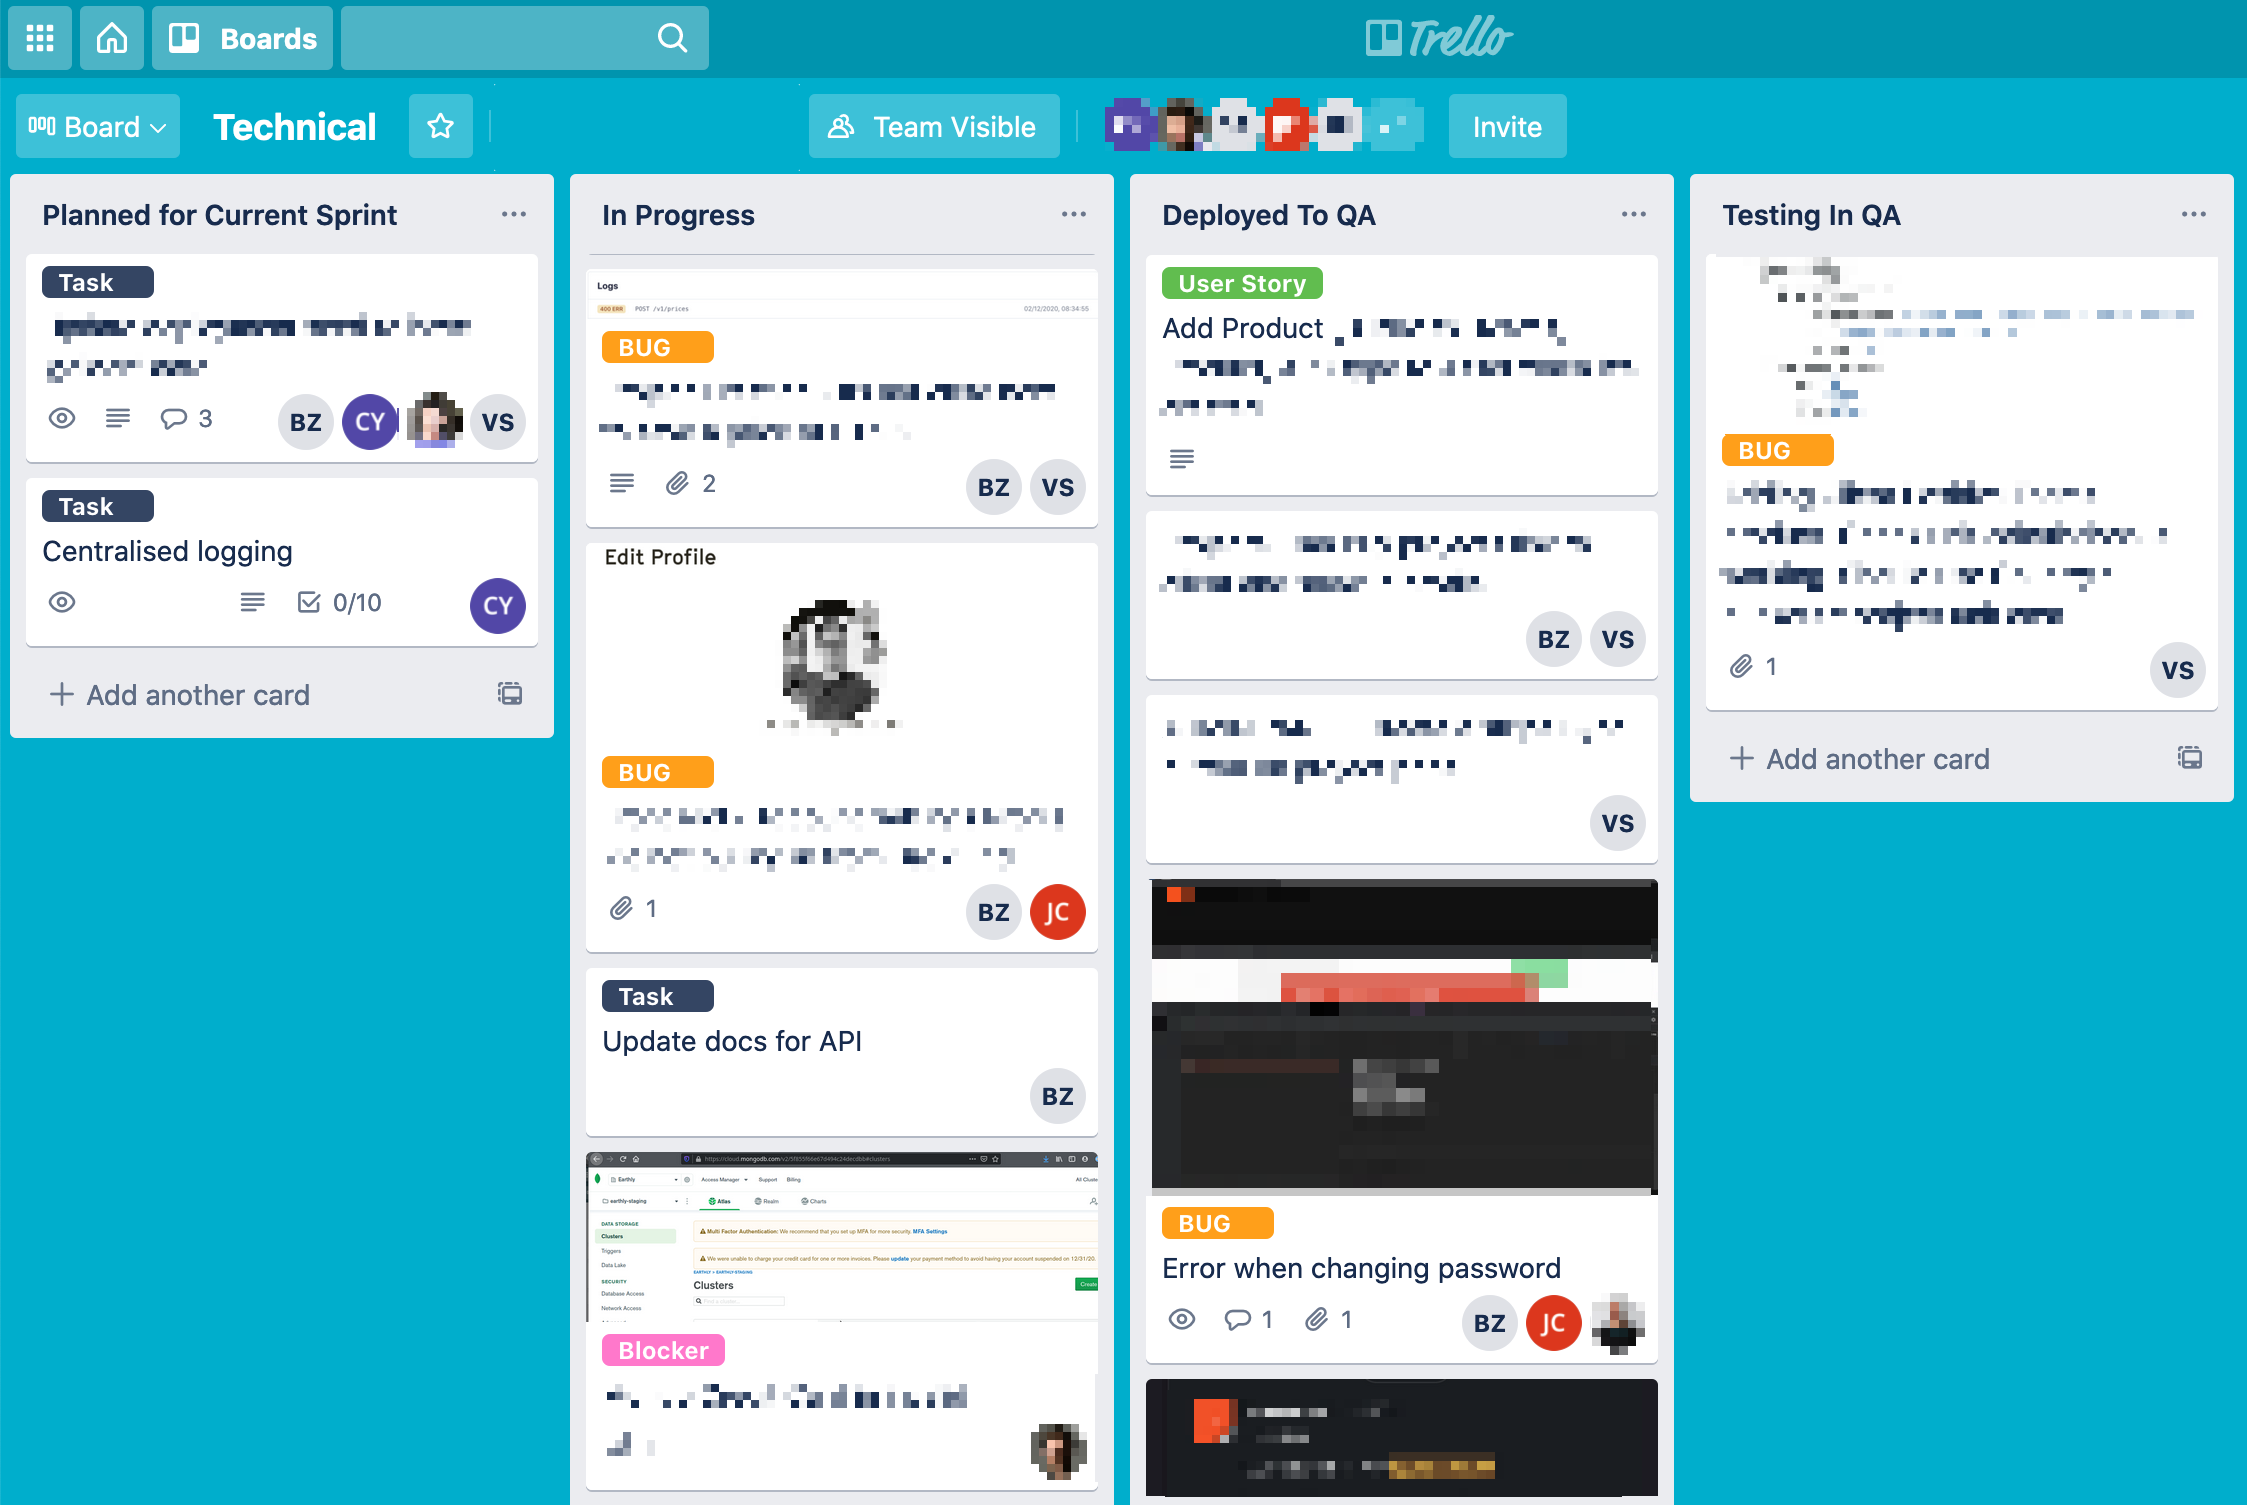
As Trello does not have different issue types you need to use a different way of identifying failure demand. The tool allows you to map a Trello label to an issue type:
Type Mapping:
    Defect:
        - bug
This allows you to analyse failure demand separately from value demand in ActionableAgile:
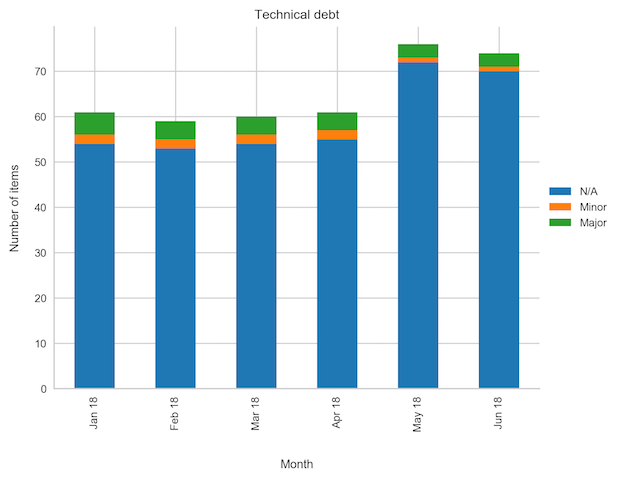
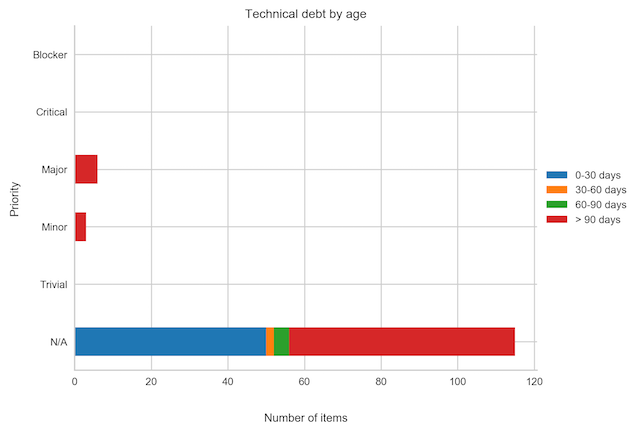
Two charts that show the nature and age of recorded (unresolved) technical debt.
These require a separate JIRA query. You should also identify the field indicating priority:
Debt query: issueType = "Tech debt"
Debt priority field: Priority
Debt priority values:
    - Low
    - Medium
    - High
As ever, use filter=123 to use a named filter instead. If you omit the
Debt priority values option, all unique priority values will be used, in
alphabetical order.
The first chart shows the open technical debt items each month as a stacked bar chart grouped by priority. You can optionally specify a "window" to show only a limited number of the most recent months:
Debt window: 3
Debt chart: tech-debt.png
Debt chart title: Technical debt
The second chart shows the number of open technical debt items by their current age in days, broken down by priority, and stacked into "bins":
Debt age chart: tech-debt-age.png
Debt age chart title: Technical debt age
Debt age chart bins:
    - 30
    - 60
    - 90
This will use the age brackets 0-30 days, 31-60 days, 61-90 days, and over 90 days (which also happens to be the default).
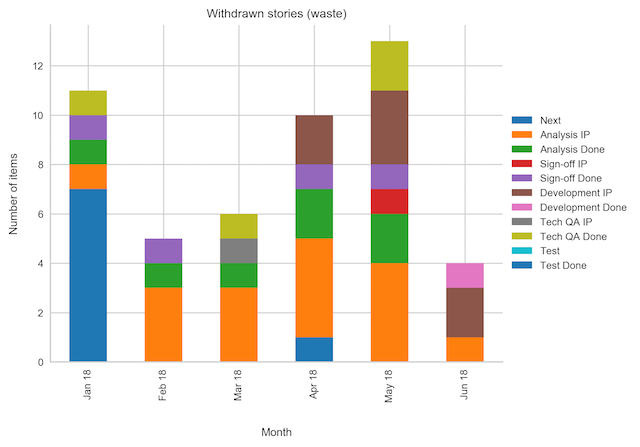
This chart shows how many work items are withdrawn or cancelled after work
has started. It relies on a separate JIRA query, and assumes that withdrawn
work items are all "resolved" in JIRA. Moreover, it assumes that these work
items follow the same workflow as that used for the other charts and files,
i.e. as mapped in the Workflow section of the configuration file.
Here is an example:
Waste query: issueType = Story AND resolution IN (Withdrawn, Invalid)
Waste window: 10
Waste frequency: 2W-WED
Waste chart: waste.png
Waste chart title: Waste
This will show withdrawn items broken down by the period in which they were
withdrawn for the the 10 most recent periods. The default period length is
monthlyasfd, but here we have set it to 2W-WED, which means a two-week period
starting on a Wednesday. Waste window and Waste frequency are both
optional.
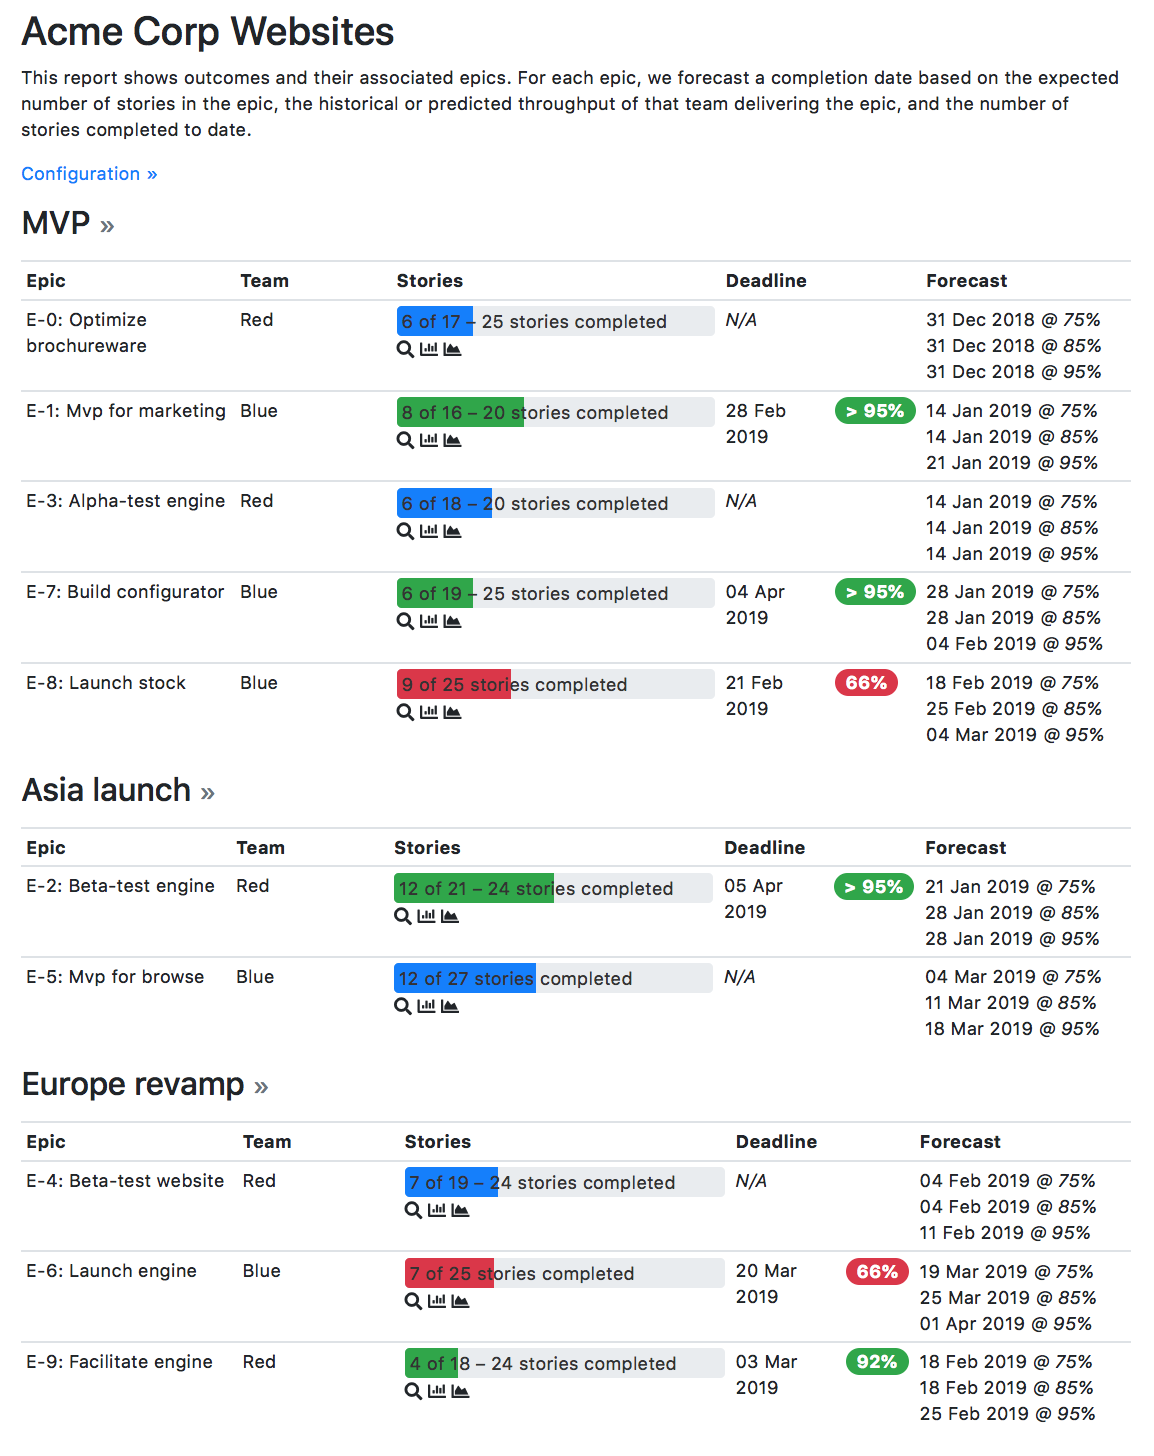
An status report that uses Monte Carlo simulation forecasting at the epic level.
The report is presented as a self-contained HTML file with embedded images. It relies on a small number of commonly used, externally hosted libraries (the Bootstrap CSS/JS library and its jQuery dependency; the Fontawesome icon font), but can be served from any static web server or opened as a local file on any modern web browser. It should also print reasonably well, although the embedded images showing context-specific Cumulative Flow Diagrams and Cycle Time Scatter Plots are only accessible by clicking on the relevant icons in a browser.
The status report is based on the principle of outcomes (e.g. projects, releases, objectives) that are broken down into epics, which will eventually be further broken down into stories. Epics are assumed to be fully owned by exactly one team. Epics and stories are represented by JIRA tickets discoverable by JQL queries specified in the configuration file, whereas outcomes and teams are enumerated in the configuration file directly.
A forecast to complete is then produced for each epic by calculating:
- the presumed number of stories in the epic (randomly sampling between a minimum and maximum number of stories as set on the epic ticket in JIRA, or using the total number of stories raised against the epic, if higher);
- the number of stories raised against the epic that have been completed to date;
- and the presumed throughput of the relevant team (randomly sampled, either from a range of the minimum to maximum number of stories the team can complete per week, or through a JQL query that identifies the team's historical performance).
This is done many times over in a Monte Carlo simulation, to identify a range of plausible completion dates. If a deadline is set on an epic, the forecast to complete will be compared with it, to highlight the likelihood of hitting the deadline. (Deadlines may also be set at the outcome-level, in which case the outcome deadline is the default for all epics.)
The simulation takes into account that a single team may have multiple epics to complete. A team can be configured to have an epic WIP limit of 1 (the default) or more. If the team is working on more than one epic at a time, it is assumed to distribute its throughout roughly evenly across all active epics, and to work through the epics in the order in which their respective outcomes are listed in the configuration file, and then in the order in which they are returned by the query used to find them.
Here is a complete example configuration file that produces a report akin to the screenshot above:
Connection:
    # not shown

# ...

# Used for calculating progress against an epic, and team throughput: to
# identify whether stories are in the backlog, in progress, or completed.
Workflow:
    Backlog: Backlog
    Committed: Next
    Build: Build
    Test:
        - Code review
        - QA
    Done: Done

Output:
    # Used to determine which percentiles to show in the forecast
    Quantiles:
        - 0.75
        - 0.85
        - 0.95

    # The name of the file to write. If not set, the progress report will
    # not be produced
    Progress report: progress.html

    # Report title
    Progress report title: Acme Corp Websites

    # Names of JIRA fields on epics, used to determine the deadline, team,
    # and min/max stories. All are optional:

    # - if no deadline field is set, the report will not include any
    #   deadline calculations
    Progress report epic deadline field: Due date

    # - if no team field is set, you must specify exactly one team under
    #   `Progress report teams`, which will be used for all epics
    Progress report epic team field: Team

    # - if no min stories field is set, the story count will be based solely
    #   on the number of stories raised against each epic, rather than an
    #   estimated range; if no max stories field is set, the min stories
    #   field will be used to identify an absolute value
    Progress report epic min stories field: Min stories
    Progress report epic max stories field: Max stories

    # The query used to identify epics for each outcome. The special
    # placeholder `{outcome}` will be replaced by the outcome key (or name,
    # if the key is not set). May be overridden by the `Epic query` set on
    # an individual outcome. If not set, the `Epic query` must be specified
    # on each outcome, and it is not possible to use outcomes as tickets.
    Progress report epic query template: project = ABC AND type = Epic AND Outcome = {outcome} ORDER BY created

    # The query used to identify stories for an epic. The placeholders
    # `{epic}`, `{outcome}`, and `{team}` may be used to parameterise the
    # query.
    Progress report story query template: project = ABC AND type = Story AND "Epic link" = {epic}

    # A list of teams. At least one team is required, and each team must
    # have a `Name` and *either* `Min throughput` and `Max throughput`
    # (stories per week), *or* a query in `Throughput samples`. `WIP`
    # (number of epics the team may work on in parallel) and
    # `Throughput samples window` (number of weeks in the past from which to
    # draw samples) are optional. The placeholder `{team}` can be used to
    # reference the team name in the samples query.
    Progress report teams:
        - Name: Red
          Min throughput: 5
          Max throughput: 10
        - Name: Blue
          WIP: 2
          Throughput samples: project = ABC AND type = Story AND Team = {team}
          Throughput samples window: 6

    # A list of outcomes. May be omitted, in which case epics will not be
    # grouped into outcomes and the `Progress report epic query template`
    # specifies a non-parameterised query for all relevant epics. If
    # included, each outcome must have a `Name`. `Key`, which is used in
    # the epic query template, is optional, defaulting to the same value as
    # `Name`. `Deadline` can be used to specify a deadline for all epics
    # in the report, which can be overridden on a per-epic basis.
    # `Epic query` may be used to specify a particular query for
    # epics, overriding the more general `Progress report epic query template`.
    Progress report outcomes:
        - Name: MVP
          Key: O1
          Deadline: 2019-01-01
        - Name: Asia launch
          Key: O2
        - Name: Europe revamp
          Key: O3
          Epic query: project = ABC and type = Feature
In this example, we have listed the outcomes explicitly in the configuration file. It is also possible for the outcomes to be managed as JIRA ticket (or even to mix the two approaches). To do this, you need to specify a query for finding the outcomes:
    Progress report outcome query: project = ABC AND type = Outcome AND resolution IS EMPTY ORDER BY summary

    # Optionally give a field name for the outcome-level deadline, which
    # will be used as a fallback if epic-level deadlines are not set
    Progress report outcome deadline field: Due date
If using tickets to specify outcomes, Progress report epic query template must
be set. The {outcome} placeholder will be replaced by the relevant outcome
ticket key. You can thus use a linked issue field to specify the outcome.
In a simpler use case, you can model a single team performing all work, and/or dispense with the "outcome" level entirely, modelling only epics. The estimated min/max story count and the entire concept of deadlines are also optional.
Here is a minimal example:
# ...

Workflow:
    Backlog: Backlog
    Committed: Next
    Build: Build
    Test:
        - Code review
        - QA
    Done: Done

Output:

    Quantiles:
        - 0.75
        - 0.85
        - 0.95

    Progress report: progress-minimal.html
    Progress report title: Acme Corp Websites
    Progress report epic min stories field: Story count
    Progress report epic query template: project = ABC AND type = Epic AND resolution IS EMPTY ORDER BY created
    Progress report story query template: project = ABC AND type = Story AND "Epic link" = {epic}
    Progress report teams:
        - Name: Default
          Min throughput: 5
          Max throughput: 10
You can also turn off forecasts for some or all teams, if you don't have
confidence in the predictability of team pace or in the underlying data quality.
You will still get the progress bars and charts. In this case, you can either
omit the Min throughput / Max throughput fields for a specific team, or
omit the Progress report teams section in its entirety.
Team names will be taken from the relevant field on epics (presuming an epic
team field name is specified):
# ...

Workflow:
    Backlog: Backlog
    Committed: Next
    Build: Build
    Test:
        - Code review
        - QA
    Done: Done

Output:

    Quantiles:
        - 0.75
        - 0.85
        - 0.95

    Progress report: progress-teams.html
    Progress report title: Acme Corp Websites
    Progress report epic min stories field: Story count
    Progress report epic query template: project = ABC AND type = Epic AND resolution IS EMPTY ORDER BY created
    Progress report story query template: project = ABC AND type = Story AND "Epic link" = {epic}
    Progress report epic team field: Team
Technically you can omit both the teams list (so no forecasts) and the team field name, in which case you just get a breakdown of the epics with no forecasting or grouping.
Also note that if you do specify a list of teams and an epic team field, the list of teams will be automatically extended with any team names found that are not explicitly listed in the configuration.
The configuration file is written in YAML format. If you are unfamiliar with YAML, know that:
- Comments start with
# - Sections are defined with a name followed by a colon, and then an indented
block underneath.
Connection,Output,WorkflowandAttributesarea all sections in the example above. - Indentation has to use spaces, not tabs!
- Single values can be set using
Key: valuepairs. For example,Burnup chart: burnup.pngabove sets the keyBurnup chartto the valueburnup.png. - Lists of values can be set by indenting a new block and placing a
-in front of each list value. In the example above, theQAlist contains the valuesCode reviewandTest.
The sections for Workflow is required. Additionally, you must either specfiy a
single Query, or a block of Queries (see below). Connection details must
be set either in the Connection file or as command line arguments.
Under Workflow, at least two steps are required. Specify the steps in order.
You may either specify a single workflow value or a list (as shown for QA
above), in which case multiple JIRA statuses will be collapsed into a single
state for analytics purposes.
The file, and values for things like workflow statuses and attributes, are case insensitive.
You may want to add additional fields to the cycle time output data. Use an
Attributes block to do this:
Attributes:
    Priority: Priority
    Release: Fix version/s
    Team: Team name
Here, three additional columns will be added: Priority, Release and Team,
corresponding to the JIRA fields Priority, Fix version/s and Team name,
respectively.
When specifying attributes, use the name of the field (as rendered on screen
in JIRA), not its id (as you might do in JQL), so e.g. use Component/s not
components.
The attributes Type (issue type), Status and Resolution are always
included.
Some fields in JIRA can contain multiple values, e.g. fixVersion. By default,
the extractor will use the first value in such a field if one is specified in
the Attributes block. However, you may want to extract only specific values.
To do so, add a block like the following::
Attributes:
    Release: Fix version/s

Known values:
    Release:
        - "R01"
        - "R02"
        - "R03"
The extractor will pick the first "known value" found for the field. If none of the known values match, the cell will be empty.
If it is difficult to construct a single set of criteria that returns all
required issues, multiple queries can be added into a Queries block, like so:
Queries:
    Attribute: Team
    Criteria:
        - Value: Team 1
          JQL: (filter=123)

        - Value: Team 2
          JQL: (filter=124)
In this example, two queries will be run, based on the two filters 123 and
124 (you can use any valid JQL).
In the cycle time output, a new column called Team will be added, as specified
by the Attribute field under Queries. For all items returned by
the first query, the value will be Team 1 as per the Value field, and for
all items returned by the second query, it will be Team 2.
-
If Excel complains about a
SYLKformat error, ignore it. Click OK. See https://support.microsoft.com/en-us/kb/215591. -
JIRA error messages may be printed out as HTML in the console. The error is in there somewhere, but may be difficult to see. Most likely, this is either an authentication failure (incorrect username/password or blocked account), or an error in the
Queryoption resulting in invalid JQL. -
If you aren't getting the issues you expected to see, use the
-voption to see the JQL being sent to JIRA. Paste this into the JIRA issue filter search box ("Advanced mode") to see how JIRA evaluates it. -
Old workflow states can still be part of an issue's history after a workflow has been modified. Use the
-voption to find out about workflow states that haven't been mapped. -
Excel sometimes picks funny formats for data in CSV files. Just set them to whatever makes sense.
-
If you are on a Mac and you get an error about Python not being installed as a framework, try to create a file
~/.matplotlib/matplotlibrcwith the following contents:backend : Agg
-
To install the charting dependencies on a Mac, you might need to install a
gfortrancompiler forscipy. Use Homebrew and install thegccbrew.
The following options can be set in the Output: section of the configuration
file.
These options affect multiple charts and files.
Quantiles: <list>– Quantiles to use when calculating percentiles.Backlog column: <name>--Name of the backlog column. Defaults to the first column.Committed column: <name>– Name of the column from which work is considered committed. Defaults to the second column.Final column: <name>– Name of the final 'work' column. Defaults to the penultimate column.Done column: <name>– Name of the 'done' column. Defaults to the last column.
These options name data files to write. Use an extension of .csv, .xlsx, or
.json according to the required file format. May be specified as either a list
of filenames, or a single filename.
Cycle time data: <filename>.[csv,xlsx,json]– Output file suitable for processing Actionable Agile. Contains all issues described by the configuration file, metadata, and dates of entry to each state in the cycle.CFD data: <filename>.[csv,xlsx,json]– Calculate data to draw a Cumulative Flow Diagram and write to file. Hint: Plot as a (non-stacked) area chart.Scatterplot data: <filename>.[csv,xlsx,json]– Calculate data to draw a cycle time scatter plot and write to file. Hint: Plot as a scatter chart.Histogram data: <filename>.[csv,xlsx,json]– Calculate data to draw a cycle time histogram and write to file. Hint: Plot as a column chart.Throughput data: <filename>.[csv,xlsx,json]– Calculate daily throughput data and write to file. Hint: Plot as a column chart. Respects theThroughput frequencysetting (see below).Percentiles data: <filename>.[csv,xlsx,json]– Calculate cycle time percentiles and write to file.Impediments data: <filename>.[csv,xlsx,json]– Output impediment start and end dates against tickets.
Scatterplot window: <number>– Number of recent days to show in scatterplot. Defaults to showing all data.Scatterplot chart: <filename>.png– Draw cycle time scatter plot.Scatterplot chart title: <title>– Title for cycle time scatter plot.
Histogram window: <number>– Number of recent days to show in histogram. Defaults to showing all data.Histogram chart: <filename>.png– Draw cycle time histogram.Histogram chart title: <title>– Title for cycle time histogram.
CFD window: <number>– Number of recent periods to show in the CFD. Defaults to showing all periods.CFD chart: <filename>.png– Draw Cumulative Flow Diagram.CFD chart title: <title>– Title for the CFD.
Throughput frequency: <freq>– Interval to use for calculating frequency, e.g. 1D for daily or 1W for weekly.Throughput window: <number>– Number of recent periods to show in throughput chart. Defaults to showing all periods.Throughput chart: <filename>.png– Draw weekly throughput chart with trend line.Throughput chart title: <title>– Title for throughput chart.
Burnup window: <number>– Number of recent periods to show in burnup. Defaults to showing all periods.Burnup chart: <filename>.png– Draw simple burn-up chart.Burnup-chart-title <title>– Title for burn-up charts_scatterplot.
Burnup forecast window: <number>– Number of recent periods to show in the burnup forecast chart. Defaults to showing all periods.Burnup forecast chart: <filename>.png– Draw burn-up chart with Monte Carlo simulation forecast to completion.Burnup forecast chart title: <title>– Title for burn-up forecast chart.Burnup forecast chart target: <number>– Target completion scope for forecast. Defaults to current size of backlog.Burnup forecast chart deadline: <date>– Deadline date for completion of backlog. If set, it will be shown on the chart, and the forecast delta will also be shown. Use ISO date format, e.g.2018-01-02for January 2nd 2018.Burnup forecast chart deadline confidence: <number>– Quantile to use when comparing deadline to forecast. Use a fraction, e.g.0.85.Burnup forecast chart trials: <number>– Number of iterations in Monte Carlo simulation.Burnup forecast chart throughput window: <number>– How many days in the past to use for calculating throughput.Burnup forecast chart throughput window end: <date>– By default, the throughput window runs to today's date. Use this option to set an alternative end date for the window. Use ISO date format, e.g.2018-01-02for January 2nd 2018.
WIP frequency: <freq>– Frequency interval for WIP chart.1W-Monmeans 1 week, starting Mondays.WIP window: <number>– Number of recent periods to show in WIP chart. Defaults to showing all periods.WIP chart: <filename>.png– Draw weekly WIP box plot.WIP chart title: <title>– Title for WIP chart
Ageing WIP chart: <filename>.png– Draw current ageing WIP chart.Ageing WIP chart title: <title>– Title for ageing WIP chart.
Net flow frequency: <freq>– Frequency interval for net flow chart.1W-Monmeans 1 week, starting Mondays.Net flow window: <number>– Number of recent periods to show in net flow chart. Defaults to showing all periods.Net flow chart: <filename>.png– Draw weekly net flow bar chart.Net flow chart title: <title>– Title for net flow bar chart.
Impediments window: <number>– How many months to show.Impediments chart: <filename>.png– Draw a bar chart of the number of active impediments during each month, stacked by the impediments flag set.Impediments chart title: <title>– Title for the impediments chart.Impediments days chart: <filename>.png– Draw a bar chart of the total number of days of all the impediments active during each month, stacked by the impediments flag set.Impediments days chart title: <title>– Title for the impediments days chart.Impediments status chart: <filename>.png– Draw a bar chart of the number of active impediments during each month, stacked by the ticket status at the time the impediment was raised.Impediments status chart title: <title>– Title for the impediments status chart.Impediments status days chart: <filename>.png– Draw a bar chart of the total number of days of all the impediments active during each month, stacked by the ticket status at the time each impediment was raised.Impediments status days chart title: <title>– Title for the impediments status days chart.
-
Defects query: <query>– JQL query used to identify defects. -
Defects window: <number>– How many months to show. -
Defects priority field: <fieldname>– Name of field identifying defect priority. -
Defects priority values: <list>– List of valid values, in order, for defect priorities. -
Defects type field: <fieldname>– Name of field identifying defect type. -
Defects type values: <list>– List of valid values, in order, for defect values. -
Defects environment field: <fieldname>– Name of field identifying the environment in which a defect was discovered. -
Defects environment values: <list>– List of valid values, in order, for defect environments. -
Defects by priority chart: <filename>.png– Draw stacked bar chart of defects grouped by priority over time. -
defects-by priority chart title: <title>– Title for defects-by-priority chart. -
Defects by type chart: <filename>.png– Draw stacked bar chart of defects grouped by type over time. -
Defects by type chart title: <title>– Title for defects-by-type chart. -
Defects by environment chart: <filename>.png– Draw stacked bar chart of defects grouped by environment over time. -
Defects by environment chart title: <title>– Title for defects-by- environment chart.
-
Debt query: <query>– JQL query used to identify technical debt items. -
Debt window: <number>– How many months to show in the debt chart. Defaults to showing all months for which there is data. -
Debt priority field: <fieldname>– Name of field identifying technical debt item priority. -
Debt priority values: <list>– List of valid values, in order, for technical debt item priorities. -
Debt chart: <filename>.png– Draw a stacked bar chart of technical debt grouped by priority over time. -
Debt chart title: <title>– Title for the technical debt chart. -
Debt age chart: <filename>.png– Draw a stacked bar chart of technical debt grouped by priority by age. -
Debt age chart title: <title>– Title for the technical debt age chart. -
Debt age chart bins: <list>– List of bins for bracketing the ages shown. Defaults to30,60, and90, which will group ages into0-30 days,31-60 days,61-90 daysand91 days or more.
Waste query: <query>– JQL query used to identify waste items, e.g. those withdrawn after work has begun.Waste frequency: <freq>– Frequency to group waste chart by. Defaults to month start (MS). Use e.g.2W-WEDto group by fortnight starting Wednesday.Waste window: <number>– How many months to show.Waste chart: <filename>.png– Draw a stacked bar chart of wasted items, grouped by last non-resolved status.Waste chart title: <title>– Title for the waste chart.
Progress report: <filename>.html– Write progress report to a standalone HTML file.Progress report title: <title>– Title of the progress report page.Progress report epic deadline field: <fieldname>– Name of a date field giving the deadline of an epic.Progress report epic team field: <fieldname>– Name of a field giving the name of the team responsible for an epic.Progress report epic min stories field: <fieldname>– Name of an integer field giving the minimum number of stories expected for an epic, for forecasting purposes.Progress report epic max stories field: <fieldname>– Name of an integer field giving the maximum number of stories expected for an epic, for forecasting purposes.Progress report epic query template: <query>– Query used to identify epics for an outcome. The placeholder{outcome}will be substituted for the given outcome key (if set) or name.Progress report story query template: <query>– Query used to identify stories for an epic. The placeholder{epic}will be substituted for the given epic key (JIRA reference). The placeholders{outcome}and{team}may also be used to identify the outcome key/name and team name, respectively.Progress report teams: <list>– A list of records with keysName,WIP,Min throughput,Max throughput,Throughput samplesand/orThroughput samples windowwhich specify the teams that may be associated with epics.Nameis required, and you can specify eitherMin/Max throughput(numeric values, in stories per week) orThroughput samples, which is a JQL query to identify stories for the given team for the purpose of calculating historical throughput. IfThroughput samples windowis given, it specifies the number of weeks into the past (from today's date) to use when calculating historical throughput. You can use the placeholder{team}inThroughput samplesas a shortcut to repeating the team name.WIPdefaults to 1.Progress report outcomes: <list>– A list of records with keysName,Key,Deadline, and/orEpic query, which specify the outcomes to list on the progress report.Keywill default to the same value asName.Deadlinewill be used as a fallback if an epic level deadline is not set.Epic query, if given, takes precedence overProgress report epic query templatewhen finding epics for this outcome.Progress report outcome query: <query>– Allows outcomes to be enumerated in JIRA issues, rather than theProgress report outcomeslist. Each matching issue will be used as an outcome, with the outcome key for the epic query template being the issue key and the issue summary being the outcome title. If used,Progress report epic query templatemust be set.Progress report epic deadline field: <fieldname>– Name of a date field giving the deadline of an outcome. Used as a fallback if no epic-level deadline is set. Optional.
- Added suppport for Trello.
- Allow using either field id or title for field names in the progress report.
- Fix several errors that would occur when running with no defined teams or outcomes in the configuration file.
- Allow deadline to be set on outcomes as a fallback for epic level deadlines
- Add support for
Progress report outcome queryandProgress report outcome deadline field. - Allow progress report to run without a forecast for some/all teams.
- Allow progress report to be run without teams being explicitly defined. Team names are picked up from the epic teams field if specified, and no forecasting will take place for such teams.
- Add target and deadline lines to epic level CFDs in progress report.
- Add out-come level CFD in progress reports.
- Add support for
Extendsin config file. - Allow
-oas an alias for--output-directory
- Allow progress report output to be viewed by team as well as by outcome.
- Use a cumulative distribution function definition of a percentile when calculating chance of hitting the deadilne (basically: if the deadline is in the same week as the forecast worst case date, treat it as 100% not 50% likely)
- Fix a crash with newer versions of Pandas calculating CFD charts
- Don't show a forecast for epics that are complete
- Make logging output date/time and logging level again for easier debugging
- Attempted fix for throughput calculator crashing in some edge cases
- Brown bag
- Force min/max stories fields to integers even if string fields in JIRA
- Log which state change caused a backward move
- Make sure change history is always iterated in date order, even if JIRA returns them differently.
- Preserve background colour in print CSS for progress report
- Allow use of
{team}placeholder in team throughput sample query.
- Added progress report calculator
- Fixed issue with web server where template would not load if the package was installed as an egg (i.e. not from source)
- Make it possible to optionally specify multiple output files (via YAML lists)
for
* data:file names. The use case here is to output both a CSV/XLSX and JSON version of thecycletimecalculations, for example. - Stop swallowing exceptions in calculators (but keep on doing so when writing output files). It's too confusing to debug problems.
- Made the default impediments charts use the impeded flag value as breakdown,
and added specific
Impediments status *charts for breakdown by status.
- Added
--http-proxyand--https-proxyoptions to command line, and correspondingHTTP ProxyandHTTPS Proxyin theConnectionsection.
- Turn throughput chart into a line chart
- Don't log every list value resolution at debug
- Added batch mode docker image
- Added impediments charts
- Added debt, defects, and waste charts.
- Added
windowoptions to most charts.
- Added
--output-directoryoption.
- Forked from
jira-agile-metrics
