React Native Animated Pie Chart (with SVG and reanimated)
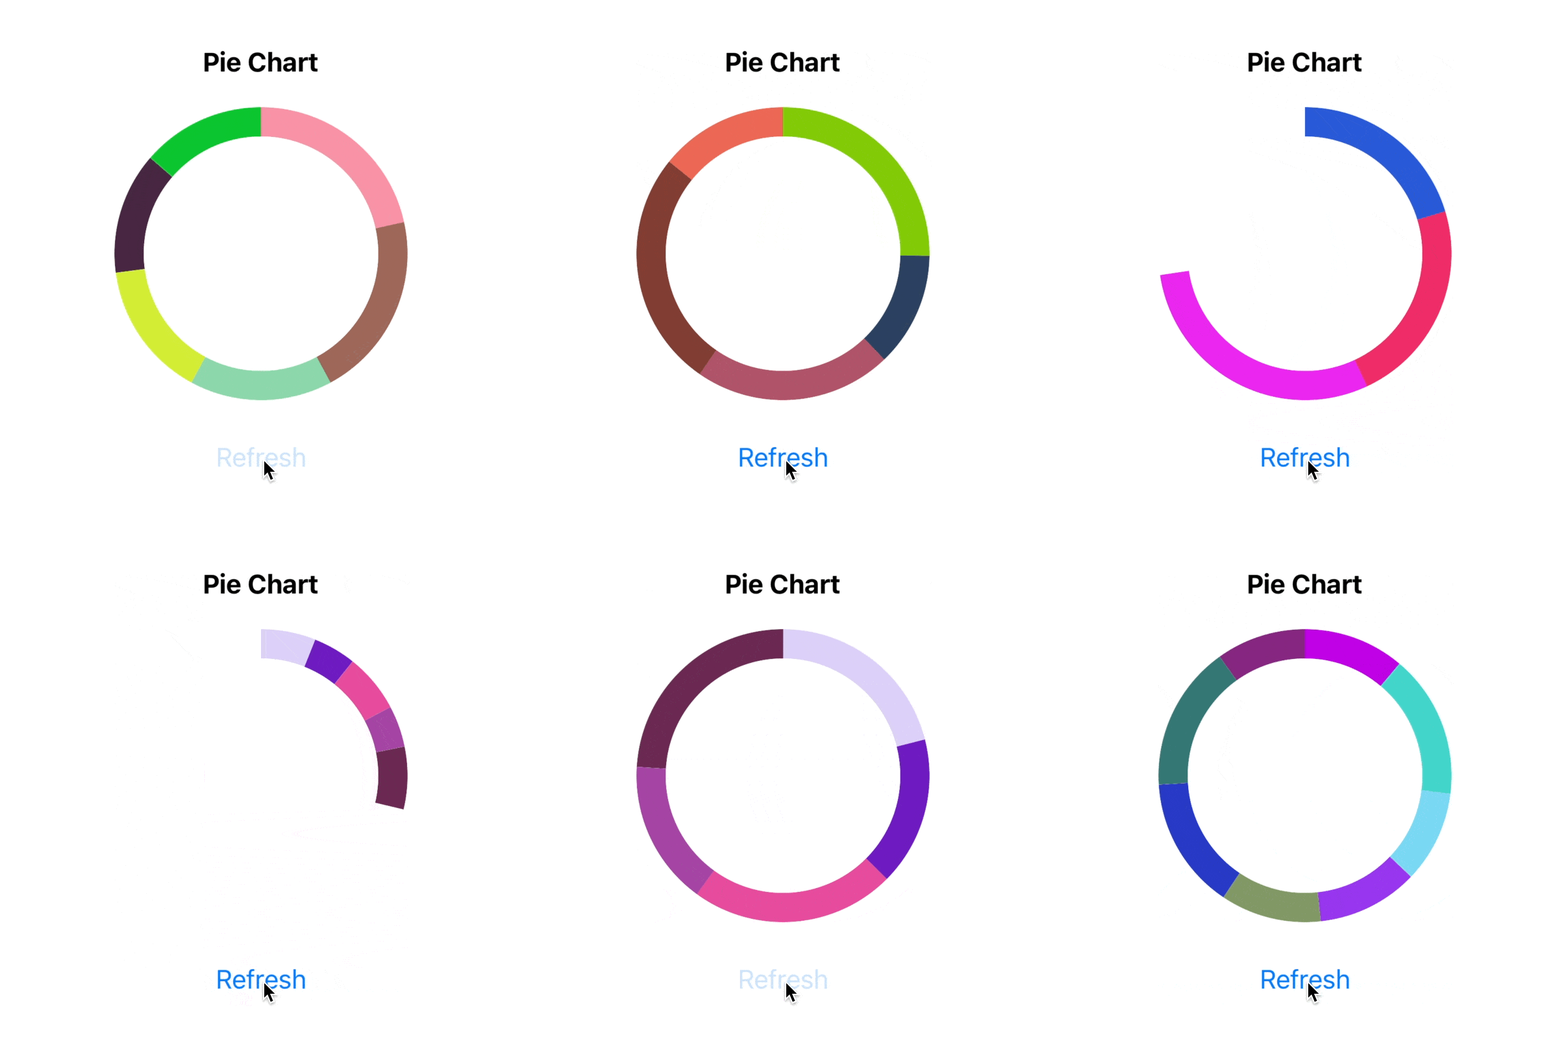
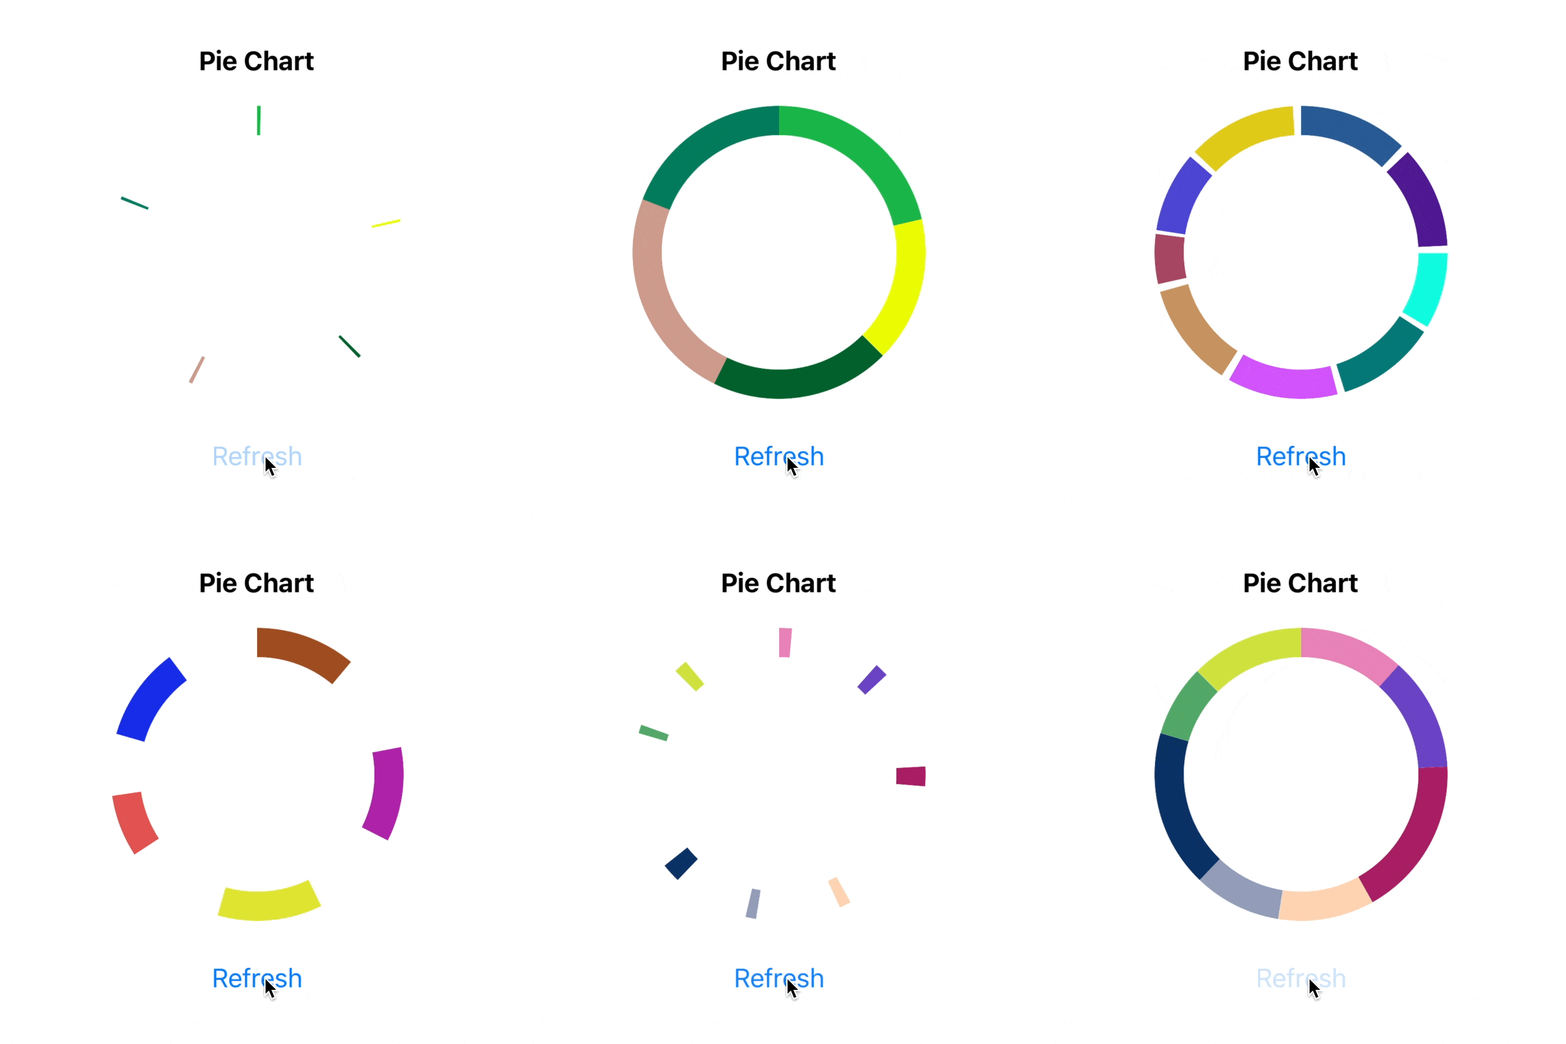
Hey folks! As the title said we will build a circular chart with react-native-svg and react-native-reanimated. Our final result will look like
On refresh action, we're generating random data for our chart and showing it in an animated manner.
Let's start with the template which has code generating random chart data.
export type PieChartData = {
  color: string;
  percent: number;
}[]
Since we have data we can start working on it's visualisation. Let's draw circle with react-native-svg first.
import Svg, {Circle} from 'react-native-svg';

const strokeWidth = 20;
const size = 200;
const center = size / 2;
const radius = (size - strokeWidth) / 2;

<Svg viewBox={`0 0 ${size} ${size}`}>
  <Circle
    cx={center}
    cy={center}
    r={radius}
    strokeWidth={strokeWidth}
    stroke={'blue'}
  />
</Svg>
So we added the root Svg component with viewBox of 200 x 200 size. And Circle inside with center, radius, stroke width, and color.
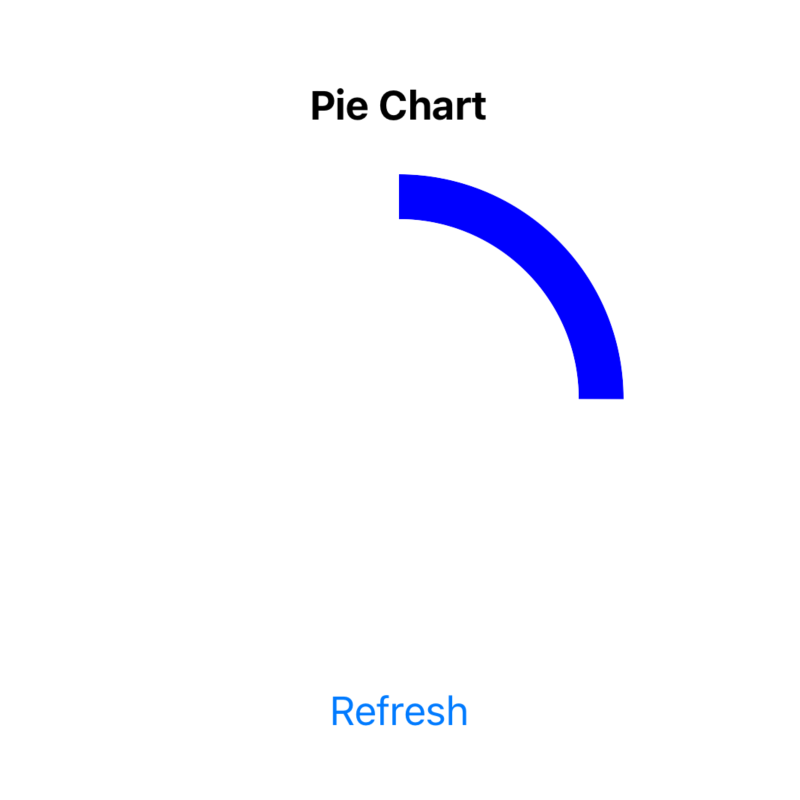
For the pie chart, we will need just a segment of a circle. We can archive it with strokeDashoffset and strokeDasharray params.
const circumference = 2 * Math.PI * radius;

<Circle
  // ...
  strokeDashoffset={circumference * (1 - 0.25)} // 25% circle segment
  strokeDasharray={circumference}
/>
First of all, we calculate the circumference. And if we want a circle segment length of 25% then the rest 75% suppose to be strokeDashoffset like circumference * (1 - 0.25).
Now we can loop over our data and draw all the chart segments.
<Svg viewBox={`0 0 ${size} ${size}`}>
  {data.map((item, index) => (
    <Circle
      key={`${item.color}-${index}`}
      cx={center}
      cy={center}
      r={radius}
      strokeWidth={strokeWidth}
      stroke={item.color}
      strokeDashoffset={circumference * (1 - item.percent)}
      strokeDasharray={circumference}
    />
  ))}
</Svg>
We drew segments but they place on top of each other. To fix this we can rotate each segment on a sum of the angles of previous segments.
const [startAngles, setStartAngles] = React.useState<number[]>([]);

const refresh = () => {
  const generatedData = generatePieChartData();

  let angle = 0;
  const angles: number[] = [];
  generatedData.forEach(item => {
    angles.push(angle);
    angle += item.percent * 360;
  });

  setData(generatedData);
  setStartAngles(angles);
};


<Circle
  // ...
  originX={center}
  originY={center}
  rotation={startAngles[index]}
/>
To get an angle for a segment we need to multiply 360 (degrees in a circle) by the chart item percent. To rotate each segment around the center we also need to specify originX and originY.
Ok, now we have a circle chart. Before starting animating it let's do small refactoring and move segment drawing in the separated component.
export const PieChartSegment: FC<{
  center: number;
  radius: number;
  strokeWidth: number;
  color: string;
  circumference: number;
  angle: number;
  percent: number;
}> = ({center, radius, strokeWidth, circumference, color, angle, percent}) => {
  return (
    <Circle
      cx={center}
      cy={center}
      r={radius}
      strokeWidth={strokeWidth}
      stroke={color}
      strokeDashoffset={circumference * (1 - percent)}
      strokeDasharray={circumference}
      originX={center}
      originY={center}
      rotation={angle}
    />
  );
};
Finally, let's use the reanimated library. Create AnimatedCircle component and use instead Circle.
import Animated from 'react-native-reanimated';

const AnimatedCircle = Animated.createAnimatedComponent(Circle);
Then we add animated value progress. Pass progress to the PieChartSegment and animate it with withTiming in the refresh function.
import Animated, {useSharedValue, withTiming} from 'react-native-reanimated';


export const PieChart = ({size = 200, strokeWidth = 20}: PieChartProps) => {
  const progress = useSharedValue(0);
  // ...

  const refresh = () => {
    // ...

    progress.value = 0;
    progress.value = withTiming(1, {
      duration: 1000,
    });
  };

  return (
    // ...
      <PieChartSegment
        // ...
        progress={progress}
      />
    // ...
  )
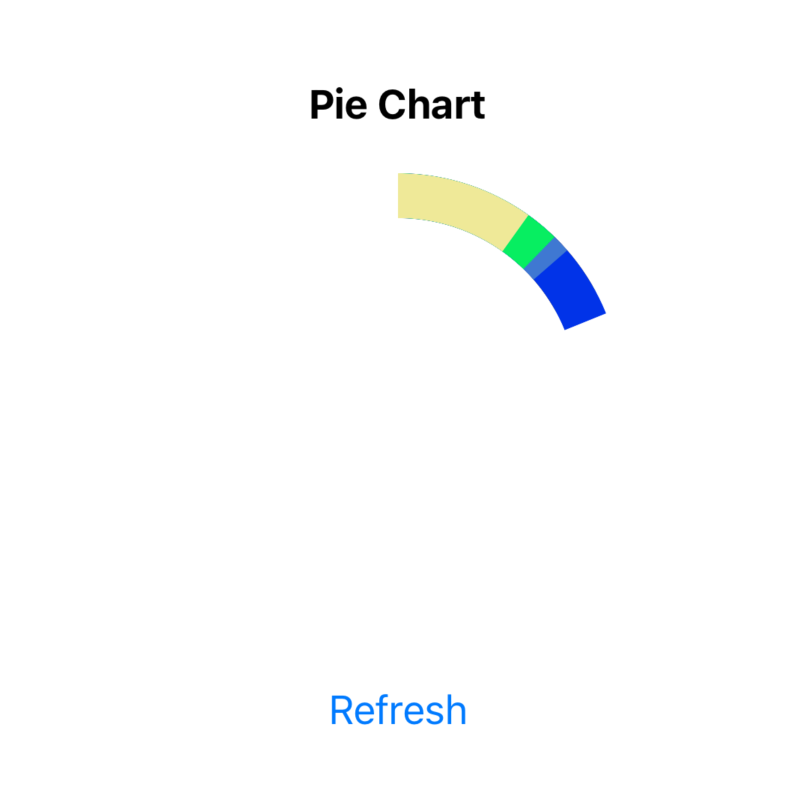
And in the PieChartSegment component, let's animate the segment length from 0 to its actual length.
const animatedProps = useAnimatedProps(() => {
  const strokeDashoffset = interpolate(
    progress.value,
    [0, 1],
    [circumference, circumference * (1 - percent)],
  );

  return {
    strokeDashoffset,
  };
});

return (
  <AnimatedCircle
    // ...
    animatedProps={animatedProps}
  />
);
Basically, we created animatedProps with strokeDashoffset interpolated value.
And the last step I want to do here is to animate the start position of each segment. Unfortunately, we can't simply interpolate rotation property (tbh I don't know why it just isn't working as I expect it). But we can't use the usual React Native transform styles.
const animatedProps = useAnimatedProps(() => {
  // ...
  const rotateAngle = interpolate(progress.value, [0, 1], [0, angle]);

  return {
    strokeDashoffset,
    transform: [
      {translateX: center},
      {translateY: center},
      {rotate: `${rotateAngle}deg`},
      {translateX: -center},
      {translateY: -center},
    ],
  };
});

return (
  <AnimatedCircle
    // ..
    // rotation={angle}
    // @ts-ignore
    animatedProps={animatedProps}
  />
);
Tricky part here is that you have to translate segment to the center, make rotation and then translate it back.
That's it. Final code is available on github. If you like it, please support me with likes and shares. Feel free to ask me anything in the comments.


