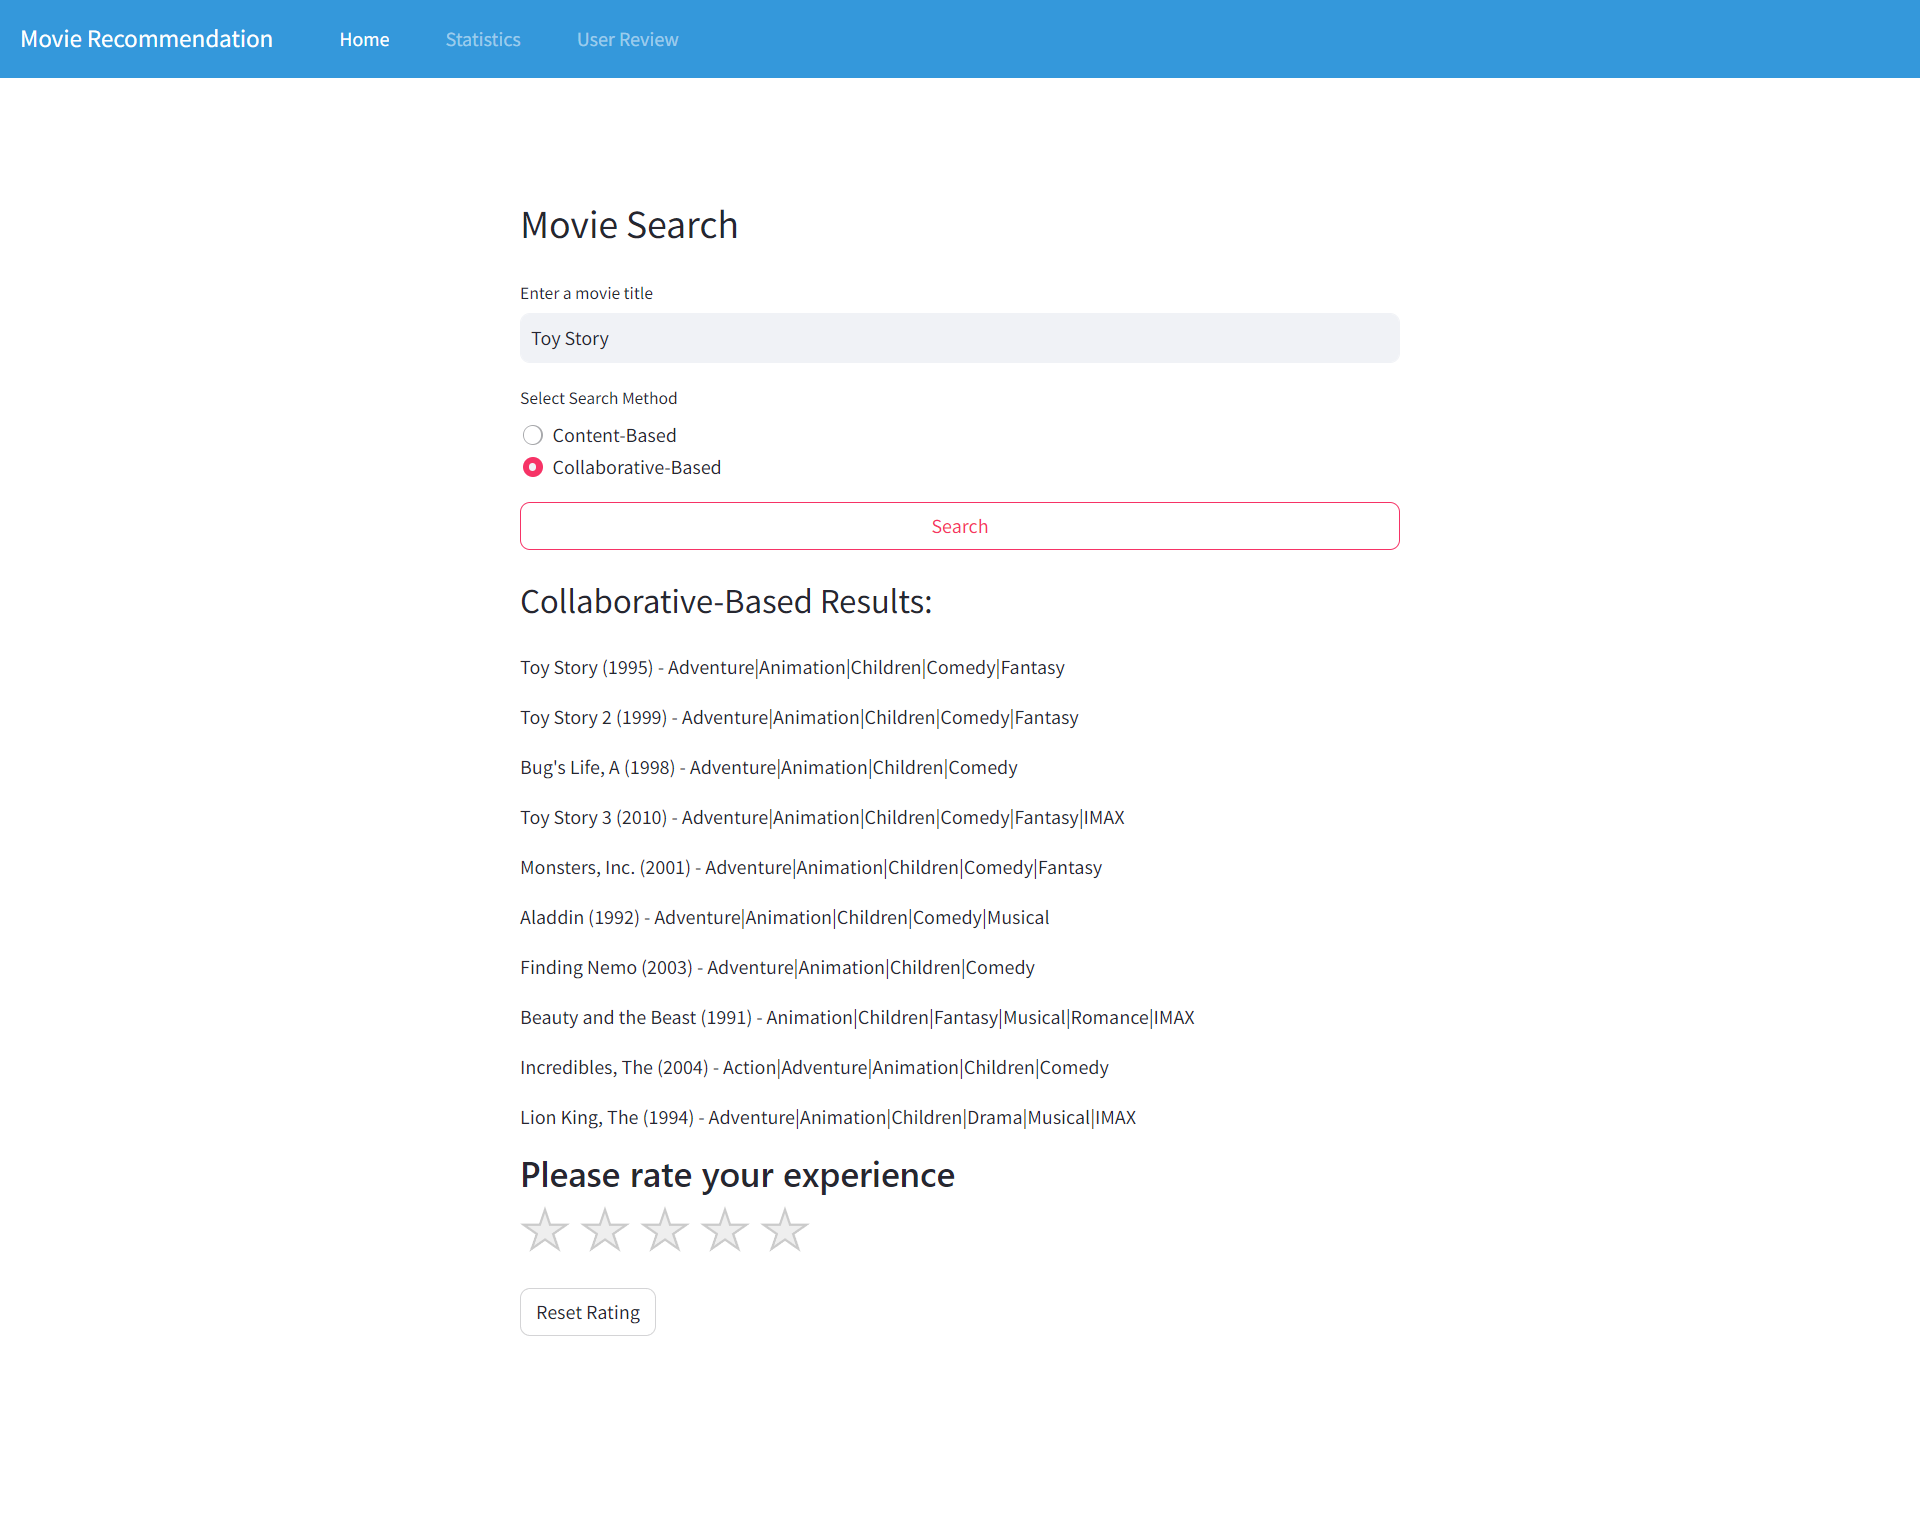
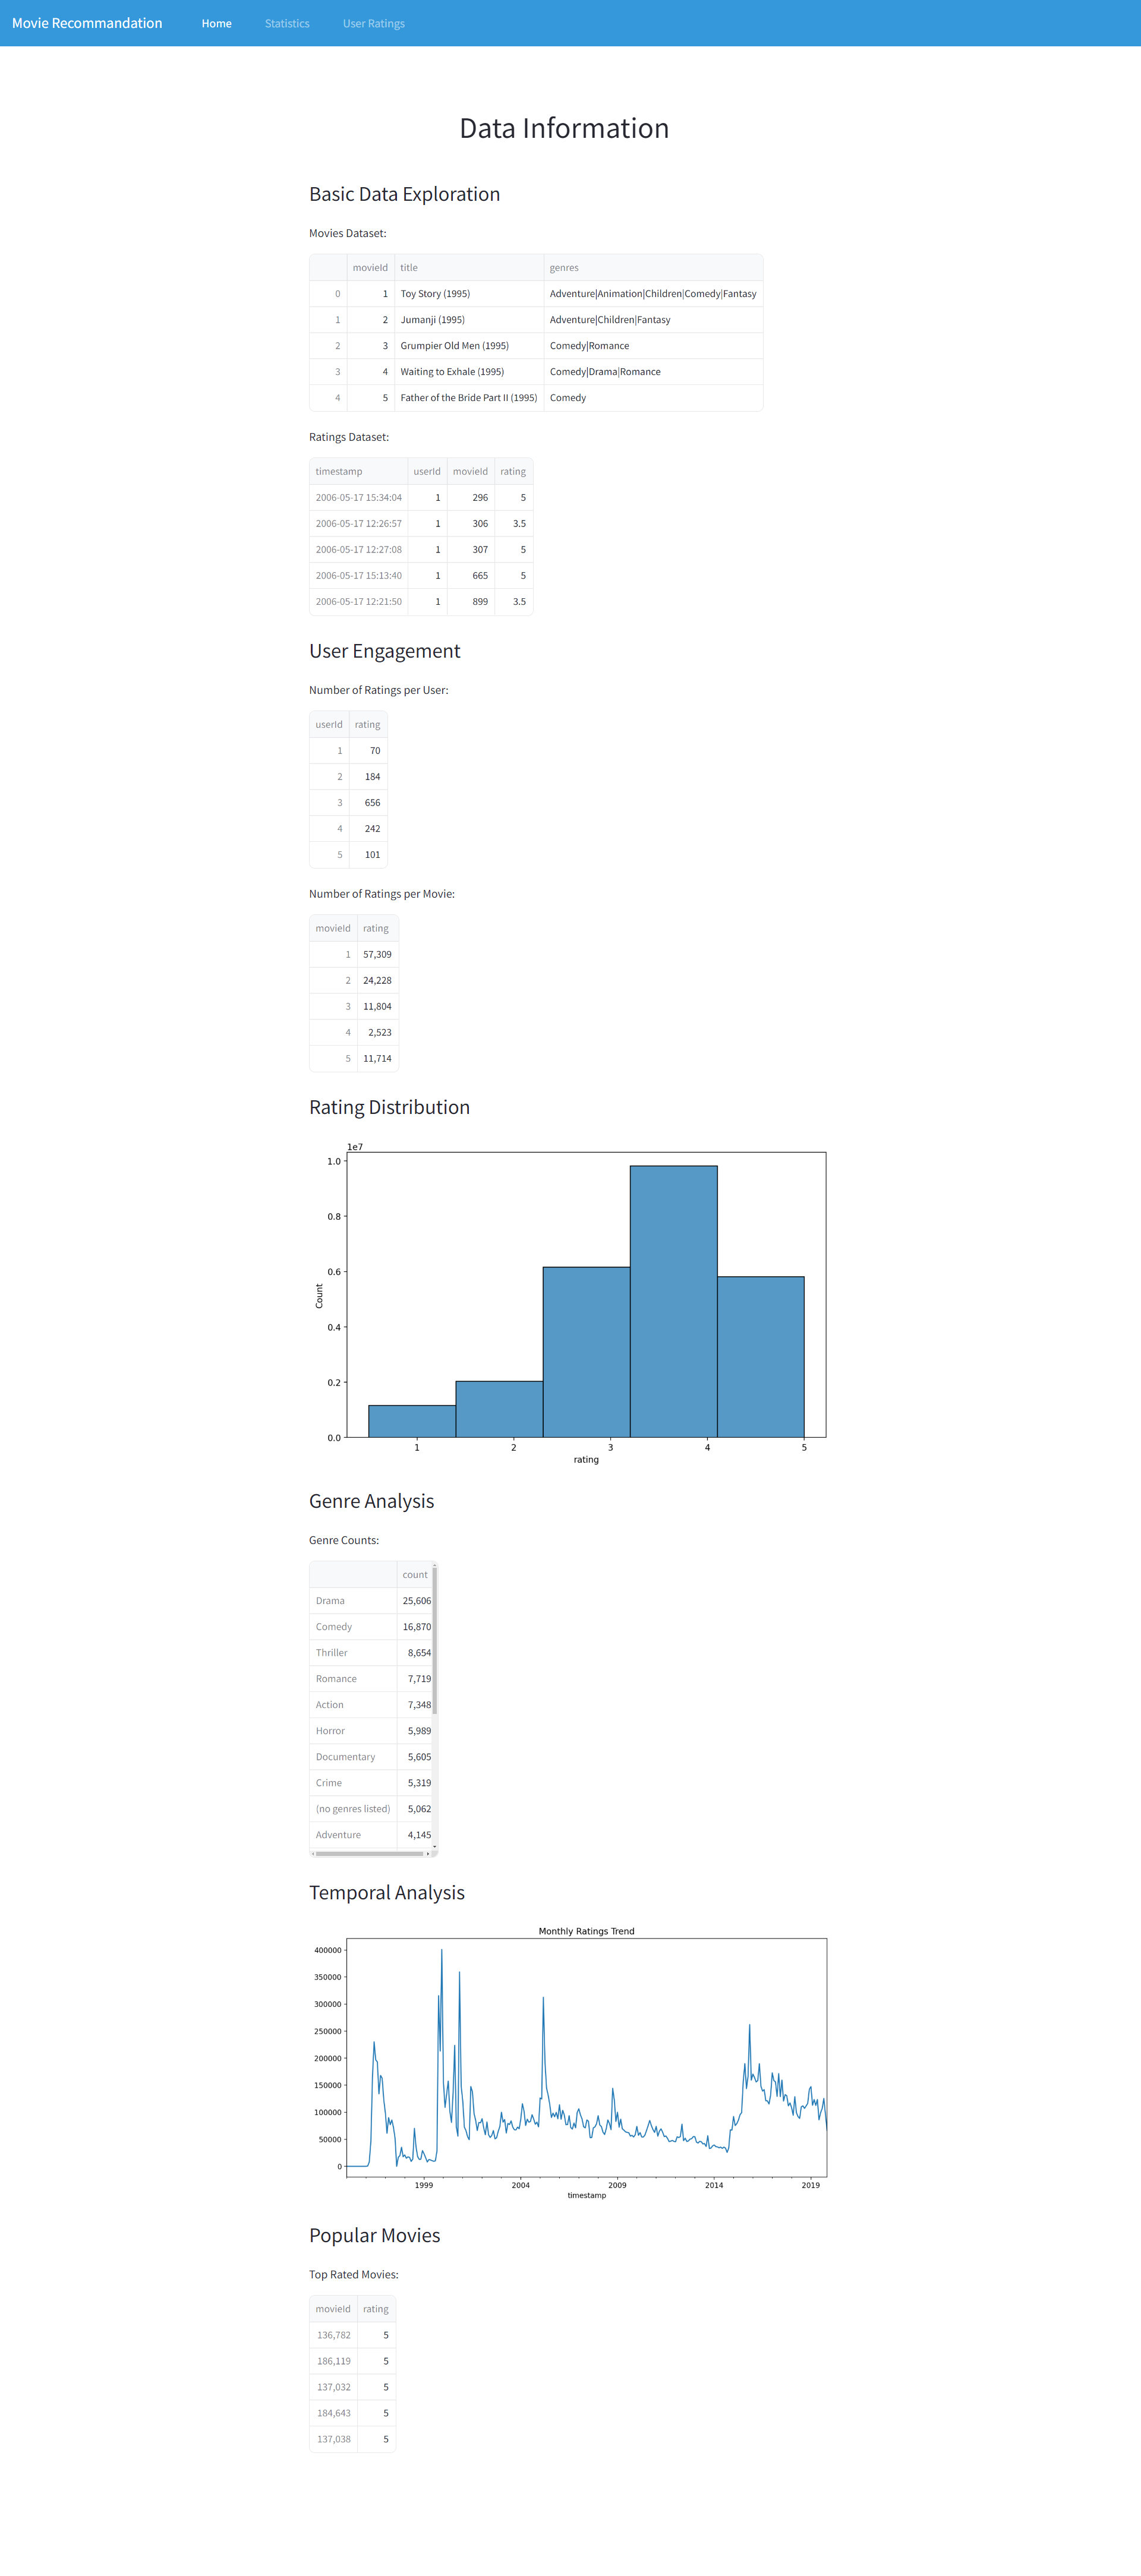
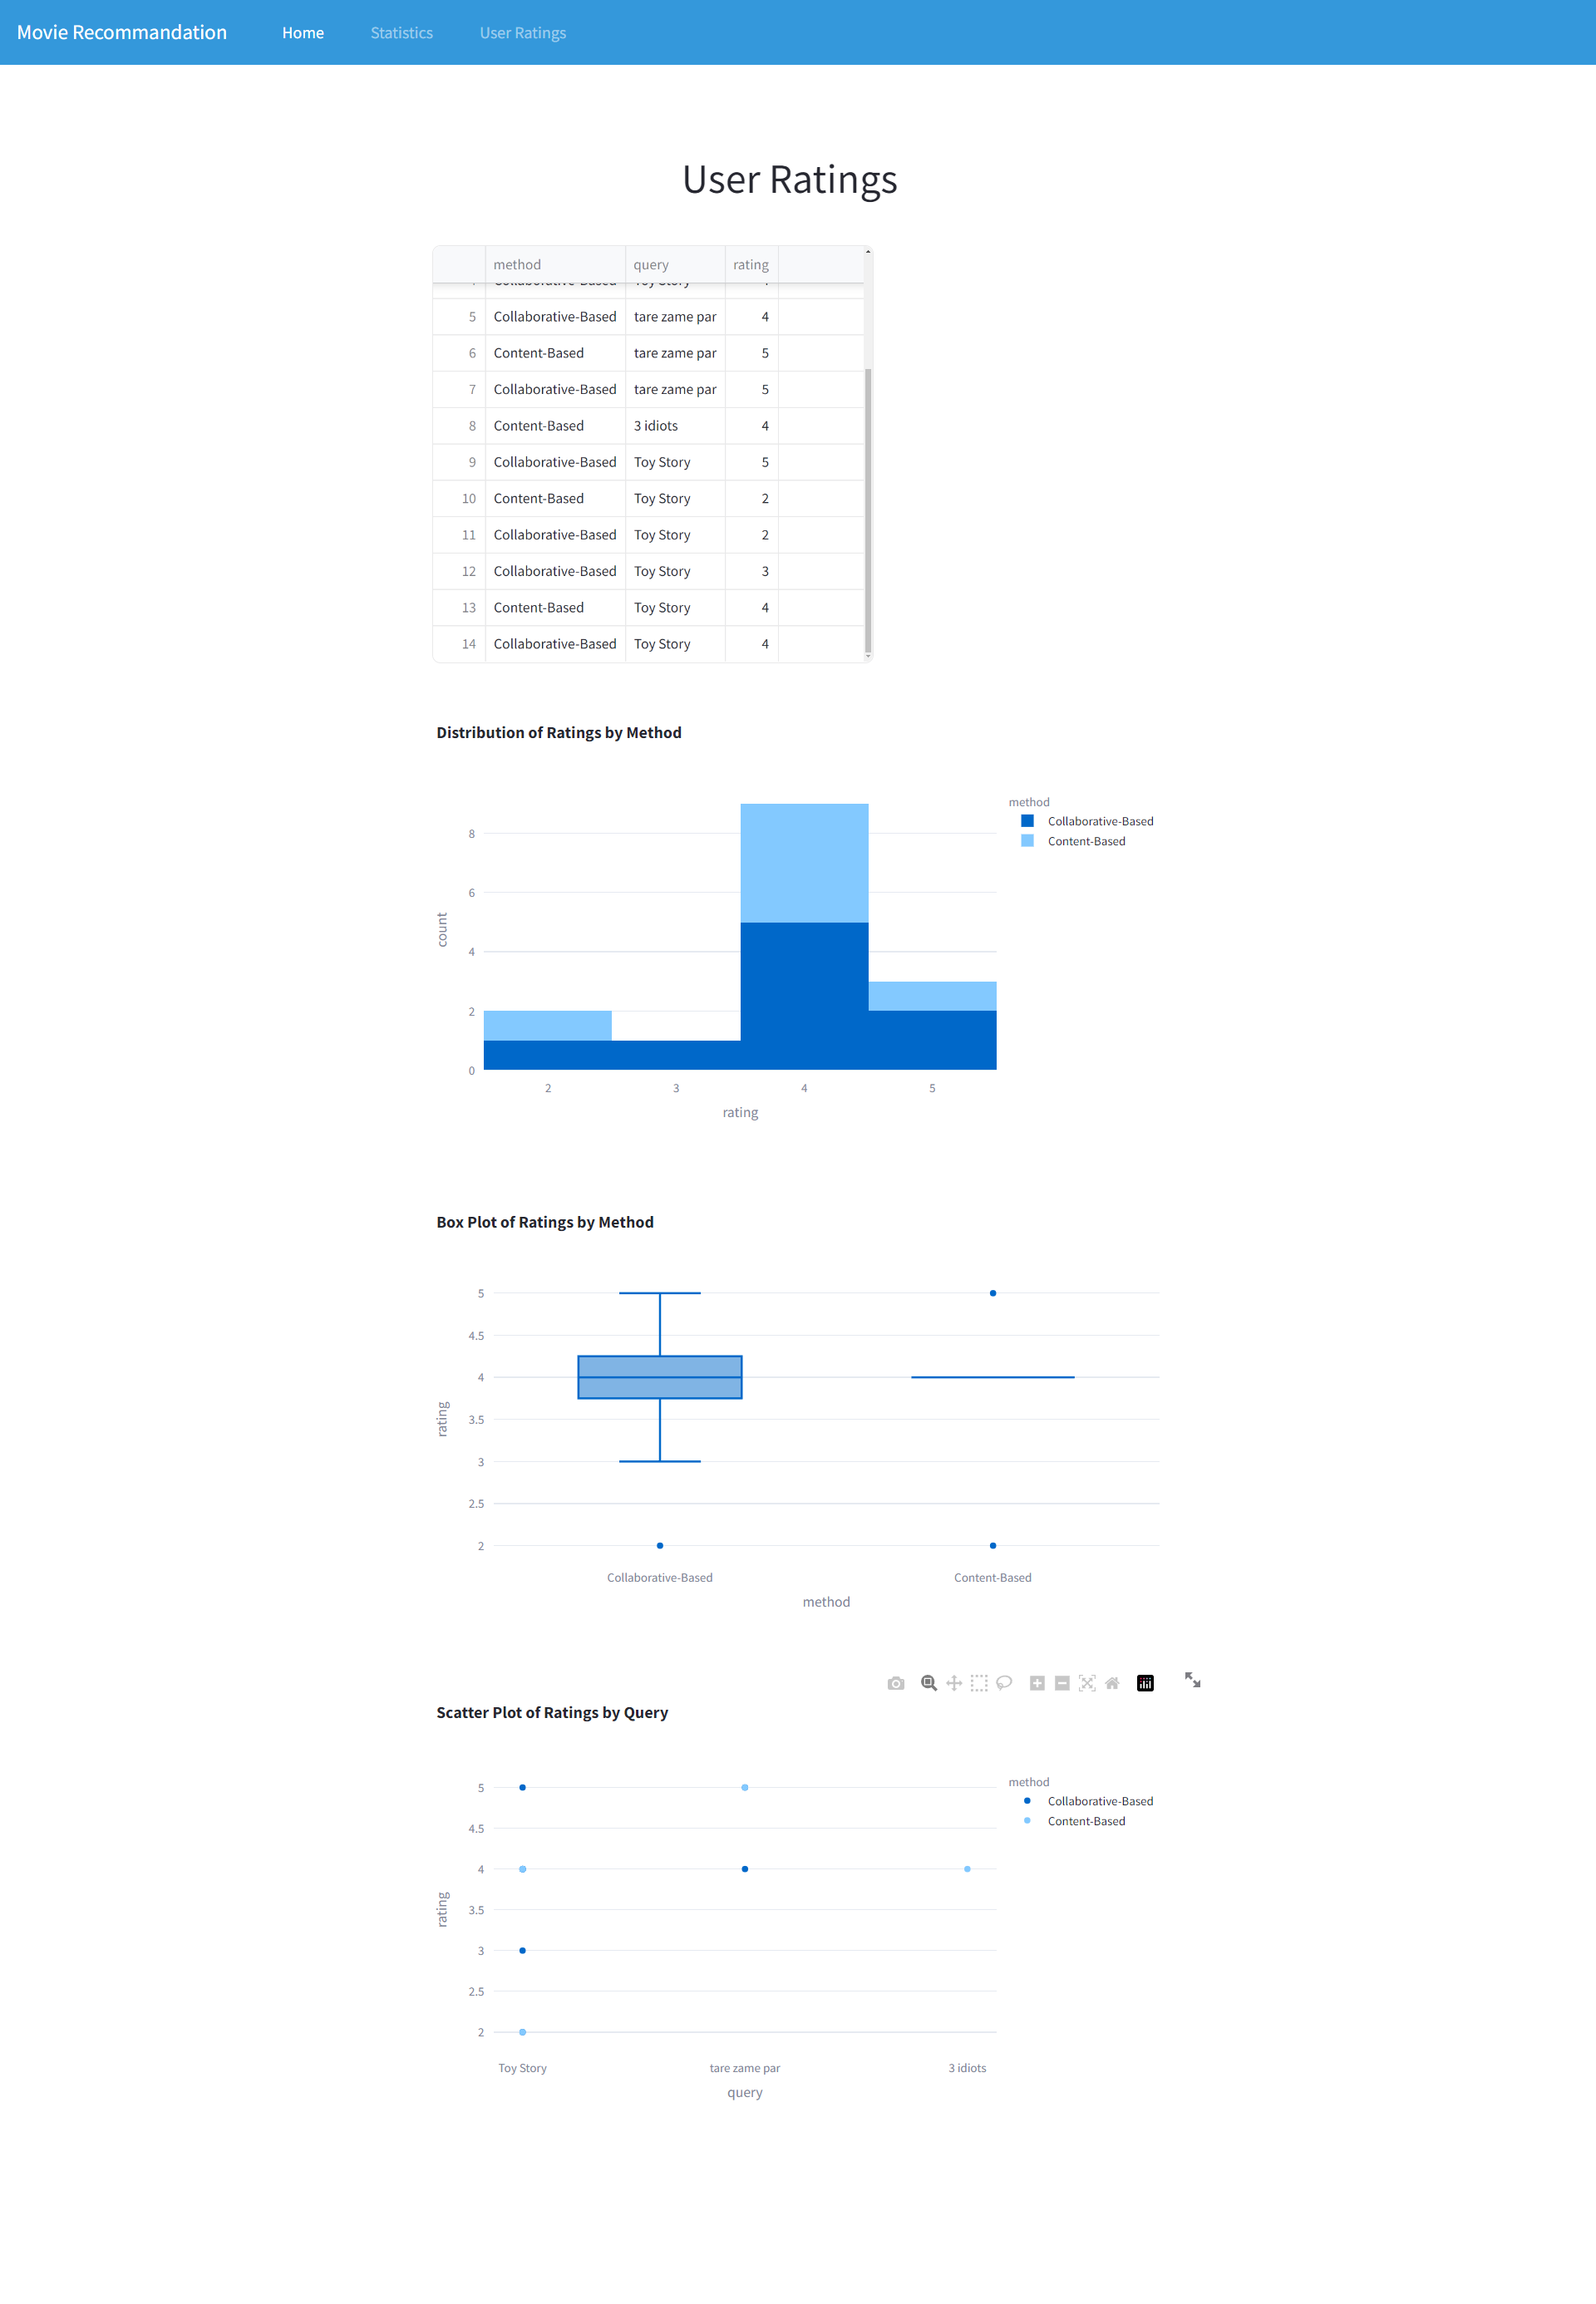
This Power BI dashboard aims to provide comprehensive insights into the effectiveness of different movie recommendation systems: Content-Based and Collaborative Filtering. It contains various visualizations that allow users to understand the performance, user ratings, and other key metrics related to the recommendation systems.
-
Recommendation Systems KPIs: This section of the dashboard highlights specific details about the recommendation systems, including the type of recommendation (Content-Based or Collaborative Filtering), accuracy, precision, recall, and F1-score.
-
User Rating and Feedback: Provides quick insights into user ratings and feedback for the recommendations given by both systems, helping to understand user satisfaction.
-
Recommendation Distribution (Donut Chart): Offers a distribution of recommended movies by genre for both Content-Based and Collaborative Filtering systems, providing a visual comparison of their coverage.
-
Accuracy Over Time (Line Chart): Shows changes in the accuracy of both recommendation systems over time, giving an overview of their performance trends from a defined period.
-
Top Recommended Movies (Bar Chart): A bar chart comparing the ratings of movies recommended by both systems, illustrating their effectiveness in suggesting top-rated movies.
- How It Works: Uses metadata such as genre, director, actors, and plot keywords to recommend movies similar to what the user likes.
- Strengths: Effective in providing recommendations based on specific user preferences and known likes.
- Weaknesses: Limited by the content information available and may not introduce users to new genres or directors.
- How It Works: Uses user behavior and preferences (such as ratings and watch history) to recommend movies that similar users have liked.
- Strengths: Can introduce users to new content outside their usual preferences by leveraging the preferences of similar users.
- Weaknesses: Requires a large amount of user interaction data and may struggle with new or less popular movies (cold start problem).
To access and interact with this Power BI dashboard, you need:
-
Download Power BI Desktop: You can download the latest version from the official Power BI website.
-
Download the Report File: Download the report file from this repository and open it in Power BI Desktop.
-
Explore and Analyze: Feel free to explore the charts, filter data based on your requirements, and gain valuable insights from this dashboard.
The dataset used in this project can be found on Kaggle, with specific data pertaining to movie details, user ratings, and recommendation metrics.


