Project : An online platform for comparing scientific methods for analyzing neural time series analysis methods.
In this Google Summer of Code 2021 project, we continued the development of CompEngine: Time-Series Features, an online platform that helps users to explore the collection of over 7700 time-series analysis methods implemented in the hctsa library and compare their new time-series analysis methods with the existing methods in the hctsa library.
Existing time-series analysis methods in the hctsa package have been developed in various disciplines, and it's ambiguous how standard analysis methods in one field are related to those used in another field. To unify interdisciplinary literature on time-series analysis so that users can pick the best methods for their data, we first need to enable users to understand how different methods relate to each other.
In this project, we developed an interactive portal to visualize and understand how a library of > 7700 methods are related to each other in a user-friendly and interactive way across three visualizations. The portal also takes a new time-series analysis algorithm (as Python or Julia code) from the user and computes its outputs across a dataset of 1000 diverse time series. It then analyzes the Spearman correlation between the output of the user's algorithm with the hctsa feature library and presents a range of intuitive output visualizations that show the best-matching features. This output allows any new method to be automatically benchmarked against interdisciplinary literature and helps the user to understand connections between their algorithm and the existing interdisciplinary time-series analysis algorithms, and further assess whether their algorithm is contributing something new and exciting to a multidisciplinary library of analysis methods, or it behaves similarly to one or more existing methods.
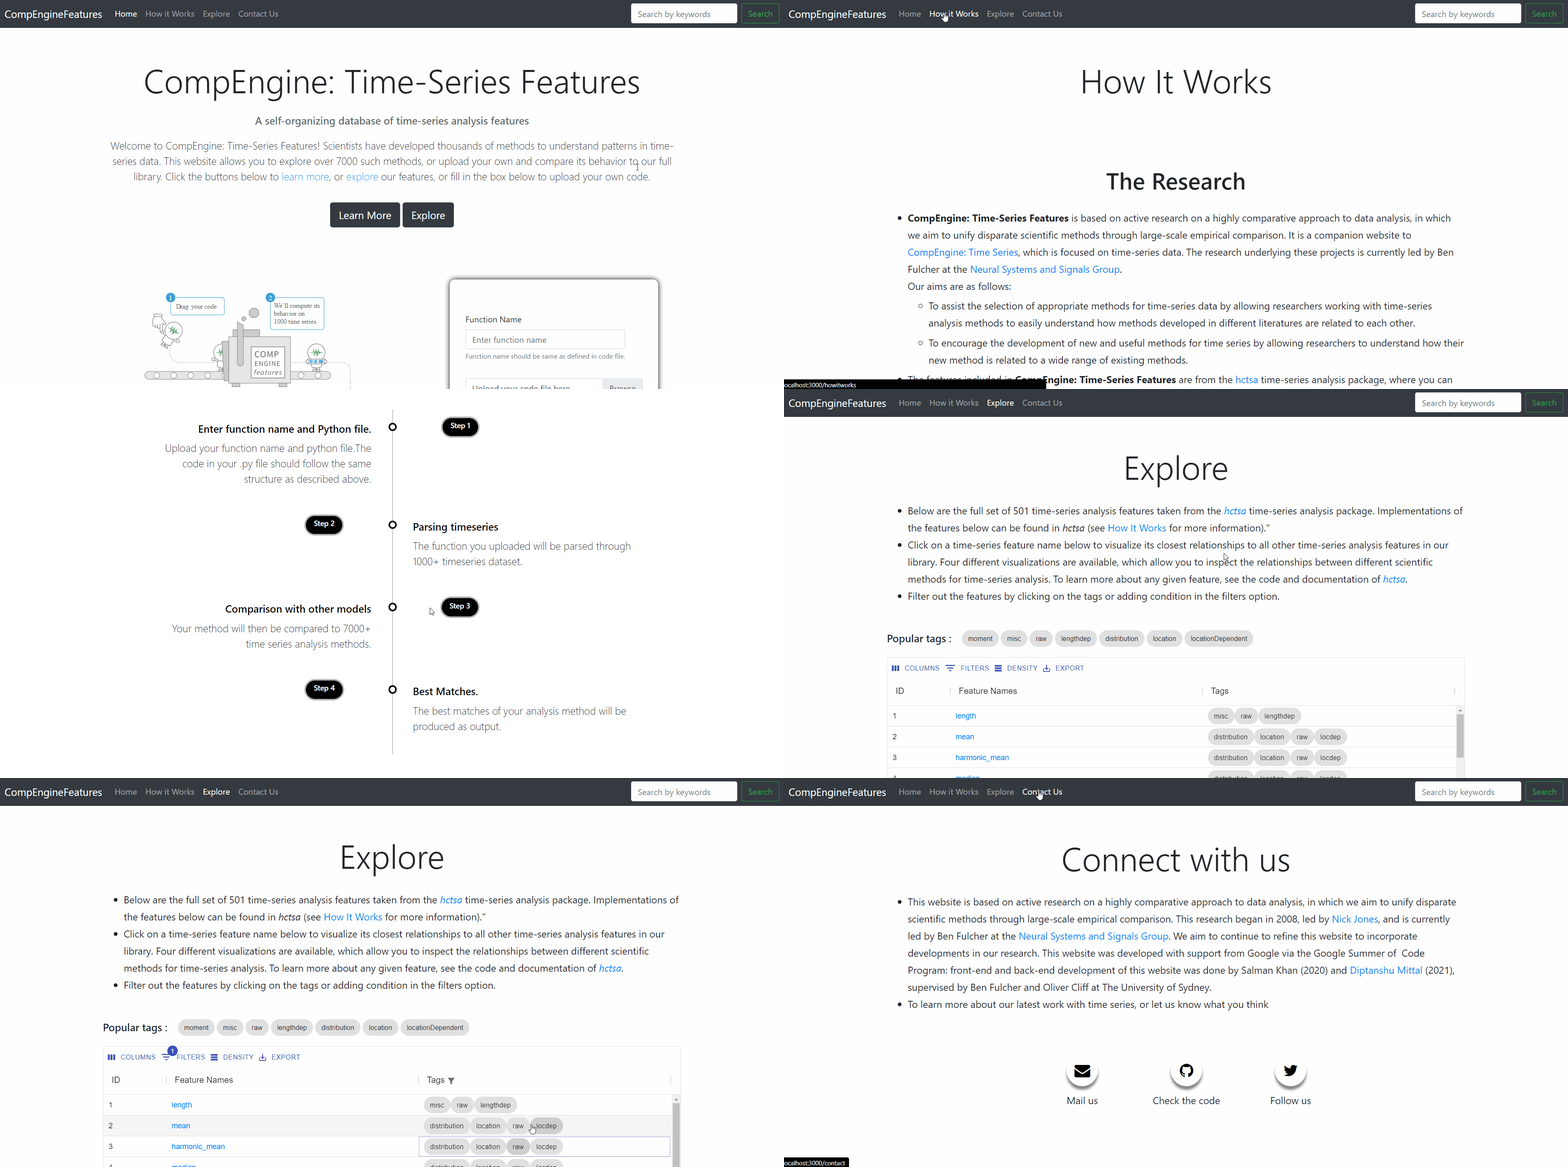
Here are a few examples of the platform functionality I developed in this GSoC project:
The development process of the project can be broken down into three phases:
-
Upgrading to API-first architecture
In this phase, we worked on upgrading the platform architecture and introduced a range of changes, like:- Developed frontend as a SPA from scratch using React and several components - 'Home', ' How-it-works', 'Contact', 'Preloader', 'Result', 'Syntax error', 'Timeout Error', '404 Not found', 'Navigation Bar', 'Explore' etc.
- Connected frontend to the backend server using APIs.
- Created new views in backend to return JsonResponse for API calls.
- Created NoSQL database for storing precomputed correlation and p-values for various features in hctsa package, along with empirical 1000 time-series and their categories.
- Developed Redux store in the React to cache the explored hctsa features, time-series and network plots.
- Added the search functionality in the navigation bar.
-
Improving the output visualizations
In this phase, we focused on improving the output visualizations, that will help the user to understand connections between the feature being explored and other hctsa features. A range of output visualizations were developed from scratch in React app, including:-
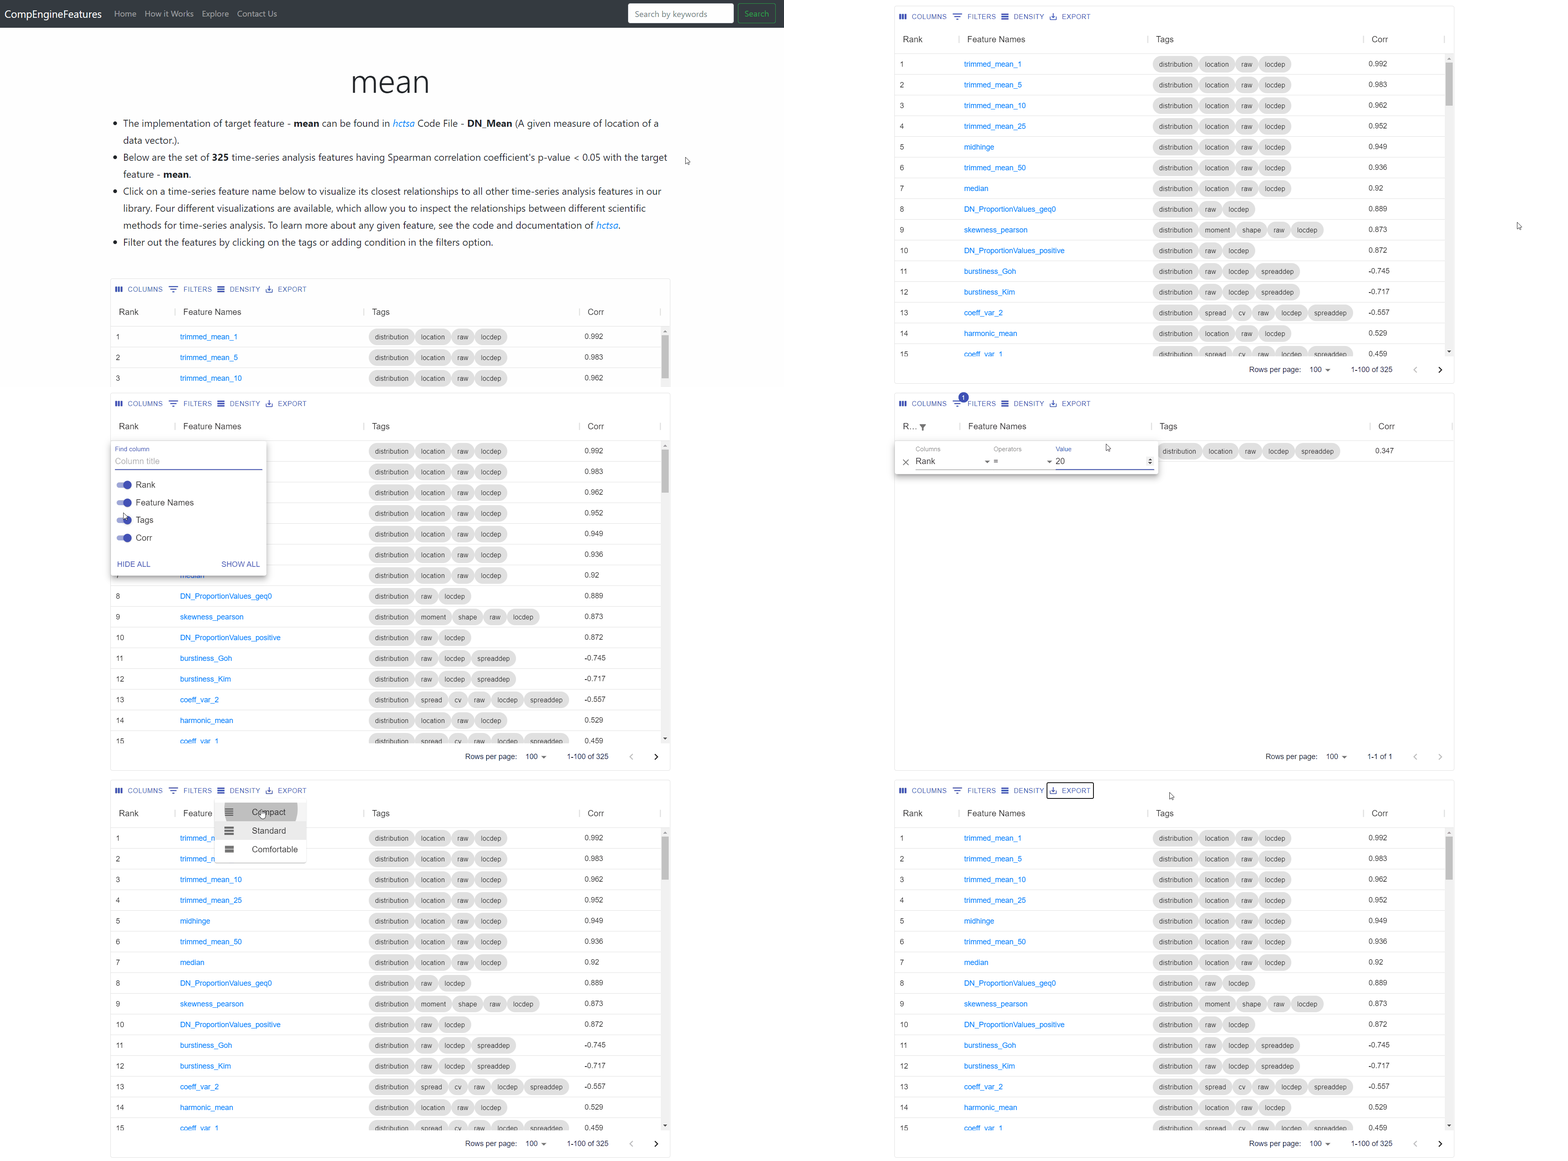
Interactive results table (functionality shown in the gif below), that allows users to:
-
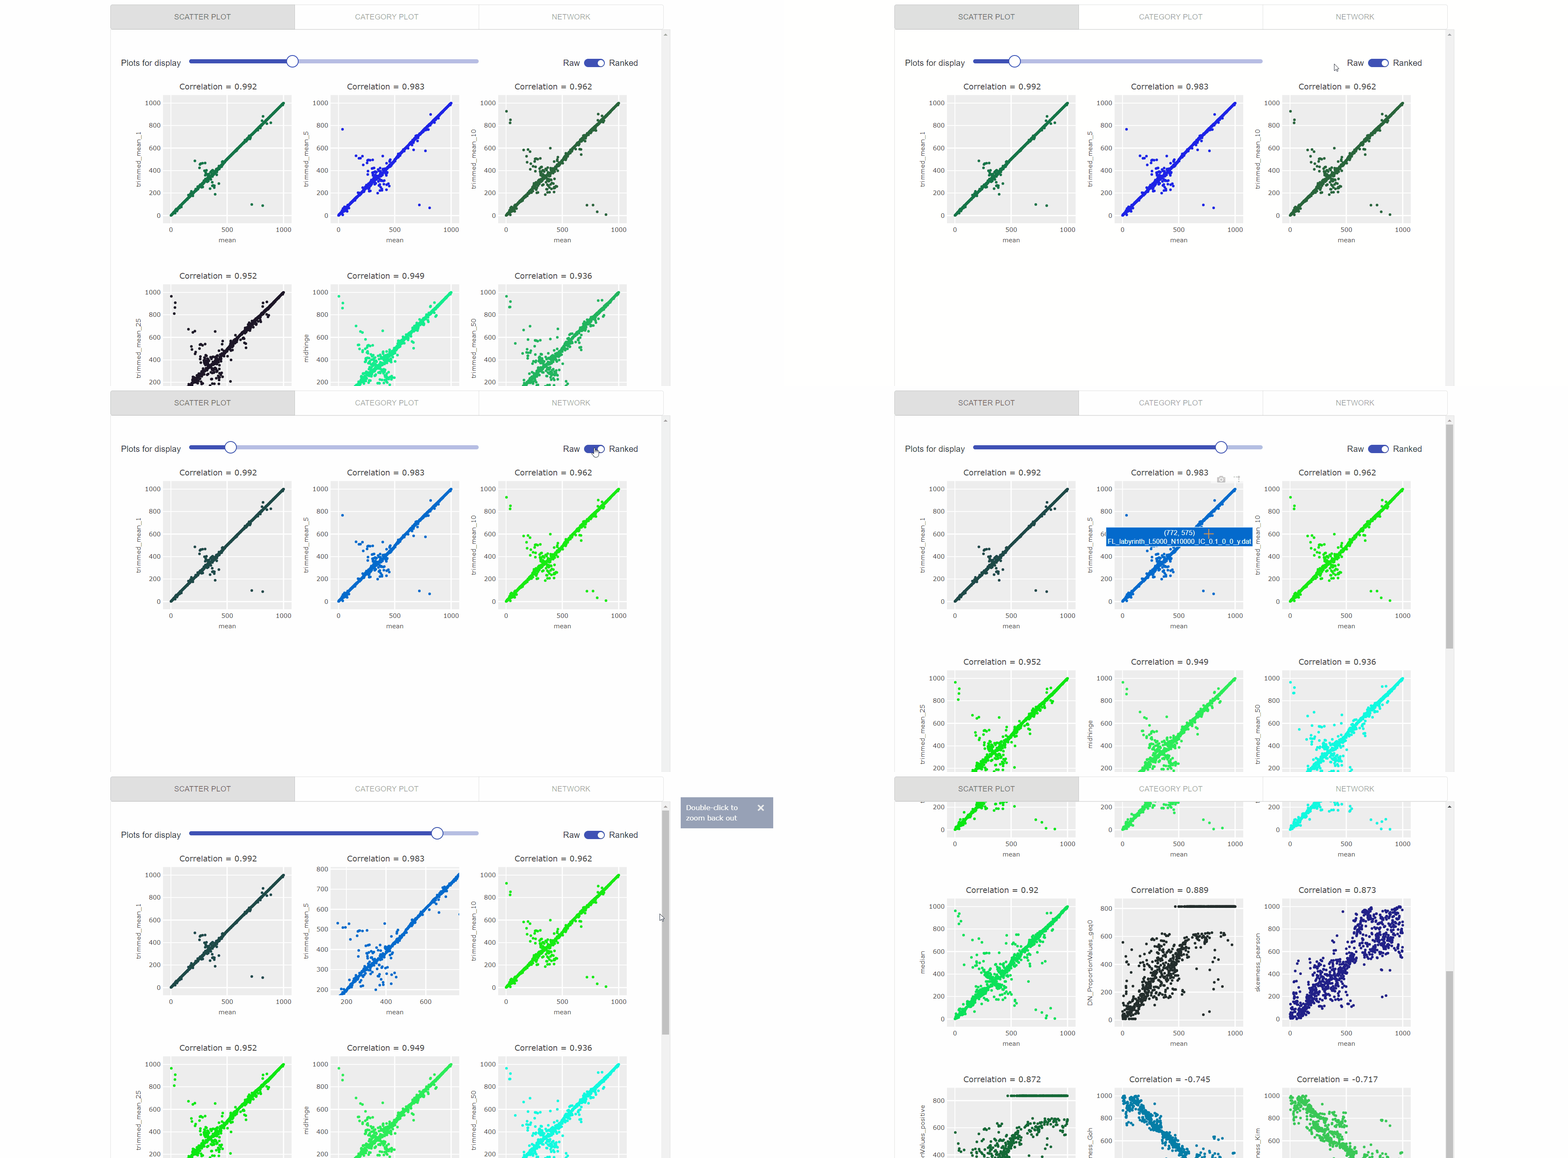
Visualization of top feature results as interactive scatter plots (as visualized in the gif below), which enables users to:
-
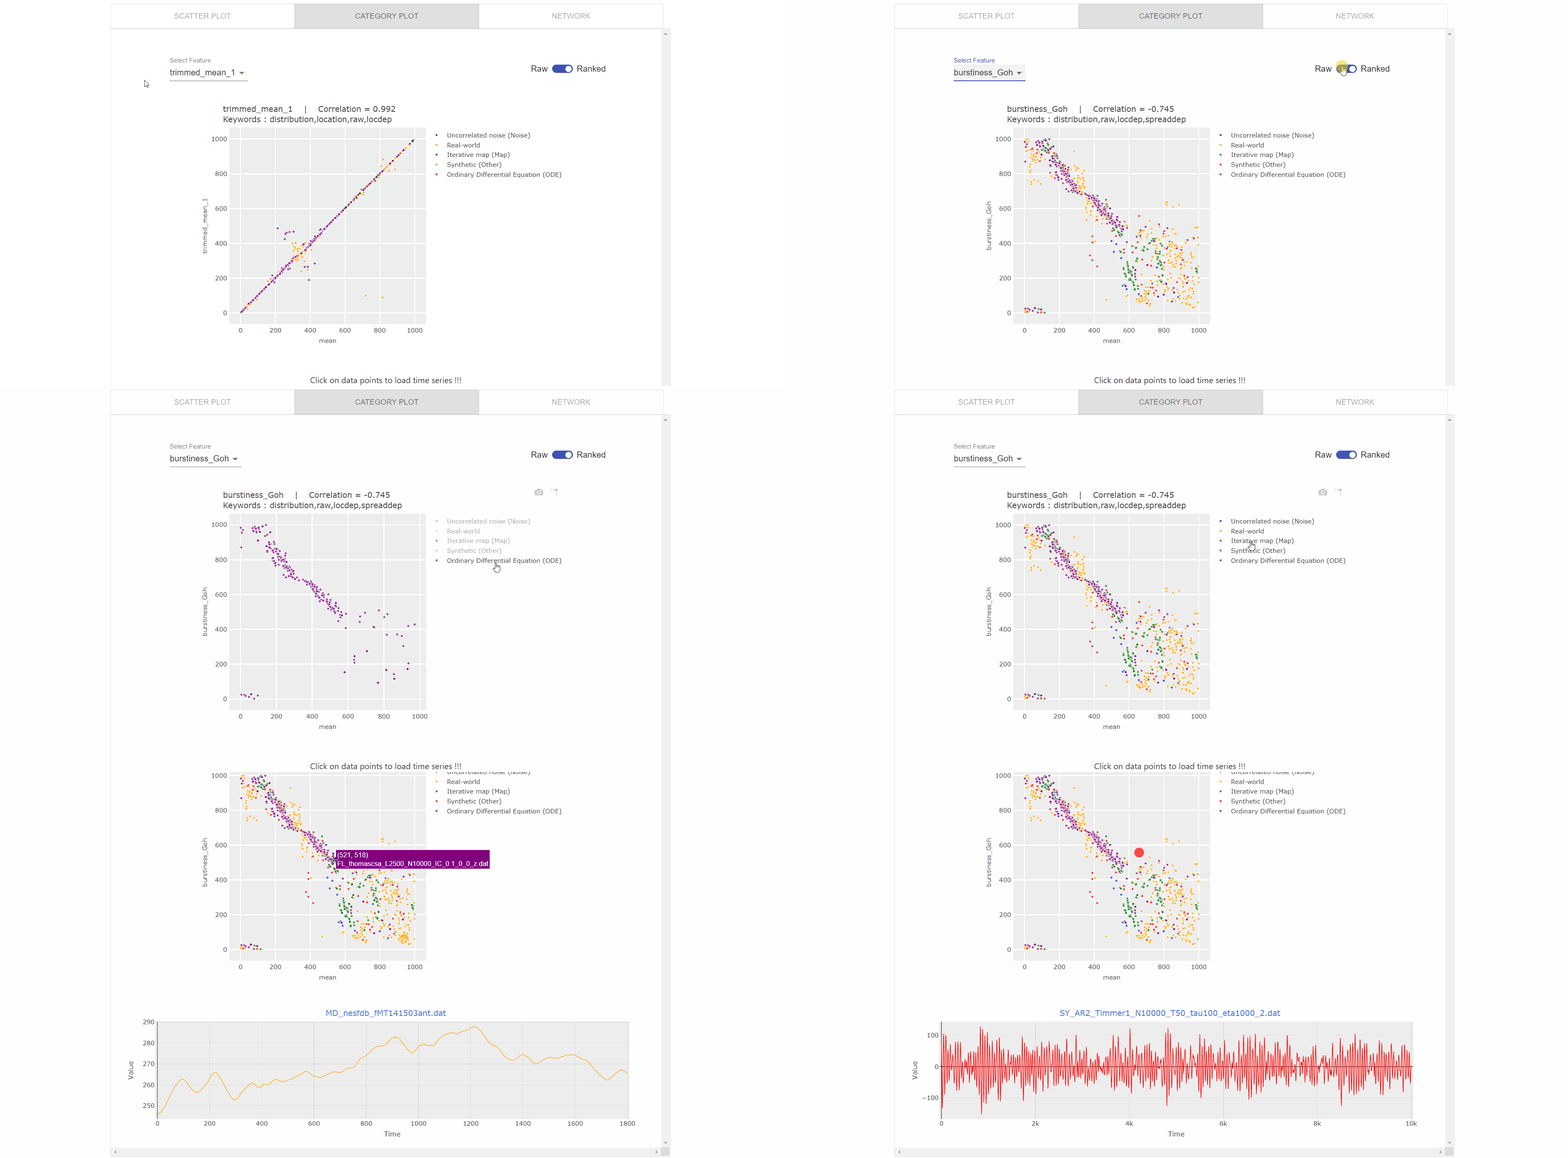
Visualization for comparing two features using category plots (as visualized in the gif below), which enables users to:
-
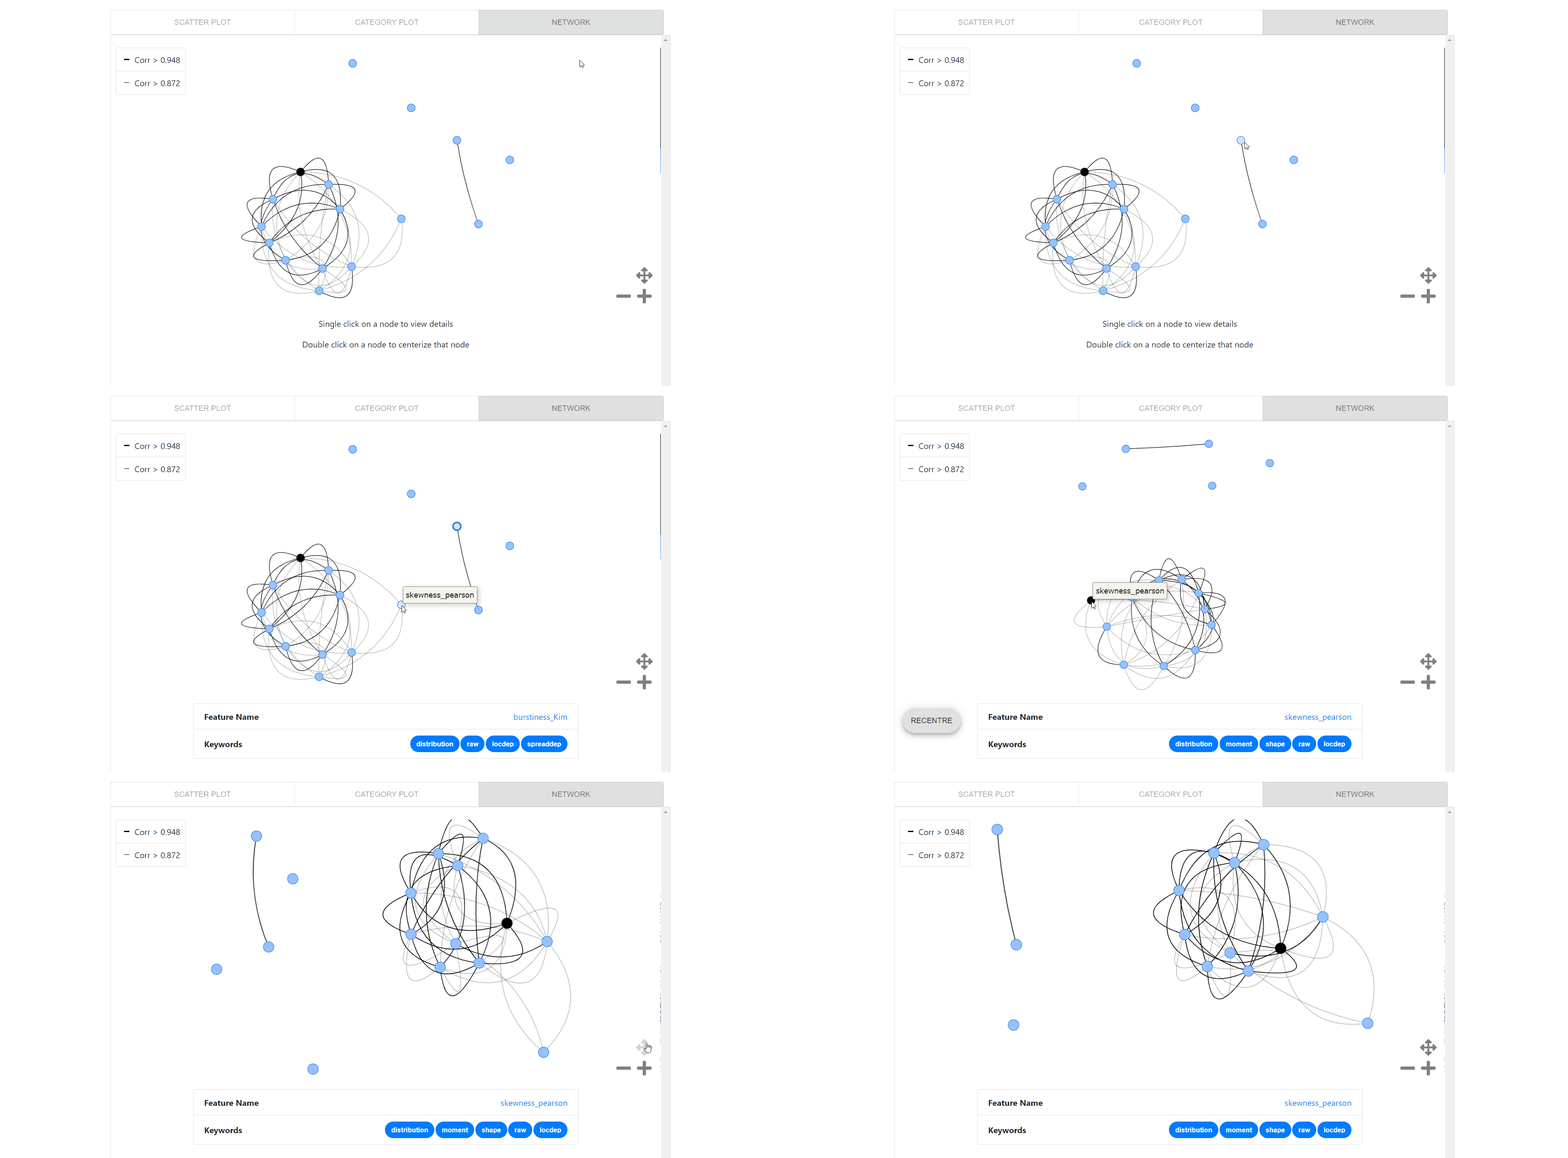
Network visualization for pairwise relationships between each of the top 15 features matching the center feature( black node), which enables users to:
- Click on the node to get feature name and keywords.
- Double-click on a feature to centralize that feature.
- Hover over nodes to get feature name and over edges to get the correlation.
- Recenter button to go back to center feature at the start.
- Legends to get pairwise relationship in a glance.
- Toggle buttons to control the network plots canvas.
-
-
Adding docker to improve security and deploying the system on a server.
This phase was one of the most challenging one. In this phase, we:- Integrated docker with the Django backend and shifted code computation to docker containers.
- Added support for Python and Julia code computation.
- Deployed the complete system on the Sydney University server.
All the requirements outlined in the GSoC proposal have been completed. After the official GSoC period, I plan to contribute to this further development by:
- Creating a contribution section using which users can contribute their time-series analysis features.
- Creating a python package using which users can get the raw data and visualize in their own way.
- I plan to publish a paper describing the functionality of our platform and its importance for enabling progress in interdisciplinary literatures like scientific time-series analysis.
