 UI for Apache Kafka
Versatile, fast and lightweight web UI for managing Apache Kafka® clusters. Built by developers, for developers.
DISCLAIMER
UI for Apache Kafka is a free tool built and supported by the open-source community. Curated by Provectus, it will remain free and open-source, without any paid features or subscription plans to be added in the future. Looking for the help of Kafka experts? Provectus can help you design, build, deploy, and manage Apache Kafka clusters and streaming applications. Discover Professional Services for Apache Kafka, to unlock the full potential of Kafka in your enterprise!
UI for Apache Kafka is a free, open-source web UI to monitor and manage Apache Kafka clusters.
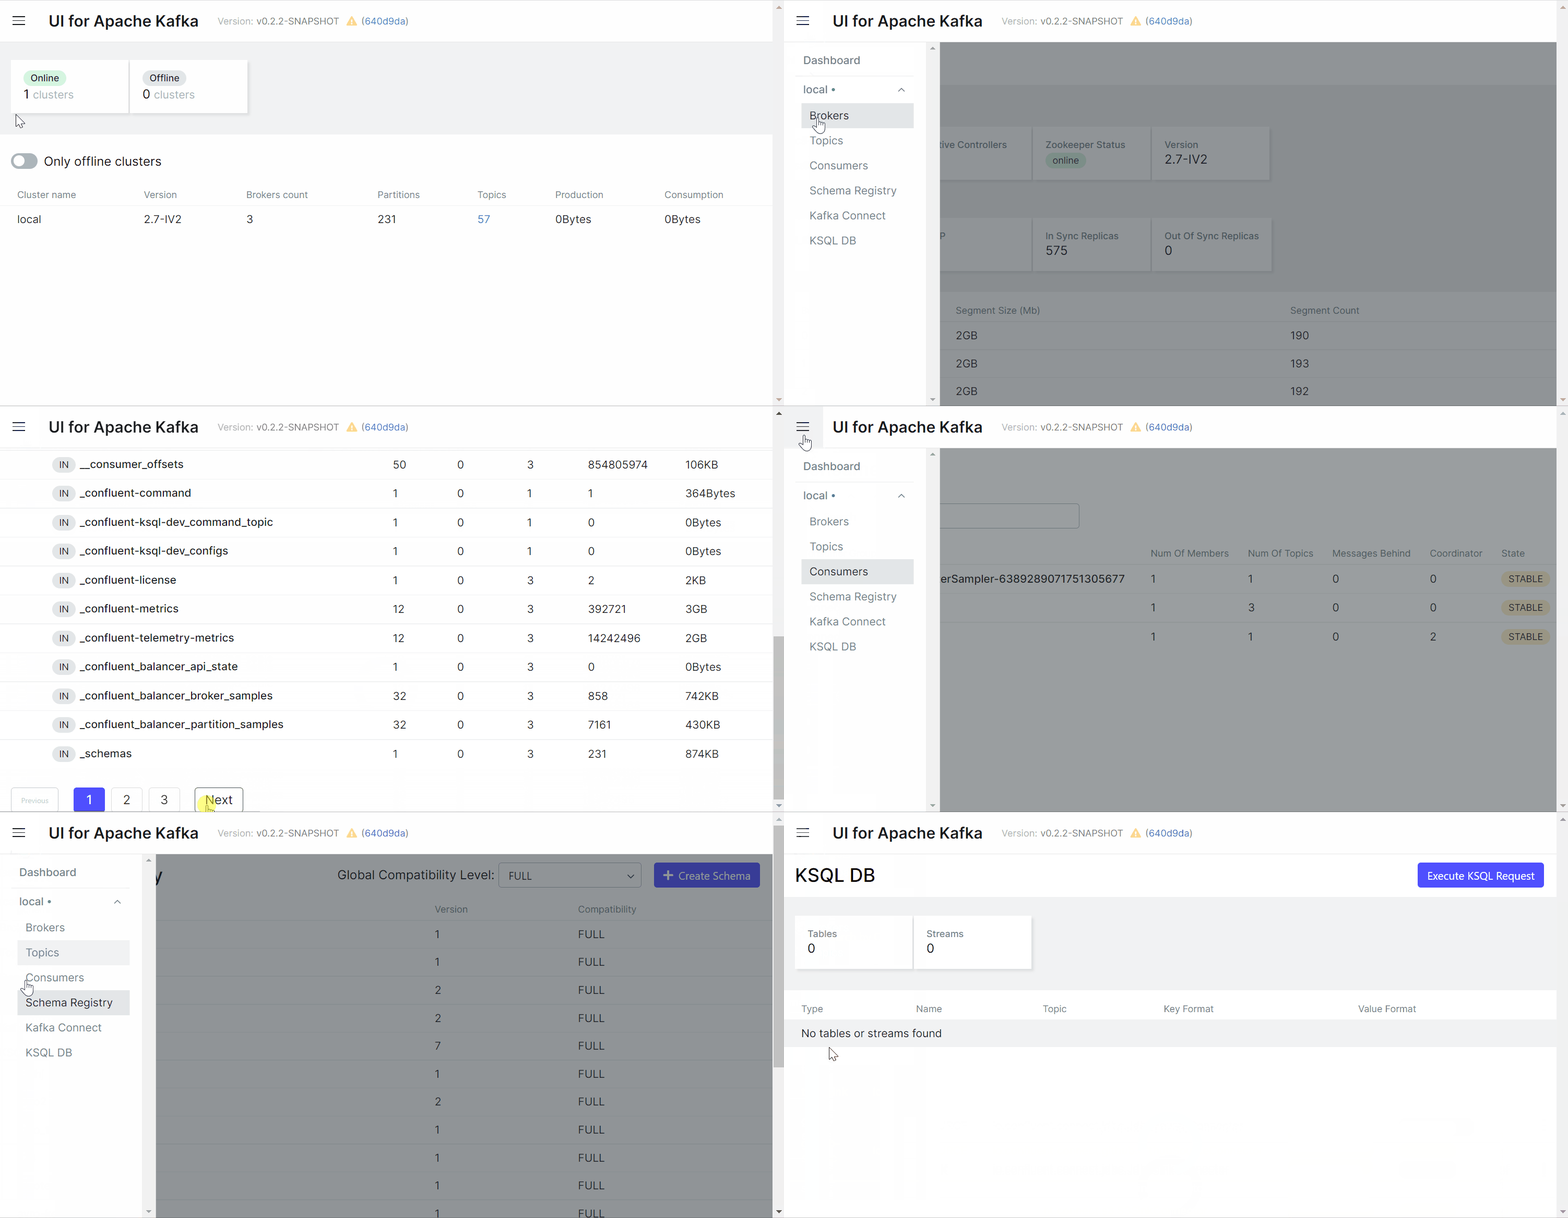
UI for Apache Kafka is a simple tool that makes your data flows observable, helps find and troubleshoot issues faster and deliver optimal performance. Its lightweight dashboard makes it easy to track key metrics of your Kafka clusters - Brokers, Topics, Partitions, Production, and Consumption.
Set up UI for Apache Kafka with just a couple of easy commands to visualize your Kafka data in a comprehensible way. You can run the tool locally or in the cloud.
Features
- Multi-Cluster Management — monitor and manage all your clusters in one place
- Performance Monitoring with Metrics Dashboard — track key Kafka metrics with a lightweight dashboard
- View Kafka Brokers — view topic and partition assignments, controller status
- View Kafka Topics — view partition count, replication status, and custom configuration
- View Consumer Groups — view per-partition parked offsets, combined and per-partition lag
- Browse Messages — browse messages with JSON, plain text, and Avro encoding
- Dynamic Topic Configuration — create and configure new topics with dynamic configuration
- Configurable Authentification — secure your installation with optional Github/Gitlab/Google OAuth 2.0
The Interface
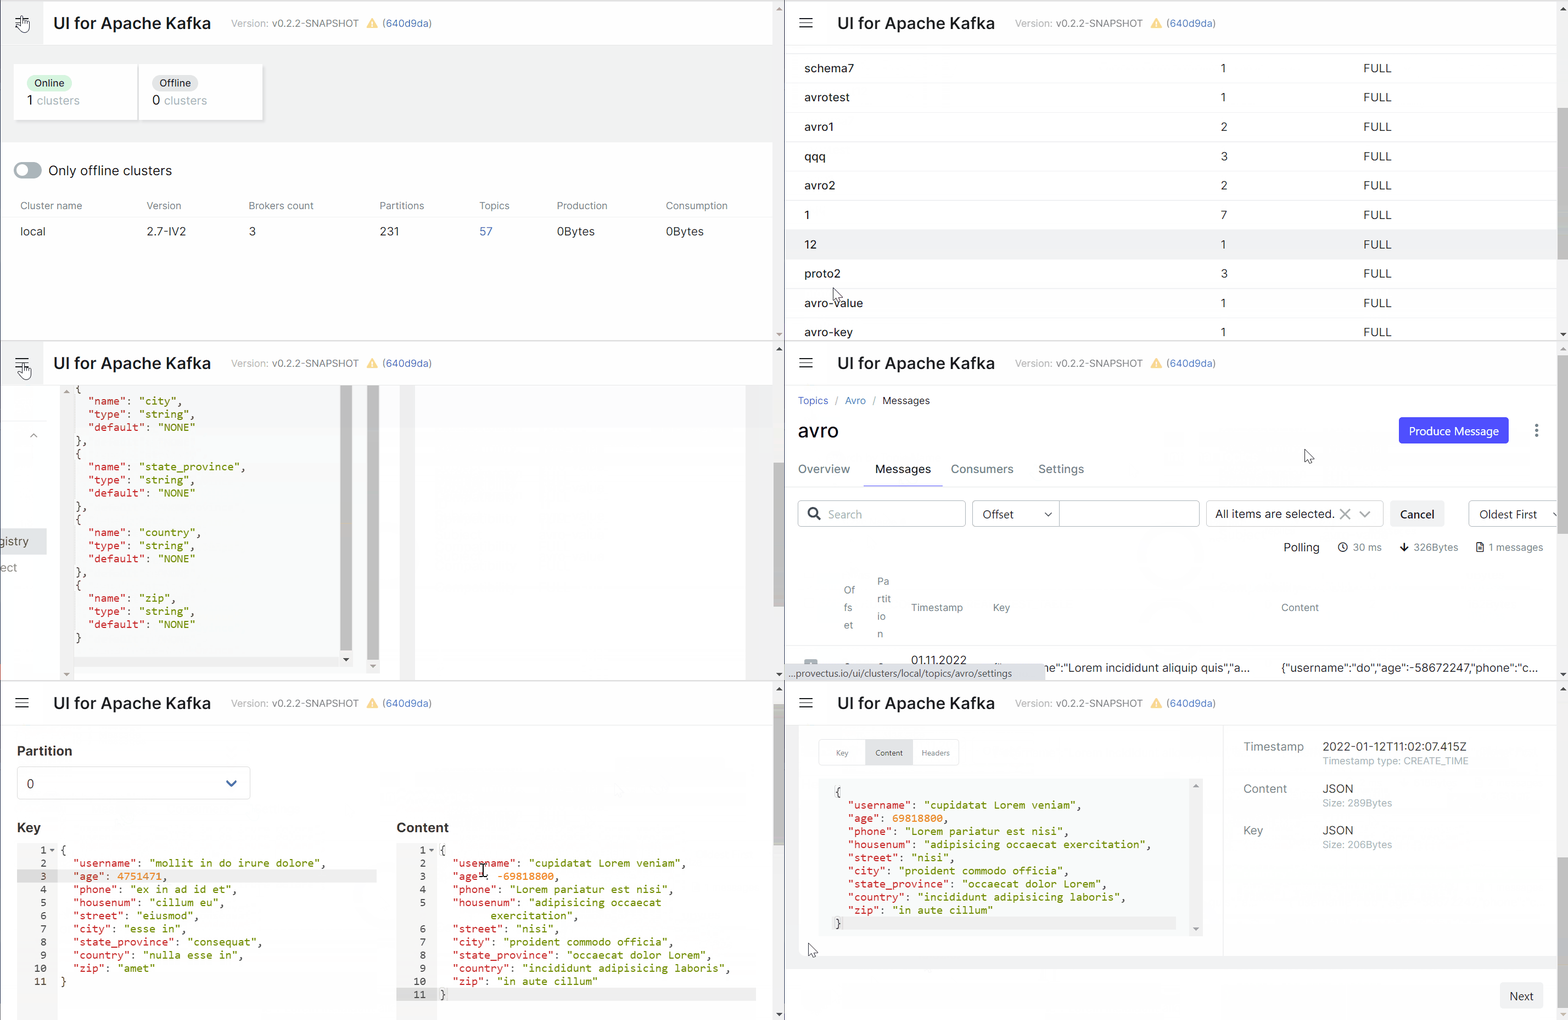
UI for Apache Kafka wraps major functions of Apache Kafka with an intuitive user interface.
Topics
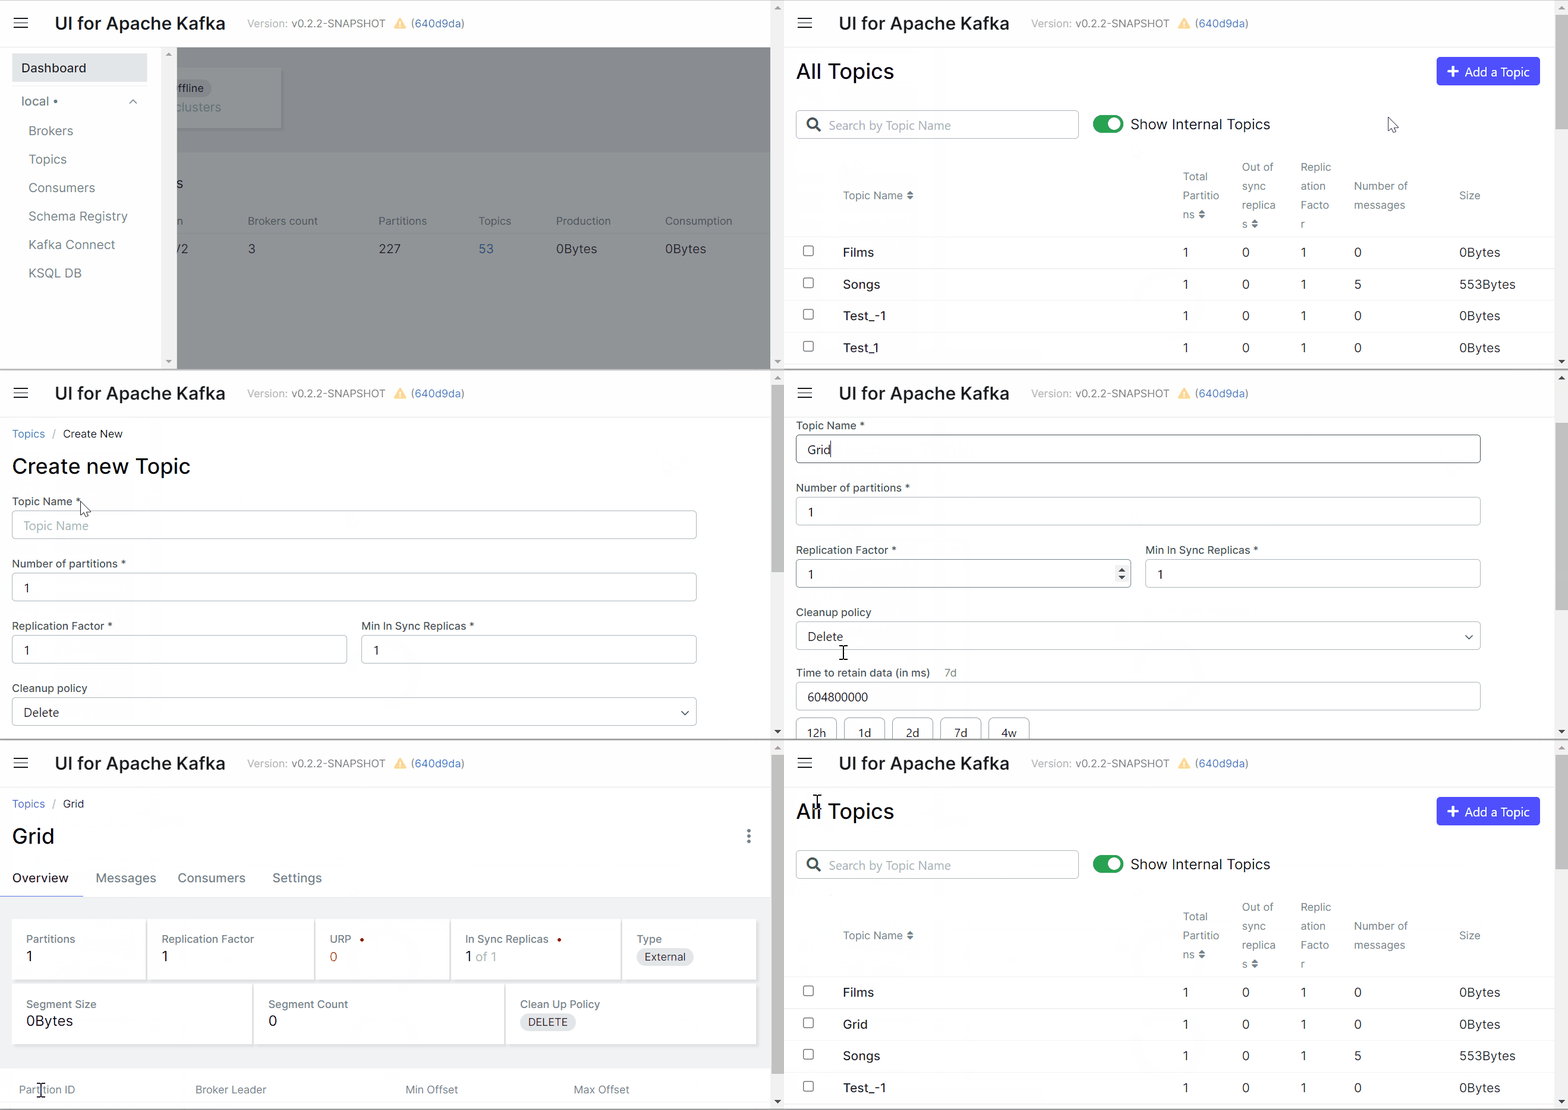
UI for Apache Kafka makes it easy for you to create topics in your browser by several clicks, pasting your own parameters, and viewing topics in the list.
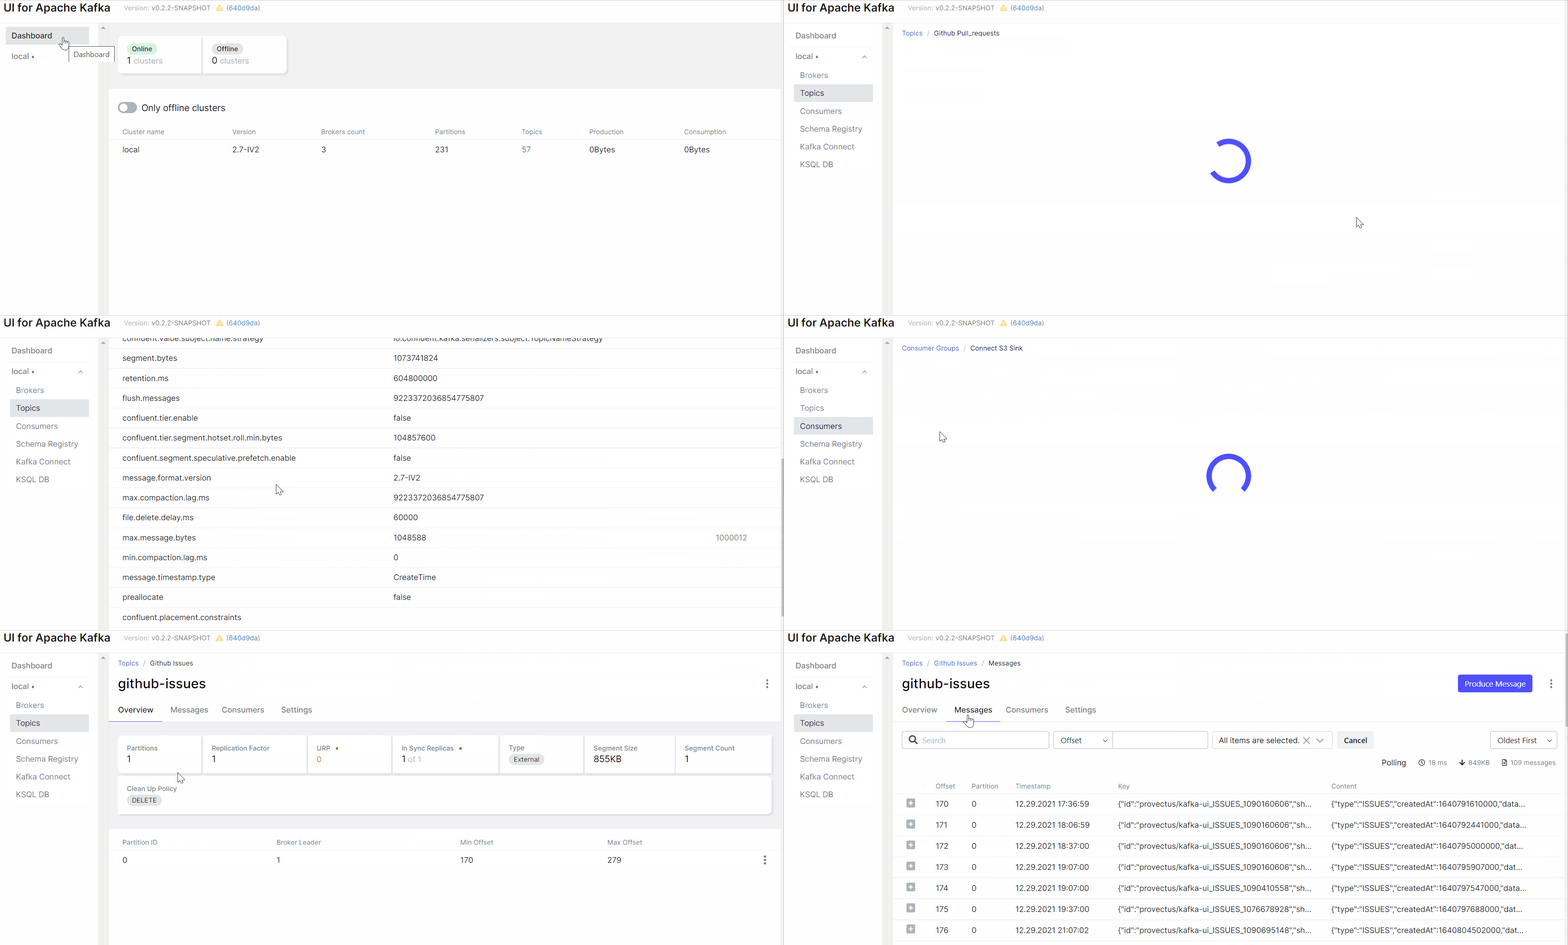
It's possible to jump from connectors view to corresponding topics and from a topic to consumers (back and forth) for more convenient navigation. connectors, overview topic settings.
Messages
Let's say we want to produce messages for our topic. With the UI for Apache Kafka we can send or write data/messages to the Kafka topics without effort by specifying parameters, and viewing messages in the list.
Schema registry
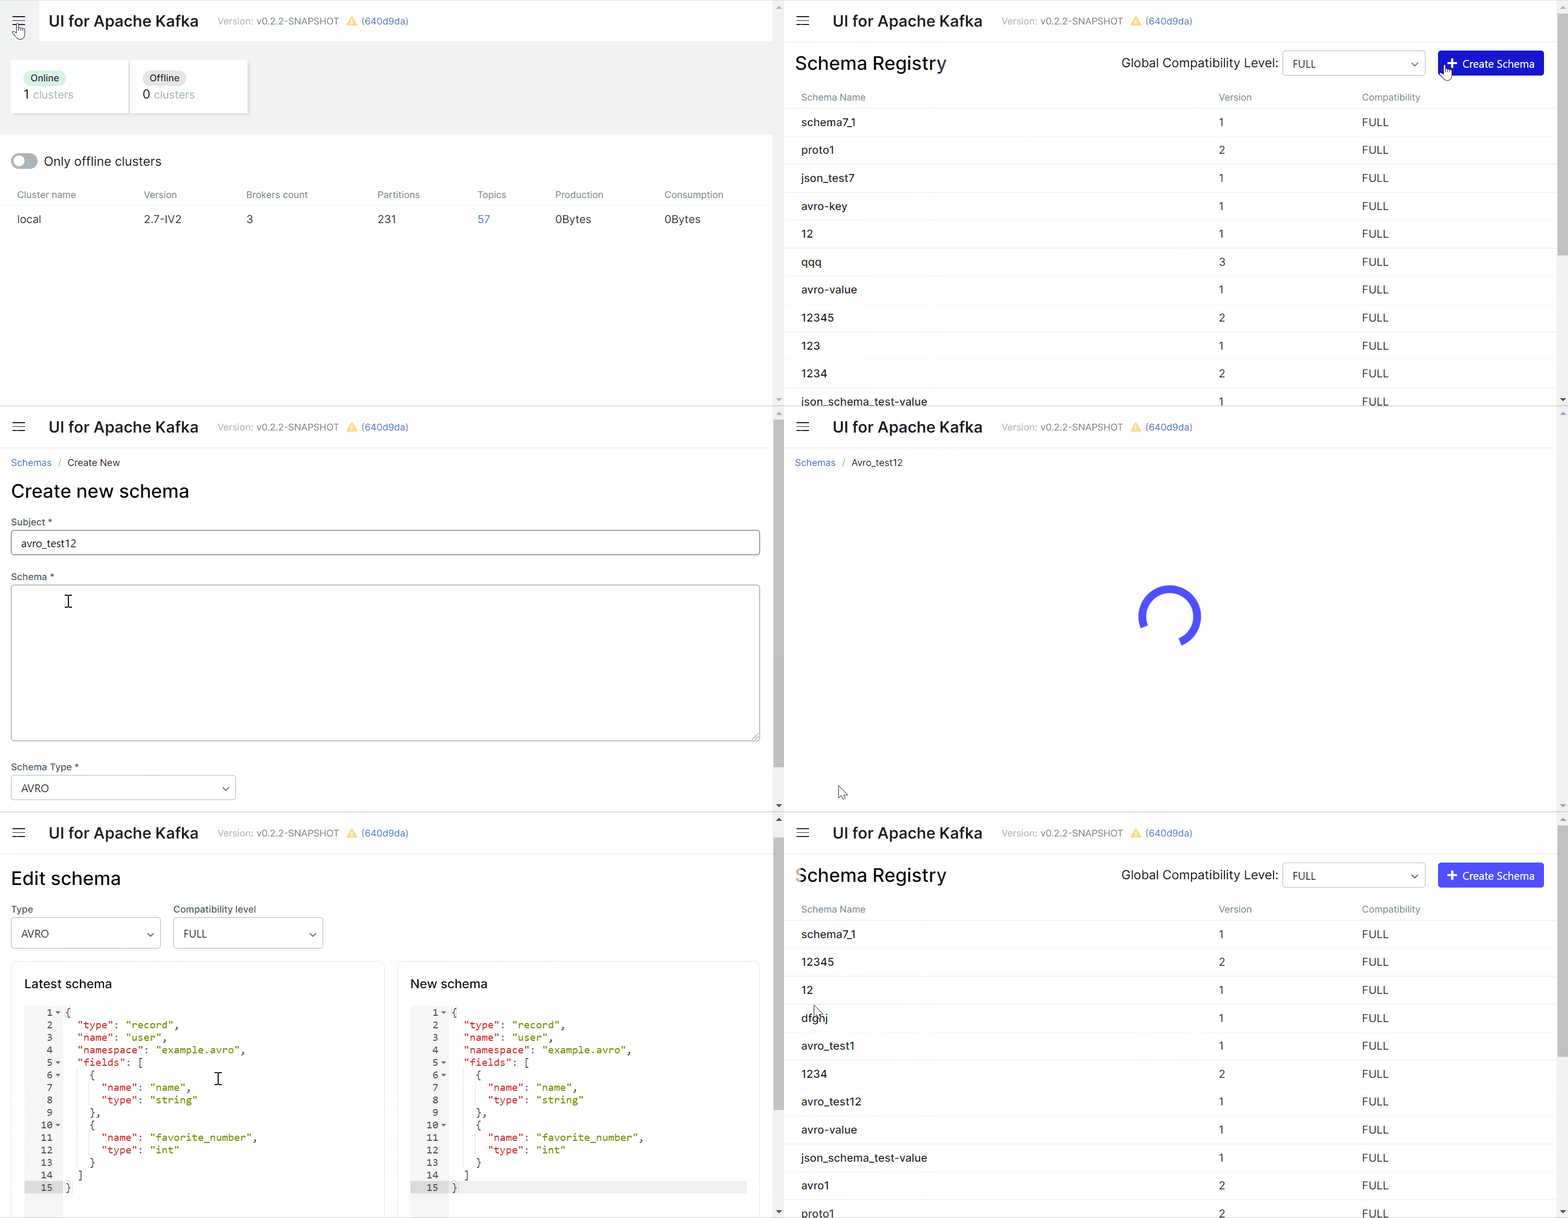
There are 3 supported types of schemas: Avro®, JSON Schema, and Protobuf schemas.
Before producing avro-encoded messages, you have to add an avro schema for the topic in Schema Registry. Now all these steps are easy to do with a few clicks in a user-friendly interface.
Getting Started
To run UI for Apache Kafka, you can use a pre-built Docker image or build it locally.
Configuration
We have plenty of docker-compose files as examples. They're built for various configuration stacks.
Guides
Configuration File
Example of how to configure clusters in the application-local.yml configuration file:
kafka:
  clusters:
    -
      name: local
      bootstrapServers: localhost:29091
      schemaRegistry: http://localhost:8085
      schemaRegistryAuth:
        username: username
        password: password
#     schemaNameTemplate: "%s-value"
      metrics:
        port: 9997
        type: JMX
-name: cluster namebootstrapServers: where to connectschemaRegistry: schemaRegistry's addressschemaRegistryAuth.username: schemaRegistry's basic authentication usernameschemaRegistryAuth.password: schemaRegistry's basic authentication passwordschemaNameTemplate: how keys are saved to schemaRegistrymetrics.port: open JMX port of a brokermetrics.type: Type of metrics, either JMX or PROMETHEUS. Defaulted to JMX.readOnly: enable read only mode
Configure as many clusters as you need by adding their configs below separated with -.
Running a Docker Image
The official Docker image for UI for Apache Kafka is hosted here: hub.docker.com/r/provectuslabs/kafka-ui.
Launch Docker container in the background:
docker run -p 8080:8080 \
	-e KAFKA_CLUSTERS_0_NAME=local \
	-e KAFKA_CLUSTERS_0_BOOTSTRAPSERVERS=kafka:9092 \
	-d provectuslabs/kafka-ui:latest
Then access the web UI at http://localhost:8080. Further configuration with environment variables - see environment variables
Docker Compose
If you prefer to use docker-compose please refer to the documentation.
Helm chart
Helm chart could be found under charts/kafka-ui directory
Quick-start instruction here
Building With Docker
Prerequisites
Check prerequisites.md
Building and Running
Check building.md
Building Without Docker
Prerequisites
Prerequisites will mostly remain the same with the exception of docker.
Running without Building
How to run quickly without building
Building and Running
Liveliness and readiness probes
Liveliness and readiness endpoint is at /actuator/health.
Info endpoint (build info) is located at /actuator/info.
Environment Variables
Alternatively, each variable of the .yml file can be set with an environment variable.
For example, if you want to use an environment variable to set the name parameter, you can write it like this: KAFKA_CLUSTERS_2_NAME
| Name | Description |
|---|---|
SERVER_SERVLET_CONTEXT_PATH |
URI basePath |
LOGGING_LEVEL_ROOT |
Setting log level (trace, debug, info, warn, error). Default: info |
LOGGING_LEVEL_COM_PROVECTUS |
Setting log level (trace, debug, info, warn, error). Default: debug |
SERVER_PORT |
Port for the embedded server. Default: 8080 |
KAFKA_ADMIN-CLIENT-TIMEOUT |
Kafka API timeout in ms. Default: 30000 |
KAFKA_CLUSTERS_0_NAME |
Cluster name |
KAFKA_CLUSTERS_0_BOOTSTRAPSERVERS |
Address where to connect |
KAFKA_CLUSTERS_0_KSQLDBSERVER |
KSQL DB server address |
KAFKA_CLUSTERS_0_KSQLDBSERVERAUTH_USERNAME |
KSQL DB server's basic authentication username |
KAFKA_CLUSTERS_0_KSQLDBSERVERAUTH_PASSWORD |
KSQL DB server's basic authentication password |
KAFKA_CLUSTERS_0_PROPERTIES_SECURITY_PROTOCOL |
Security protocol to connect to the brokers. For SSL connection use "SSL", for plaintext connection don't set this environment variable |
KAFKA_CLUSTERS_0_SCHEMAREGISTRY |
SchemaRegistry's address |
KAFKA_CLUSTERS_0_SCHEMAREGISTRYAUTH_USERNAME |
SchemaRegistry's basic authentication username |
KAFKA_CLUSTERS_0_SCHEMAREGISTRYAUTH_PASSWORD |
SchemaRegistry's basic authentication password |
KAFKA_CLUSTERS_0_SCHEMANAMETEMPLATE |
How keys are saved to schemaRegistry |
KAFKA_CLUSTERS_0_METRICS_PORT |
Open metrics port of a broker |
KAFKA_CLUSTERS_0_METRICS_TYPE |
Type of metrics retriever to use. Valid values are JMX (default) or PROMETHEUS. If Prometheus, then metrics are read from prometheus-jmx-exporter instead of jmx |
KAFKA_CLUSTERS_0_READONLY |
Enable read-only mode. Default: false |
KAFKA_CLUSTERS_0_DISABLELOGDIRSCOLLECTION |
Disable collecting segments information. It should be true for confluent cloud. Default: false |
KAFKA_CLUSTERS_0_KAFKACONNECT_0_NAME |
Given name for the Kafka Connect cluster |
KAFKA_CLUSTERS_0_KAFKACONNECT_0_ADDRESS |
Address of the Kafka Connect service endpoint |
KAFKA_CLUSTERS_0_KAFKACONNECT_0_USERNAME |
Kafka Connect cluster's basic authentication username |
KAFKA_CLUSTERS_0_KAFKACONNECT_0_PASSWORD |
Kafka Connect cluster's basic authentication password |
KAFKA_CLUSTERS_0_METRICS_SSL |
Enable SSL for Metrics? true or false. For advanced setup, see kafka-ui-jmx-secured.yml |
KAFKA_CLUSTERS_0_METRICS_USERNAME |
Username for Metrics authentication |
KAFKA_CLUSTERS_0_METRICS_PASSWORD |
Password for Metrics authentication |
TOPIC_RECREATE_DELAY_SECONDS |
Time delay between topic deletion and topic creation attempts for topic recreate functionality. Default: 1 |
TOPIC_RECREATE_MAXRETRIES |
Number of attempts of topic creation after topic deletion for topic recreate functionality. Default: 15 |


