A Prometheus exporter for monitoring Compal CH7465LG cable modems. These are sold under the name "Connect Box" by Unitymedia in Germany, Ziggo in the Netherlands and UPC in Switzerland/Austria/Poland. Or as "Virgin Media Super Hub 3" by Virgin Media.
Makes thorough use of compal_CH7465LG_py by @ties (thanks!).
On your Prometheus server host:
- Create a virtual environment using python3.7 or higher
- Install the exporter via
pip install connectbox-prometheus
Alternatively you could use the provided Dockerfile.
We don't provide builds on Docker Hub or similar, so you need to git clone and build it yourself:
git clone https://github.com/mbugert/connectbox-prometheus.git
cd connectbox-prometheus
Choose either docker run or docker-compose.
To build your own local docker image run
docker build -t connectbox-prometheus .
To actually create and run a container named connectbox-prometheus use the following command:
docker run -v connectbox-prometheus-volume:/data -p 9705:9705 --name connectbox-prometheus connectbox-prometheus
The example config.yml found in the root of this repo will be copied to the provided /data volume (e.g. connectbox-prometheus-volume, usually found under /var/lib/docker/volumes/connectbox-prometheus-volume and the container will stop, because you most likely need to modify the given config. See Usage.
After modifying, run docker start connectbox-prometheus to keep the container running.
docker-compose up will automatically build the docker image, start the container the first time to copy the example config.yml and exit again.
Now there should be an directory named data where you can find your config.yml. Modify it to your needs. See Usage.
After modifying, run docker-compose up -d to keep the container running.
This exporter queries exactly one Connect Box as a remote target.
To get started, modify config.yml from this repository or start out with the following content:
# Connect Box IP address
ip_address: 192.168.0.1

# Connect Box web interface password
password: WhatEverYourPasswordIs
Then run connectbox_exporter path/to/your/config.yml .
Add the following to your prometheus.yml:
scrape_configs:
  - job_name: 'connectbox'
    static_configs:
      - targets:
        - localhost:9705
One scrape takes roughly 6 seconds.
| Metric name | Description |
|---|---|
connectbox_device_info |
Assorted device information |
connectbox_provisioning_status |
Modem provisioning status |
connectbox_uptime_seconds |
Device uptime in seconds |
connectbox_tuner_temperature_celsius |
Tuner temperature |
connectbox_temperature_celsius |
Temperature |
connectbox_ethernet_client_speed_mbit |
Maximum speed of connected ethernet clients |
connectbox_wifi_client_speed_mbit |
Maximum speed of connected Wi-Fi clients |
connectbox_downstream_frequency_hz |
Downstream channel frequency |
connectbox_downstream_power_level_dbmv |
Downstream channel power level |
connectbox_downstream_snr_db |
Downstream channel signal-to-noise ratio (SNR) |
connectbox_downstream_rxmer_db |
Downstream channel receive modulation error ratio (RxMER) |
connectbox_downstream_codewords_unerrored_total |
Unerrored downstream codewords |
connectbox_downstream_codewords_corrected_total |
Corrected downstream codewords |
connectbox_downstream_codewords_uncorrectable_total |
Uncorrectable downstream codewords |
connectbox_upstream_frequency_hz |
Upstream channel frequency |
connectbox_upstream_power_level_dbmv |
Upstream channel power level |
connectbox_upstream_symbol_rate_ksps |
Upstream channel symbol rate |
connectbox_upstream_timeouts_total |
Upstream channel timeout occurrences |
connectbox_scrape_duration_seconds |
Connect Box exporter scrape duration |
connectbox_up |
Connect Box exporter scrape success |
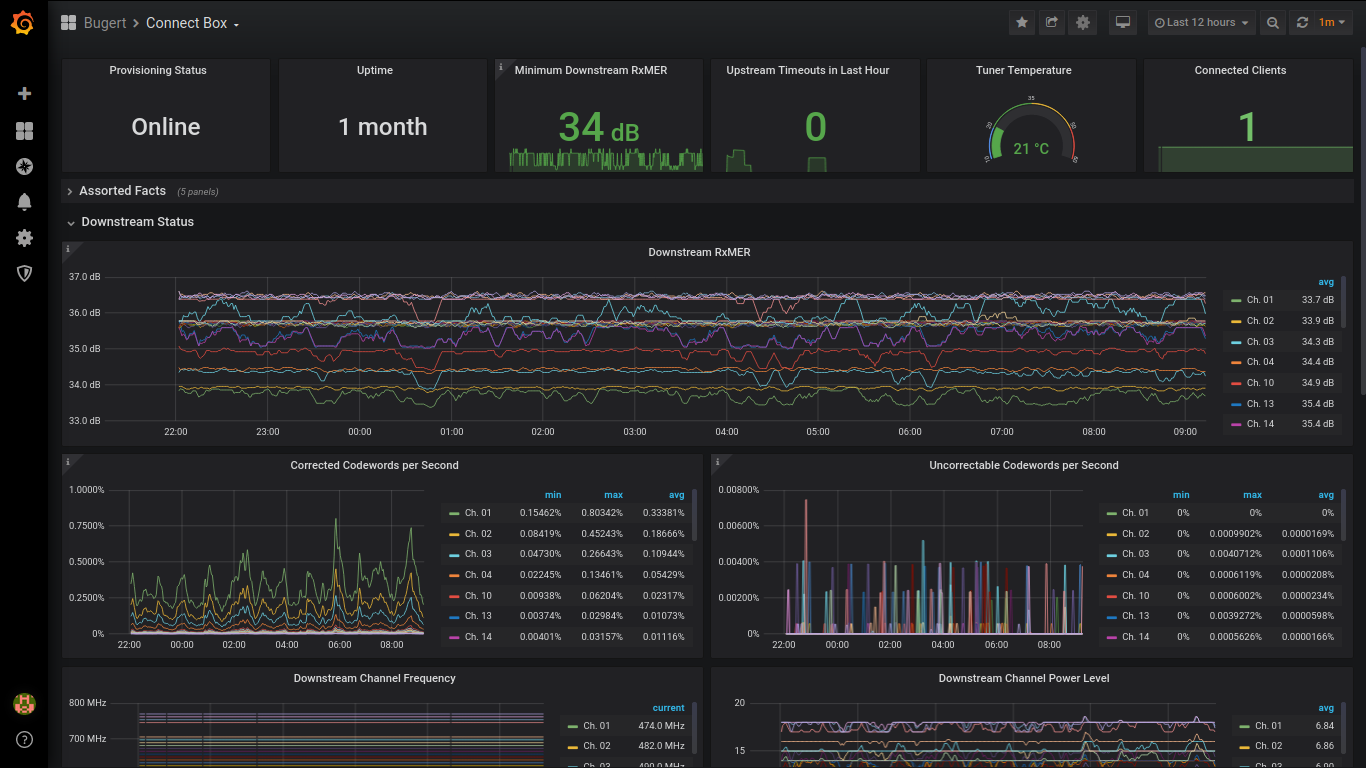
The above metrics can be monitored nicely in Grafana using this dashboard:
Pull requests are welcome. 😊
To install development dependencies, run:
pip install -r resources/requirements/development.txt


