A set of scripts which will identify high intensity blobs by scikit-image's blob detection algorithms and/or pyclesperacto_prototype'sdetect_maxima_box to detect local maxima. The point data is written onto .csv files and can be viewed on napari by the napari_viewer.py script producing an image, points and label layer.
- Create a new conda/mamba environment and install devbio-napari using mamba (already on OnDemand).
mamba create --name devbio-napari-env python=3.9 devbio-napari -c conda-forge -c pytorch
- Afterwards, activate the environment.
conda activate devbio-napari-env
Then navigate to the repo and run the desired scripts from the command line.
Iterates through .ome.tif files in Data folder and performs difference of gaussian assuming blobs are light on a darker backgorund and detect_maxima_box to locate the points of the blobs. Both methods work multi-dimensionally.
Outputs .csv files into the Data folder.
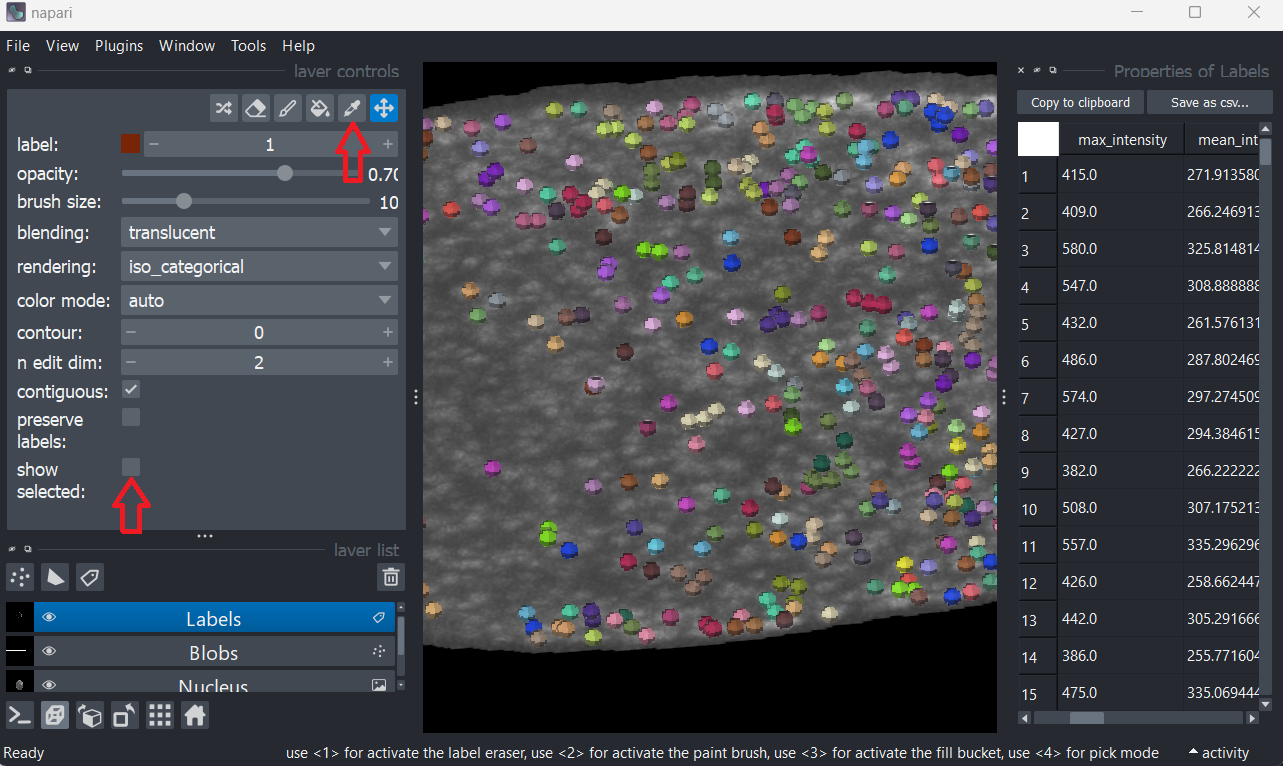
Reads .csv files in the Data folder and opens up napari viewer with the segmented nucleus as the image layer and detected blobs as a points and label layer. The napari-skimage-regionprops plugin measure properties of the blobs such as mean, min and max intensity.
Blobs can be individually selected from the viewer and the region properties can be saved as a .csv file.
Running the example_2_viewer.py will open napari with a table measuring the properties of the labels layer using regionprops. To interact with the labels and see which index corresponds to which region,
- activate
pick mode - tick
show selected - select any row/label in the table
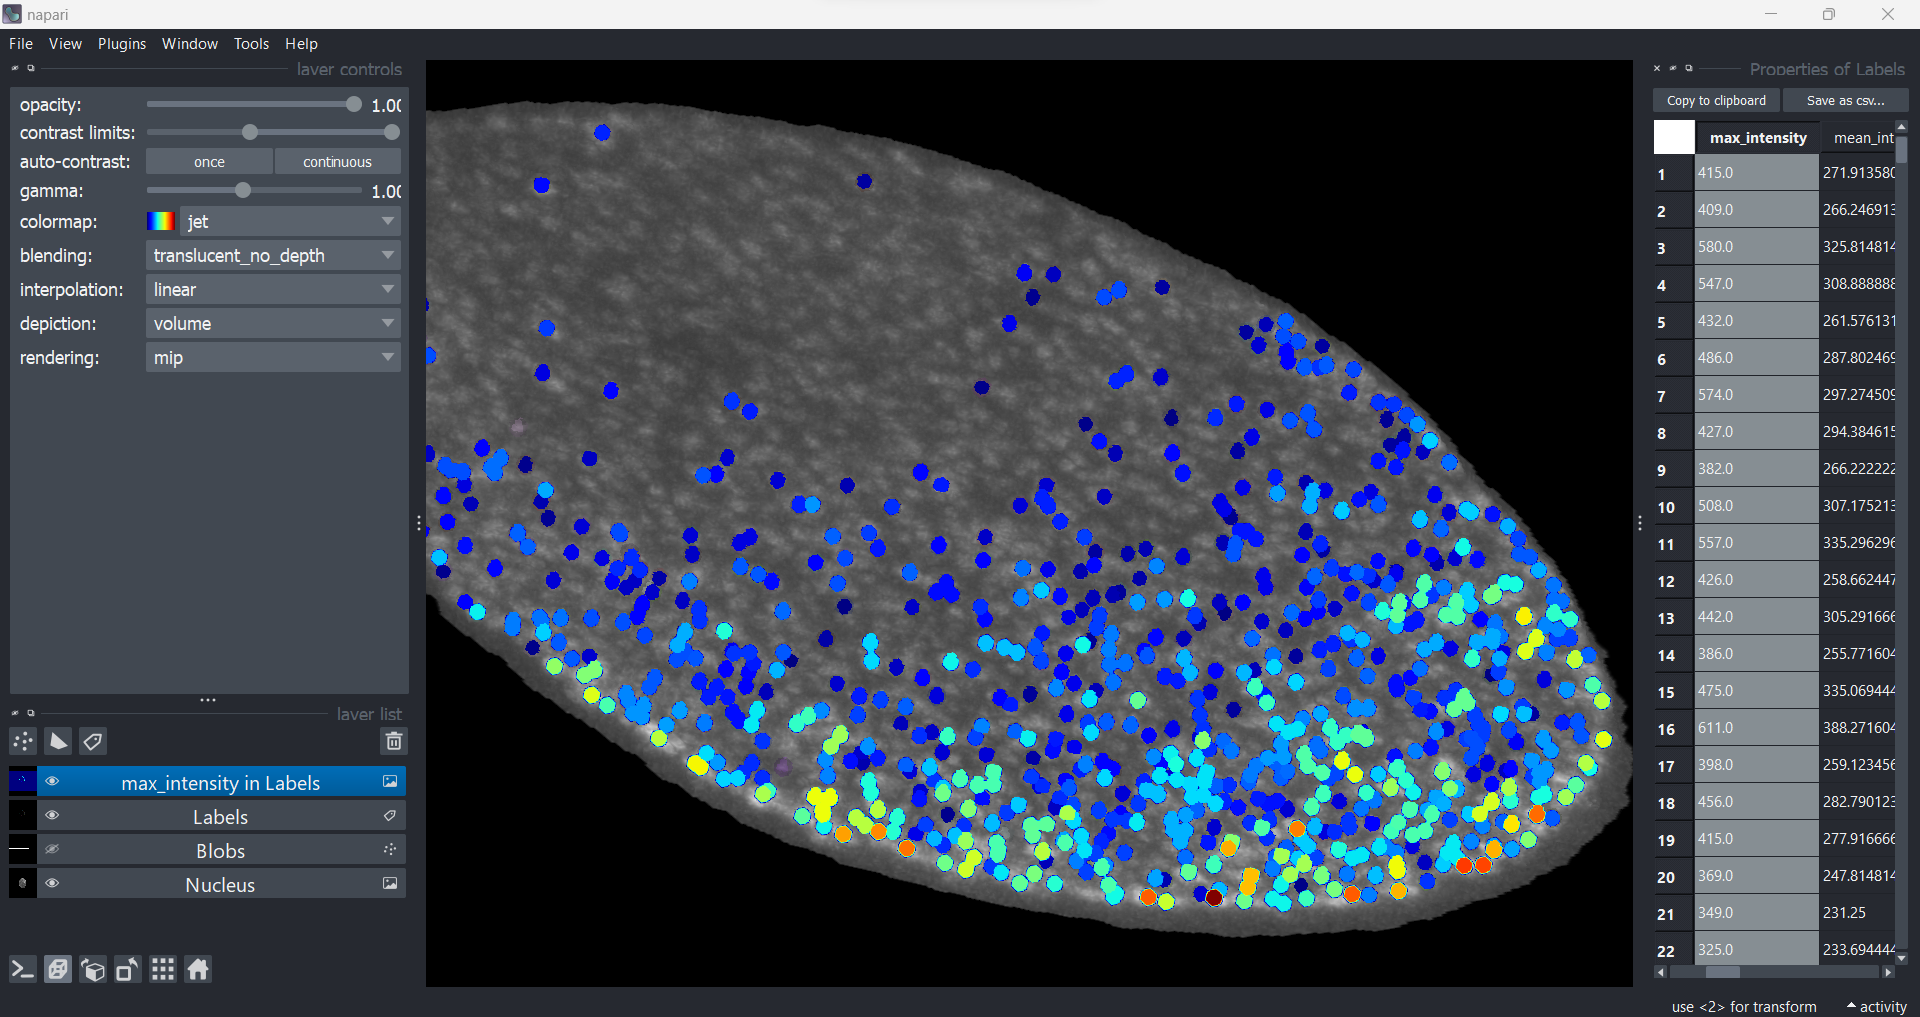
To visualise features across all regions, double click a column header and choose a colormap. Here, the maximum intensity of the blobs are visualised.

