DNS-collector acts as a passive high speed ingestor with pipelining support for your DNS logs, written in Golang. It allows enhancing your DNS logs by adding metadata, extracting usage patterns, and facilitating security analysis.
Additionally, DNS-collector also support
- Extended DNStap with TLS encryption, compression, and more metadata capabilities
- DNS protocol conversions to Plain text, Key/Value JSON, Jinja and more
- DNS parser with Extension Mechanisms for DNS (EDNS) support
- Live capture on a network interface
- IPv4/v6 defragmentation and TCP reassembly
- Nanoseconds in timestamps
-
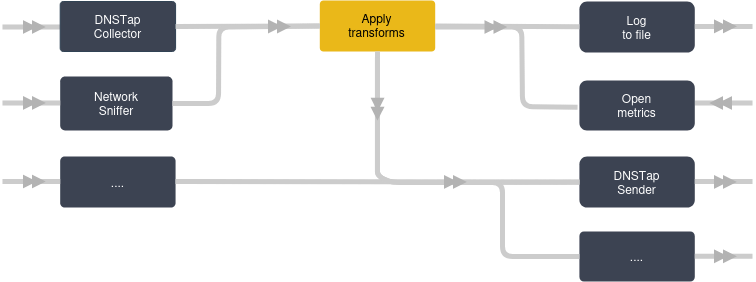
The DNS traffic can be collected and aggregated from simultaneously sources like DNStap streams, network interface or log files and relays it to multiple other listeners
You can also applied transformations on it like (traffic filtering, user privacy, ...).
-
- Listen for logging traffic with streaming network protocols
DNStapwithtls|tcp|unixtransports support andproxifierPowerDNSstreams with full supportDNSMessageto route DNS messages based on specific dns fieldsTZSPprotocol support
- Live capture on a network interface
- Read text or binary files as input
- Read and tail on
Plain textfiles - Ingest
PCAPorDNSTapfiles by watching a directory
- Read and tail on
- Local storage of your DNS logs in text or binary formats
- Provide metrics and API
PrometheusexporterOpenTelemetrytracing dnsStatsdsupportREST APIwith swagger to search DNS domains
- Send to remote host with generic transport protocol
- Send to various sinks
FluentdInfluxDBLokiclientElasticSearchScalyrRedispublisherKafkaproducerClickHouseclient
- Send to security tools
- Listen for logging traffic with streaming network protocols
-
- Detect Newly Observed Domains
- Rewrite DNS messages or custom Relabeling for JSON output
- Add additionnal Tags in DNS messages
- Traffic Filtering and Reducer
- Latency Computing
- Apply User Privacy
- Normalize DNS messages
- Add Geographical metadata
- Various data Extractor
- Suspicious traffic Detector and Prediction
- Reordering DNS messages based on timestamps
Download the latest release binary and start the DNS-collector with the provided configuration file. The default configuration listens on tcp/6000 for a DNSTap stream and DNS logs are printed on standard output.
./go-dnscollector -config config.ymlIf you prefer run it from docker, follow this guide.
The configuration of DNS-collector is done through a file named config.yml.
When the DNS-collector starts, it will look for the config.yml from the current working directory.
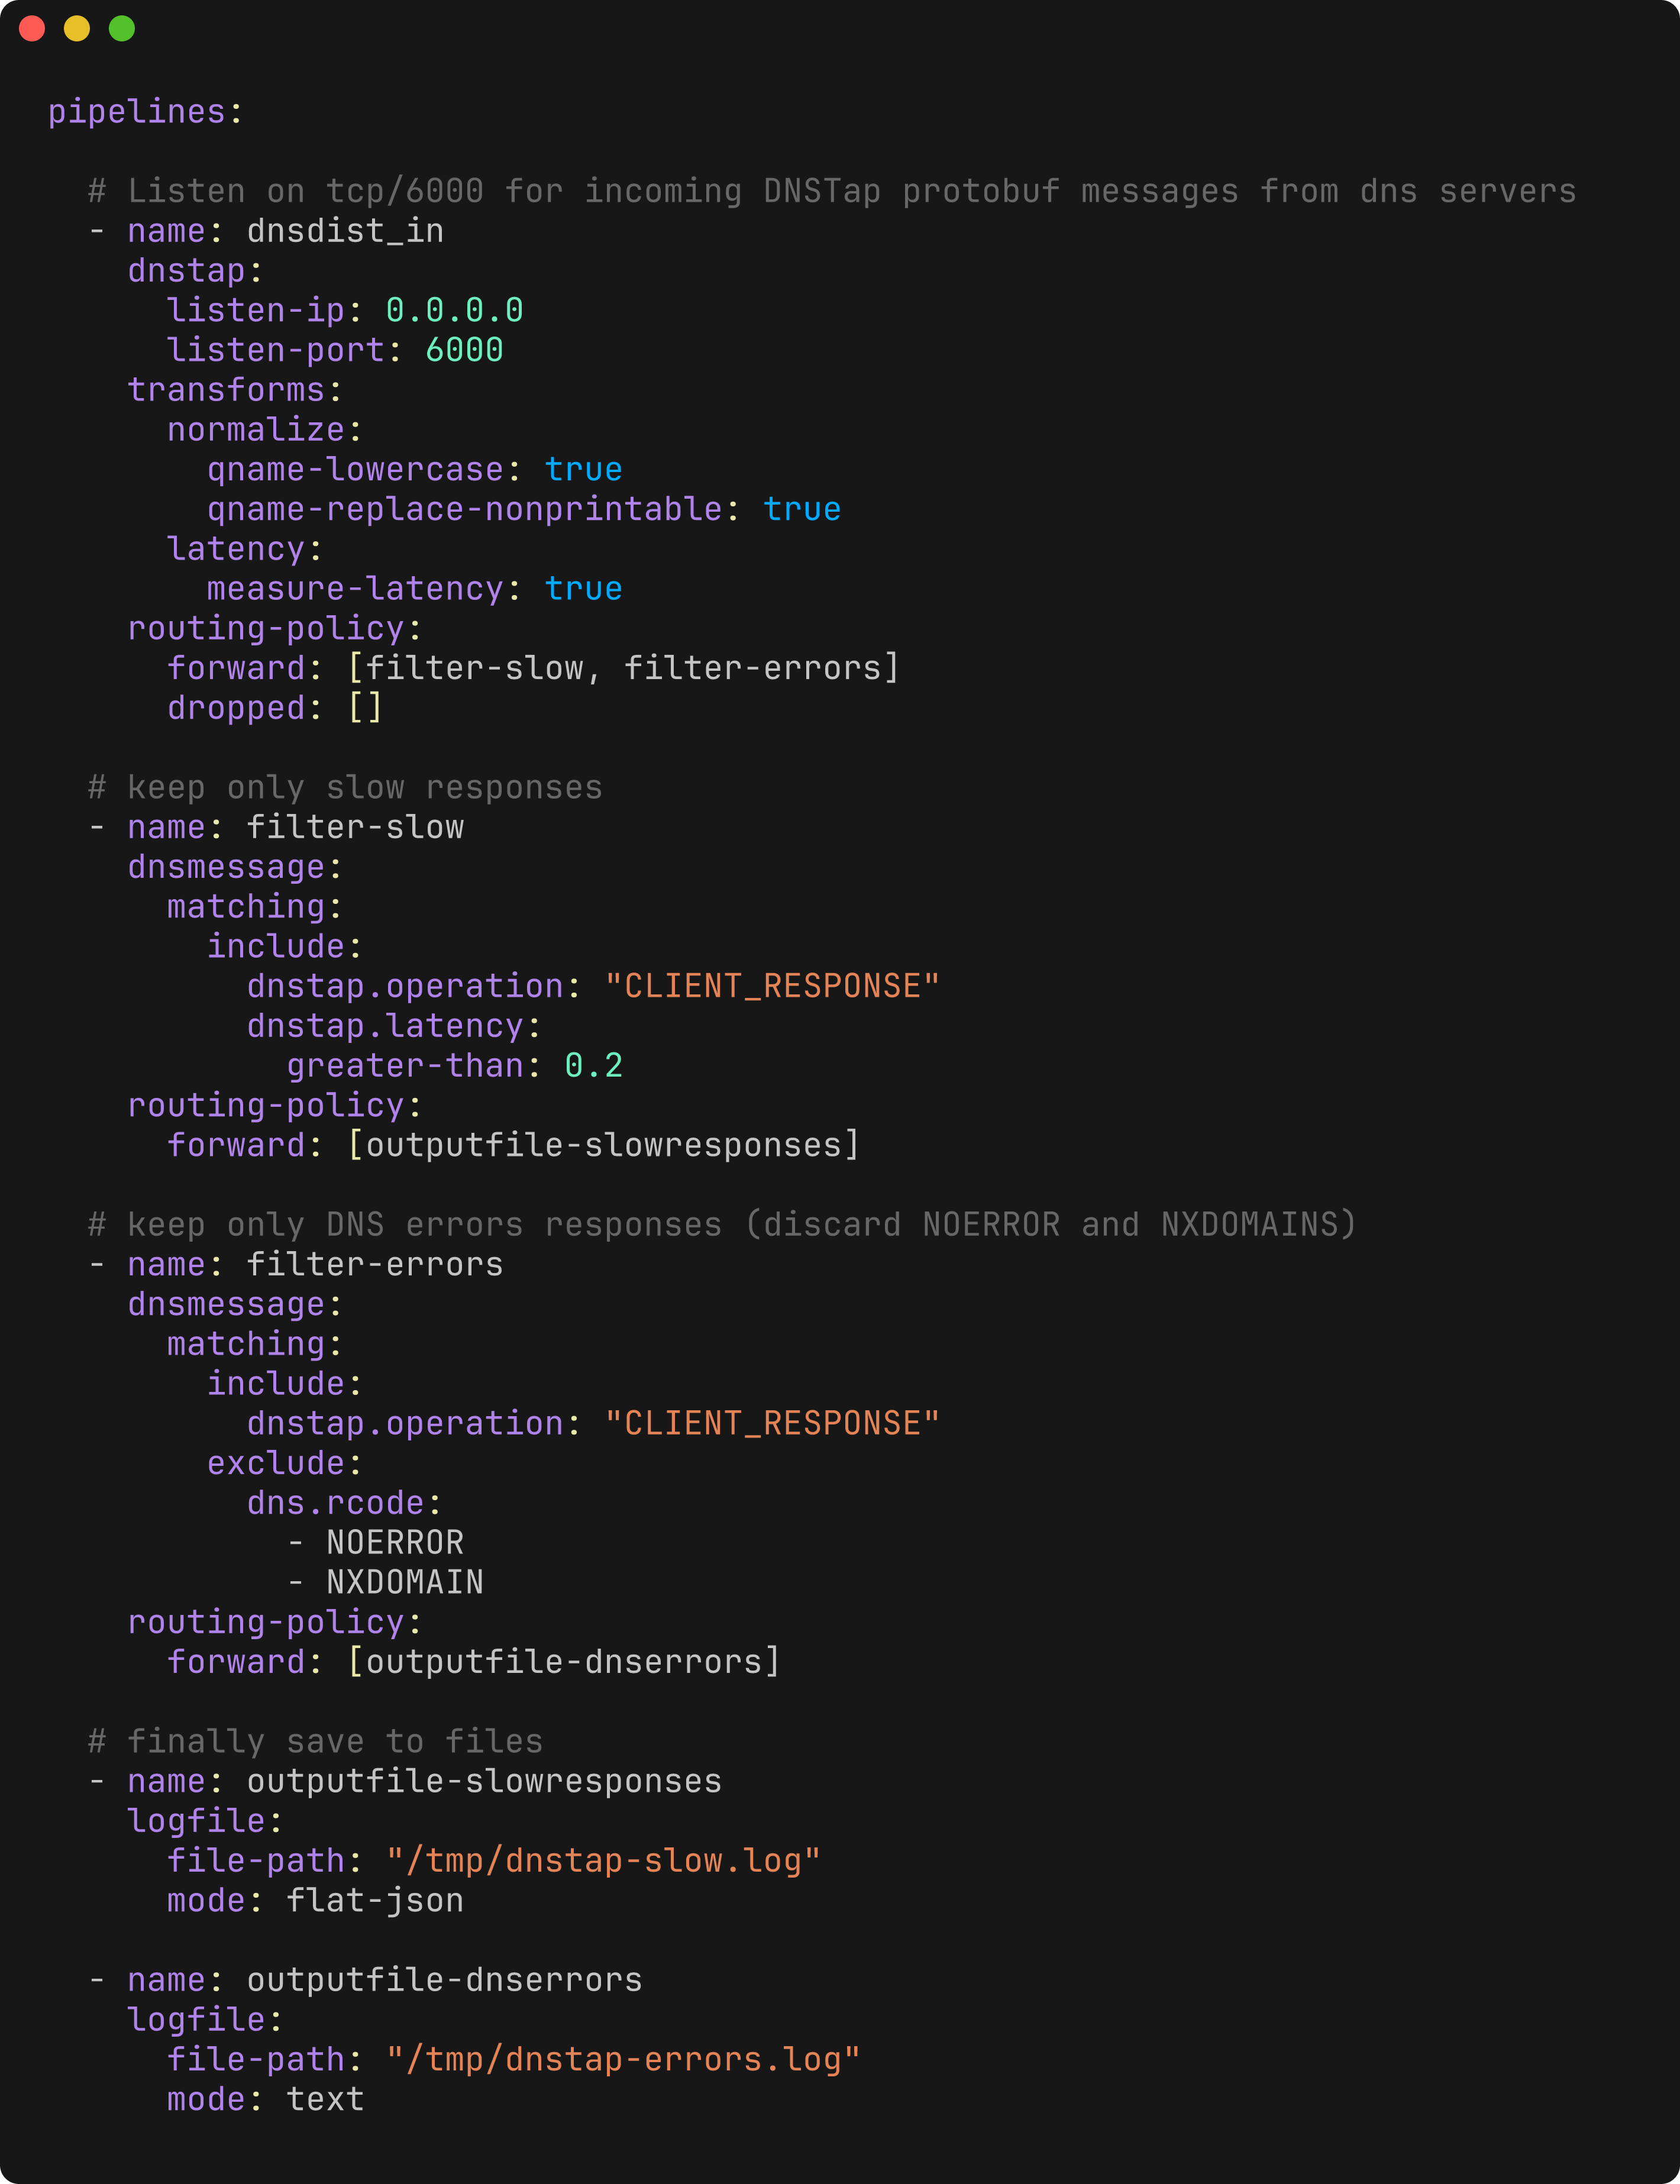
A typical configuration in pipeline mode includes one or more collectors to receive DNS traffic and several loggers to process the incoming data.
To get started quickly, you can use this default config.yml. You can also see the _examples folder from documentation witch contains a number of various configurations to get you started with the DNS-collector in different ways.
For advanced settings, see the advanced configuration guide.
Additionally, the _integration folder contains preconfigured files and docker compose examples
for integrating DNS-collector with popular tools:
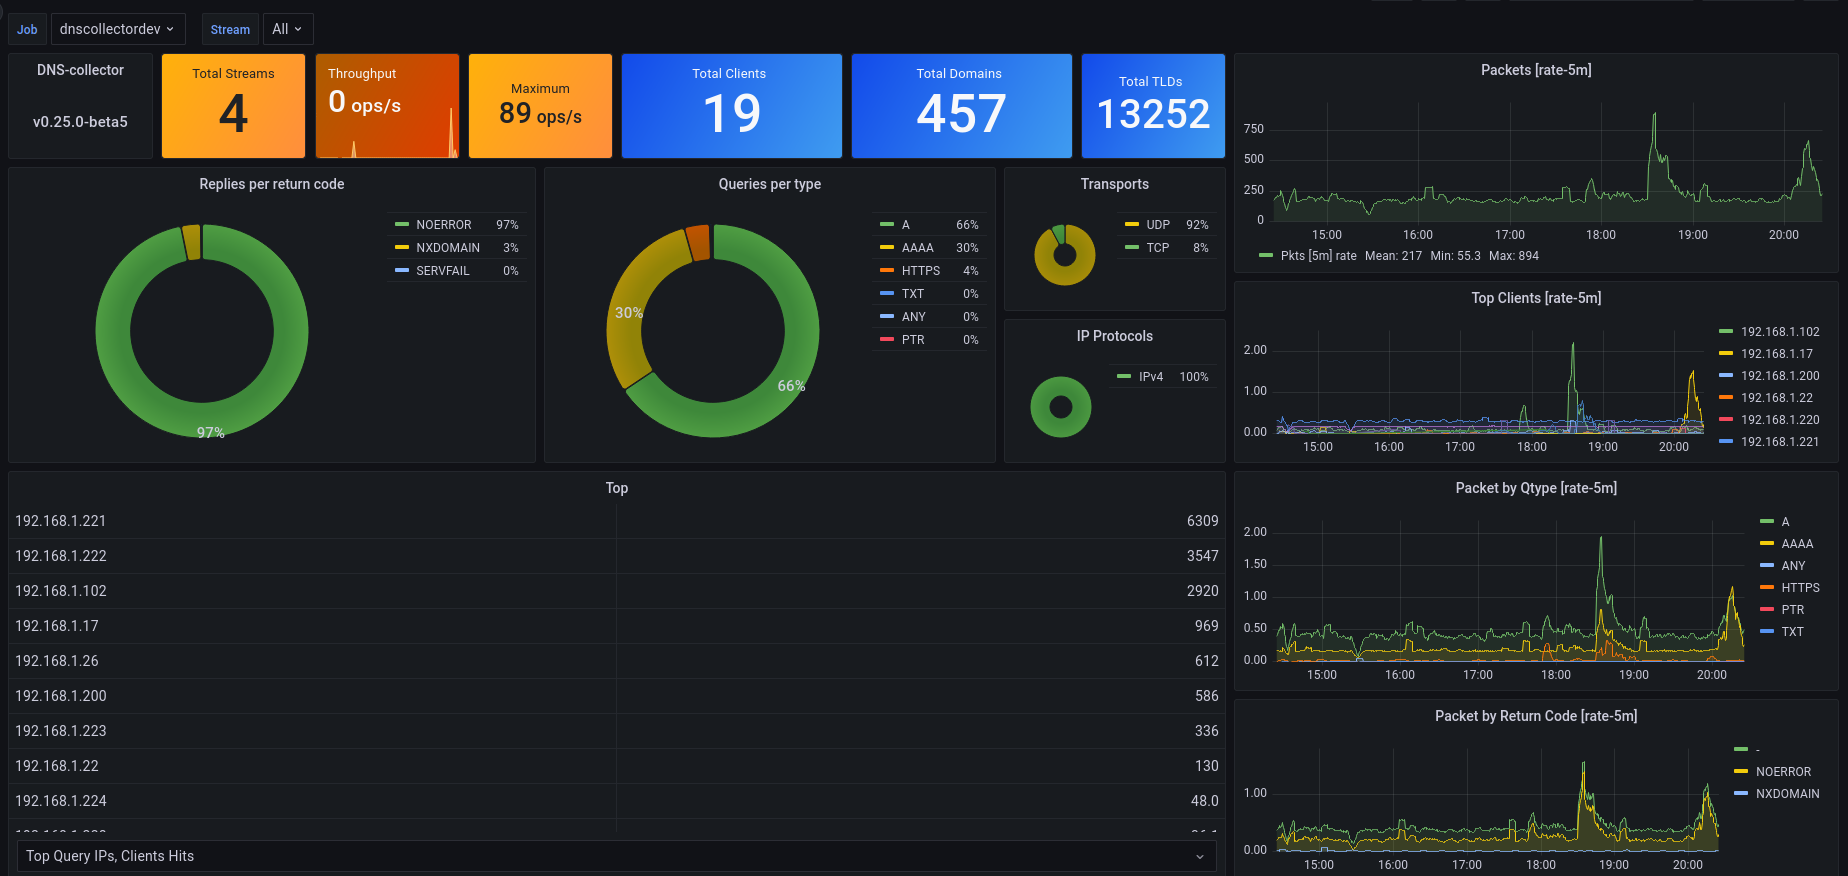
DNS-collector provides telemetry capabilities with the Prometheus logger,
you can easily monitor key performance indicators and detect anomalies in real-time.
Tuning may be necessary to deal with a large traffic loads. Please refer to the performance tuning guide if needed.
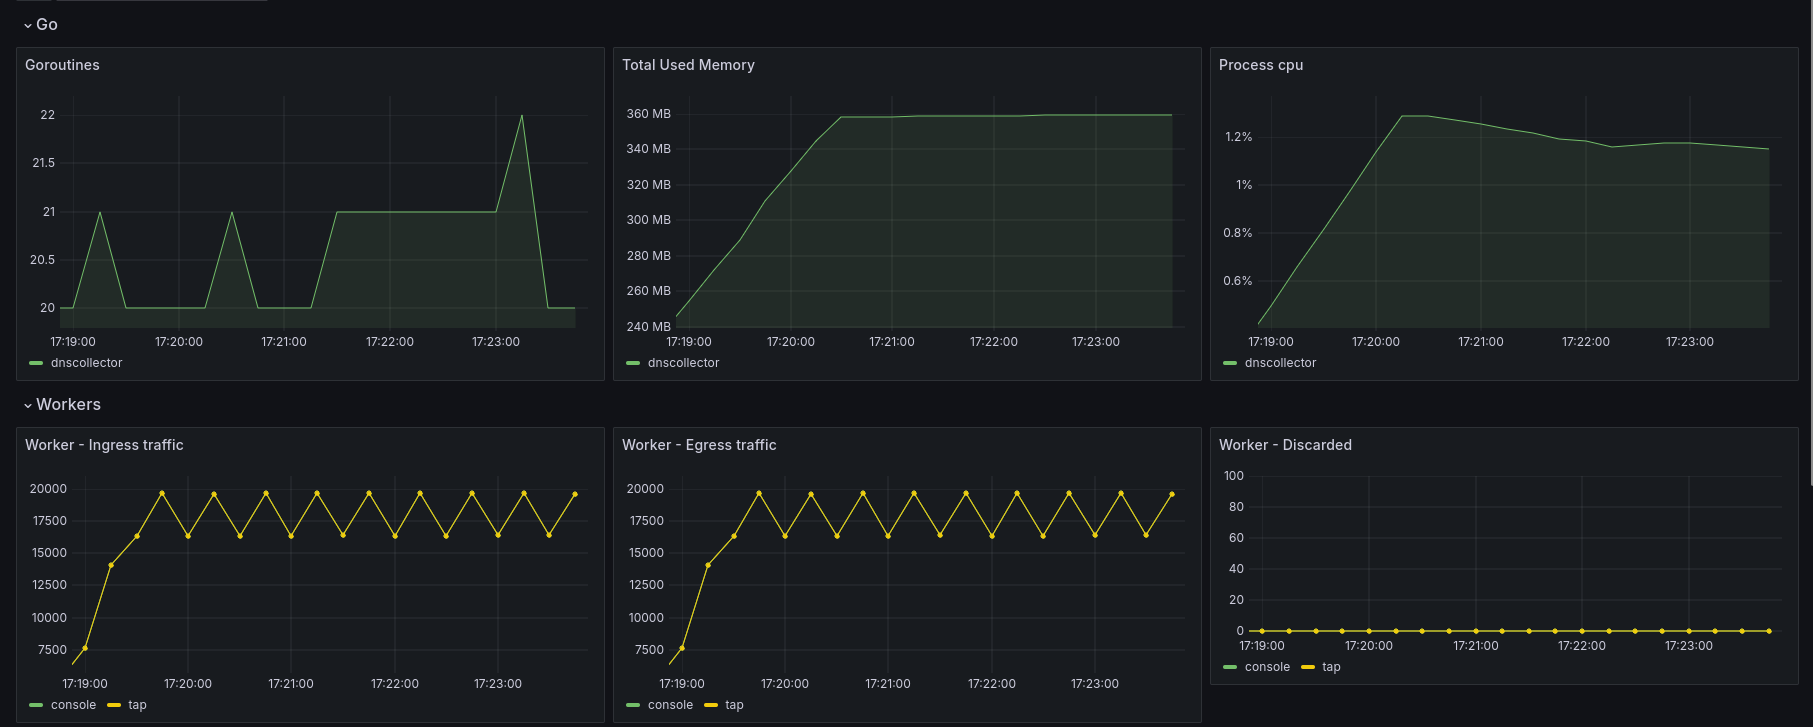
Performance metrics are available to evaluate the efficiency of your pipelines. These metrics allow you to track:
- The number of incoming and outgoing packets processed by each worker
- The number of packets matching the policies applied (forwarded, dropped)
- The number of "discarded" packets
- Memory consumption
- CPU consumption
A build-in dashboard is available for monitoring these metrics.
See the development guide for more information on how to build it yourself.


