Graphviz is like markdown, for diagrams.
It's a tool that can transform text input into a "directed graph" output, which is nodes pointing to other nodes. You can use it for architecture diagrams, DB diagrams, documentation for users, etc.
This is a step by step tutorial, introducing commonly used features of graphviz one at a time.
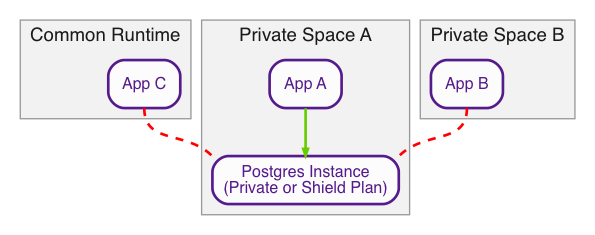
By the end, we'll produce this diagram.
You'll learn about:
- nodes & connections
- how to style connections (nodes are similar)
- how to do multiline text in nodes
- grouping nodes using subgraphs
- applying styles globally
- ordering affects how it's drawn
- specify where on the node the connection attachmes
To start, open the commits tab and open each commit from bottom to top - each one in its own tab.
Here is an example of what the commit view looks like
- the description in the commit at the top describes the change
- you can see both the text changes and the image changes
You'll want to use a tool with a two-pane layout - the left side is the source text, the right side is the image output.
- For just you working on it, use http://graphviz.it (shown above; it has more features)
- For realtime collaboration, use http://graphvizrepl.com
You should keep track of your diagrams somewhere - I recommend in a github repo. Suggestion-instructions here in this gist.


