Let
The objective is to analyse the persistent homology of many graphs related with different keywords and to observe how fakenews influence their topological structure. These features can be used to classify graphs between 'organic graphs' or 'graphs influenced by fakenews'.
To run all code here you will need to
- Work on a GNU/LINUX machine;
and to install
- Graphviz
- Python 3 and pip
- SQLite
- PERL and a library to run the database engine: perl-dbi
- gcc, make and the library pthreads
- Numpy, Scipy, Matplotlib, statsmodels, gudhi, scipy
(Install all of this with pip).
pip install numpy, ccipy, matplotlib, statsmodels, gudhi, scipy
# OR if this doesn't work
pip3 install numpy, ccipy, matplotlib, statsmodels, gudhi, scipy
On other branchs, instead of master, you can find many analysis that I am doing, or I have tried and succeded or failed.
Branchs:
-
pph_versions: many versions of my C file programs. All versions are always an attempt of mine to improve performance
-
filtration_versions: many versions of programs in charge of building a simplicial filtration
-
trying_some_analysis: Other analysis that I tried on the data.
-
trash: All my failures are here.
-
pph_only_dim0: Here I have studied topological features on dimension 0.
-
Firstly, a developer account on Twitter is needed.
-
Secondly, a Bearer Token is needed. It can be generated on the the section of authentication tokens at the developer portal.
Assume that you want to download tweets containing the keywords
- hello AND "hello world" created between 12:00 (UTC 0) and 12:20(UTC 0) of the day 2021-01-15. Below are the steps necessary to create the respective database.
Head to the folder database and edit the files keywordsList.txt and time.txt with the desired parameters. These files have explanation on how to change them. Then a few commands are necessary to be issued.
Follow the command lines below and a file named twitter.db will be created
cd database
chmod +x searchTweets.sh
chmod +x insertTweetsAndUsersToDB.pl
chmod +x populateDB_part1.sh

./searchTweets
./populateDB_part1
The file twitter.db is a Relational Database satisfying the Entity-Relation diagram below.
There are more relations on the database but their utility is only for future computations. The raw data collected from the scripts above are in the relations of the diagram above.
The atributes of the relational database are quite straightforward. The only atribute that is worth mentioning is tweet_type. This atribute has as possible values:
- retweet: the tweet is a RT;
- reply: the tweet is a reply for another tweet;
- quote_plus_reply: the tweet is a quote plus a reply to another tweet;
- simple_message: the tweet is a simple message created by a user;
- quote_plus_simple_message: the tweet is a simple message whose content includes a quote to another tweet.
Do the following
# Given that you are still inside folder database
mv twitter.db ../graph_tools
cd ../graph_tools

chmod +x *.pl
chmod +x *.sh
./run_scripts.sh
Now the users interaction Graph has been created inside twitter.db. The relation taking care of this graph is called paths_xy. (There is another relation called nodes that creates a forest where each node is a tweet and each child is an interaction tweet with its parent. This relation is not used by us anymore but I left on the database)
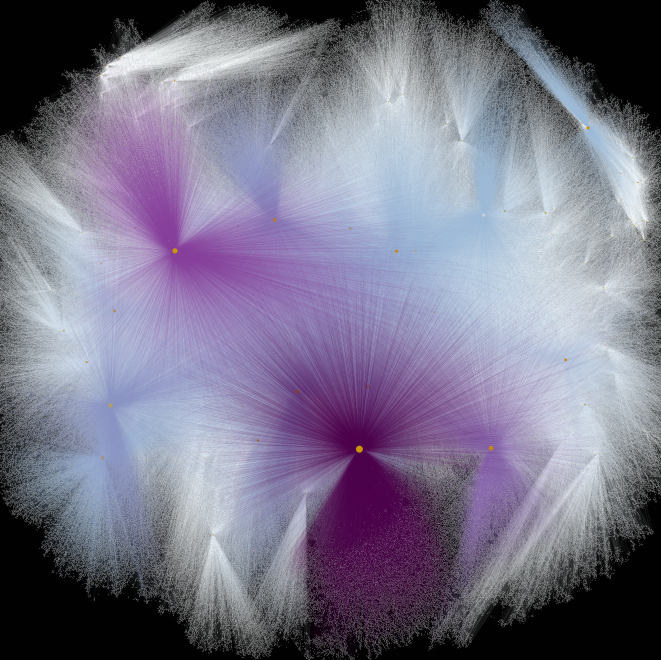
It is possible to vizualise the users interaction graph. To have an idea on how it looks like do
# while still on the folder graph_tools
mv twitter.db ../plot_graph/
cd ../plot_graph

chmod +x print_plots.sh
./print_plots
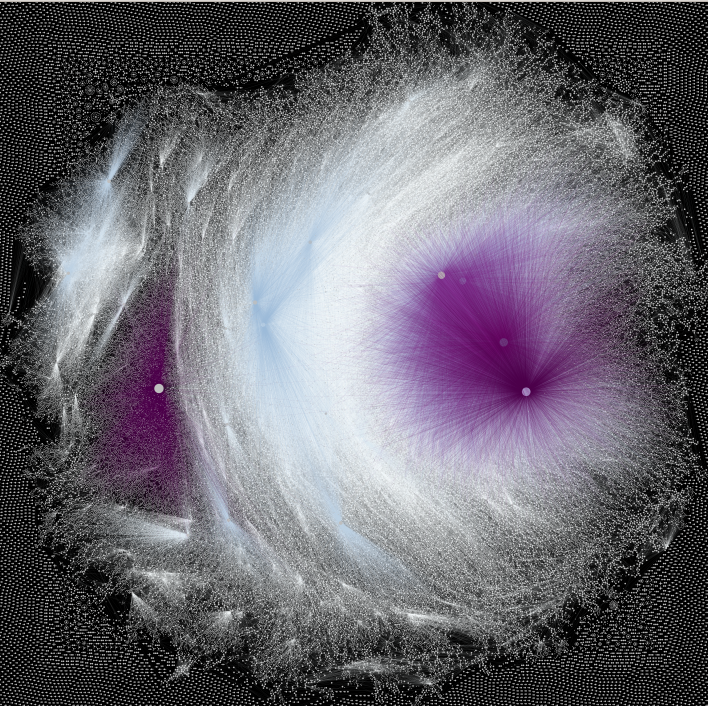
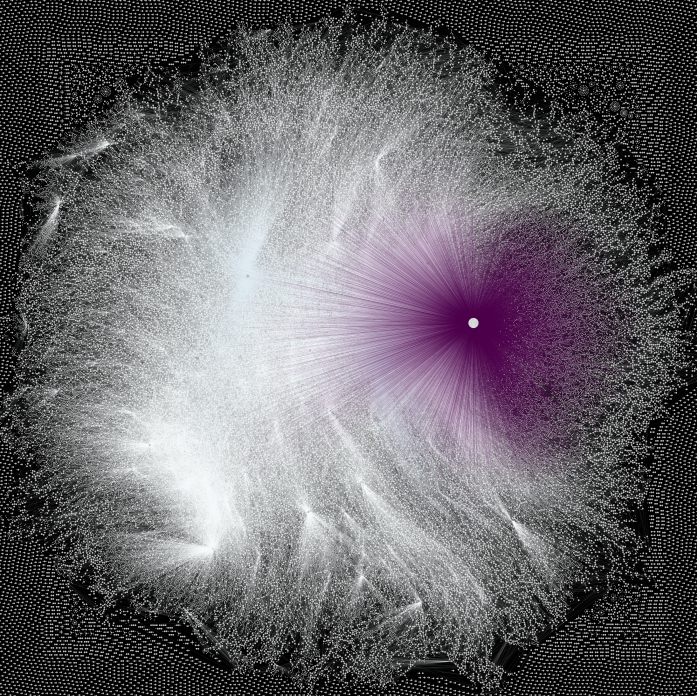
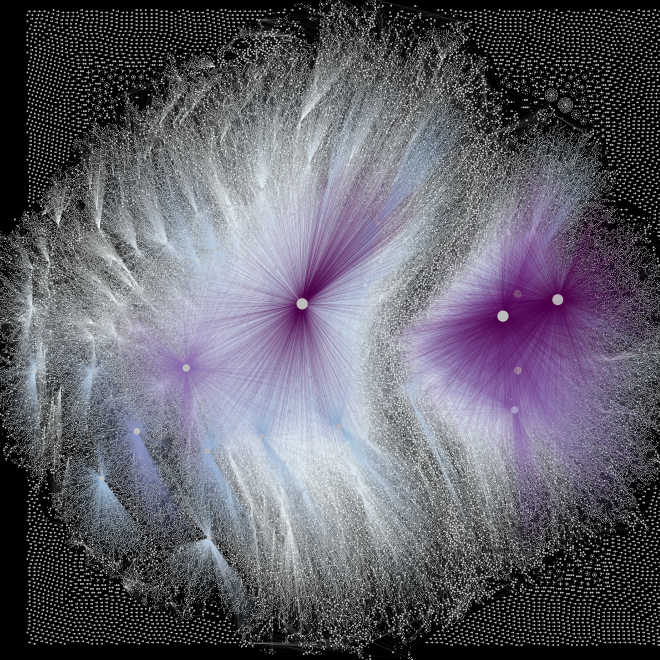
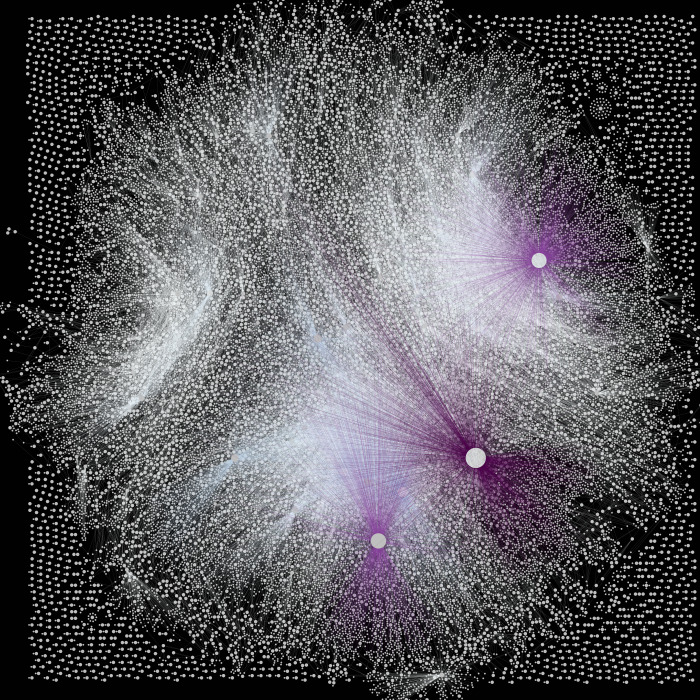
At the end many plots will be made showing the most influent users and their connections. To help make it easy to see some plots will ignore vertex that are not that influent on the graph.
Down below some examples obtained by me.
Copy the resulting twitter.db file obtained at the section before inside the folder calculate_pph_of_twitterDB/. Do something like this
# Assume that we are inside the folder fakeNewsAnalysis/
# and twitter.db is inside graph_tools/
#
# Also, lets assume that twitter.db is related with topics on politcs.
# Whenever creating the folder down below follow the convention of copying
# twitter.db inside a folder named graph_ALABEL

mkdir calculate_pph_of_twitterDB/graph_politcs
cp graph_tools/twitter.db calculate_pph_of_twitterDB/graph_politcs
After doing this, create a file inside calculate_pph_of_twitterDB/graph_ALABEL (in our example is calculate_pph_of_twitterDB/graph_politcs) named as dates.txt. Such files must contain two dates that are important for the analysis. For example
$ cd calculate_pph_of_twitterDB/graph_tools
$ cat dates.txt
2022-01-01
2022-01-02
Now there are two variables inside calculate_pph_from_samples.sh that must be set. They are
sampleSize='20'
amountOfSamples=100
where
- sampleSize is the size in percentage of the sample to be taken from twitter.db to calculate the persistent homology. This is necessary given the size of the graphs (something around millions of edges in some cases)
- amountOfSamples is the number of how many times we will take a sample from the users interaction graph and calculate its persistent path homology.
Once everything is set we can issue the command
chmod +x calculate_pph_from_samples.sh
./calculate_pph_from_samples
or, depending on how many cpus you have (lets assume 4), you can run alternatively the following
chmod +x calculate_pph_from_samples.sh
./calculate_pph_from_samples 0 &
./calculate_pph_from_samples 1 &
./calculate_pph_from_samples 2 &
./calculate_pph_from_samples 3 &
In the end, inside the folder ~/fakeNewsAnalysis/calculate_pph_of_twitterDB/graph_ALABEL we will have many folders named as sample0, sample1, ... containing all persistent path homology in the files pph0.txt, pph1.txt

